2344
Extended texture analysis of unenhanced T1 and T2 sequences on whole body MRI for evaluation of response to chemotherapy in patients with multiple myeloma1Diagnostic and Interventional Radiology, University Hospital Tubinga, Tubinga, Germany, 2Diagnostic and Interventional Radiology, University Hospital Ulm, Ulm, Germany
Synopsis
Extended texture analysis of unenhanced T1 and T2 sequences on whole body MRI for evaluation of response to chemotherapy in patients with multiple myeloma. Patients in a pre-treatment and post-treatment setting using a standardized imaging protocol and a standardized hematological and clinical surveillance were included. 107 features, based on the pyradiomics library, were analyzed for the main medullary lesion in myeloma patients. Extracted texture features were able to discriminate between responders and non-responders at follow-up in particular when using T2-imaga data.
Introduction
Multiple myeloma is a malignant hematologic disease of mature plasma cells with a poor prognosis. It affects in the first line the bone marrow which can be involved in a diffuse or focal manner. Diagnosis as well as disease surveillance are based on measurements of M-gradient. However, the secretory function does not always parallel the tumor burden and some myelomas are asecretory and cannot therefore be monitored by hematological tests. For this purpose, bone marrow imaging has gained increased attention for diagnosis, but has been less frequently used for treatment monitoring due to the great variety in signal changes throughout the ancillary T1/T2-sequences and also over the time following therapy. At this point, structural changes induced by therapy are expected to be more accurately depicted by extended texture analysis which is a new post-processing technique. Hence, the aim of this project was to identify textural features that could reliably differentiate responders from non-responders.Method
We retrospectively evaluated 27 consecutive myeloma patients who underwent whole-body unenhanced MRI (wb-MRI) in the pre-treatment and post-treatment setting (mean 10 months) using a standardized imaging protocol and a standardized hematological and clinical surveillance including M-gradient measurements (every three months). A total of 54 wb-MRI were finally analyzed. The patients received different treatment regimens, 15/27 (55%) underwent autologous stem cell transplantation. Primary therapy consisted of bortezomibe/lenalidomde/dexamethasone(VRD) 9/27, VRD/Elotzumab 7/27 and 4/27 bortezomib/cyclophosphamide/dexamethasone (remaining patients received a combination or singular treatment). Response categories were defined according to the International Myeloma Working Group (IMWG)1. Complete response (11/22), very good partial response (4/22) or partial responses (7/22) were grouped together as responders whereas patients experiencing stable (3/5) and progressive response (2/5) were classified non-responders2. Therapy response was not evenly distributed with 22 responders and 5 non-responders.
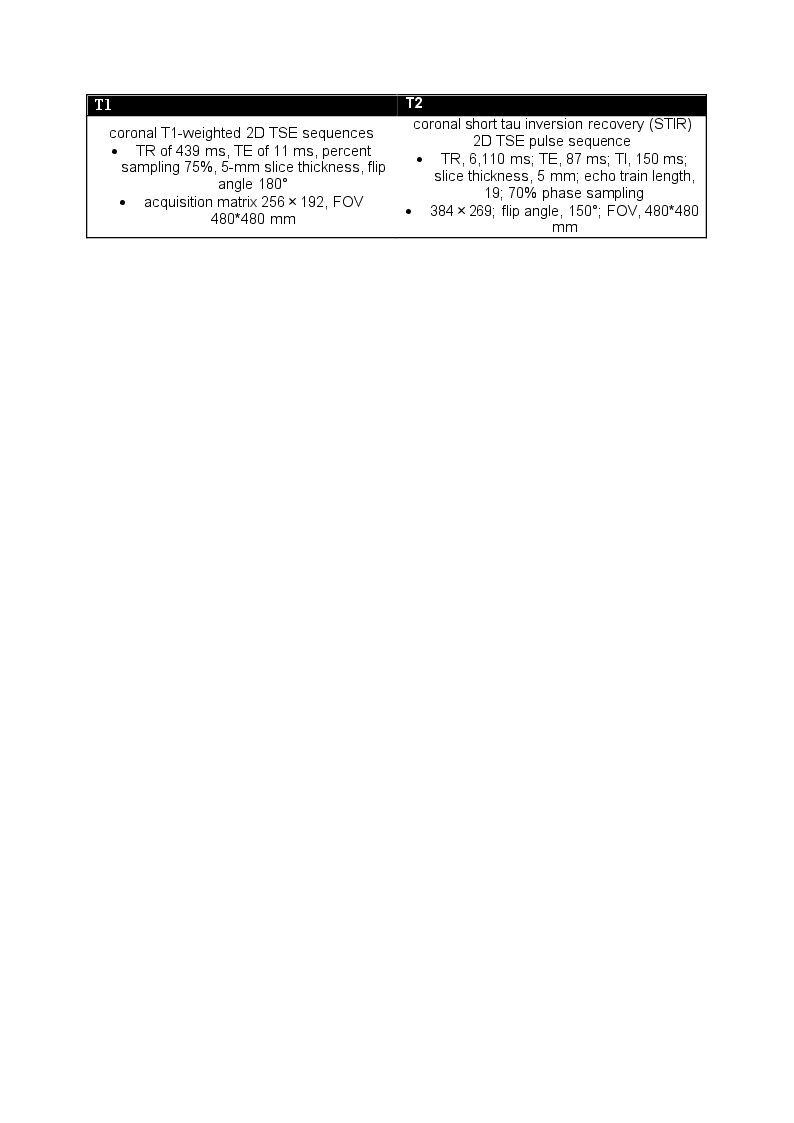
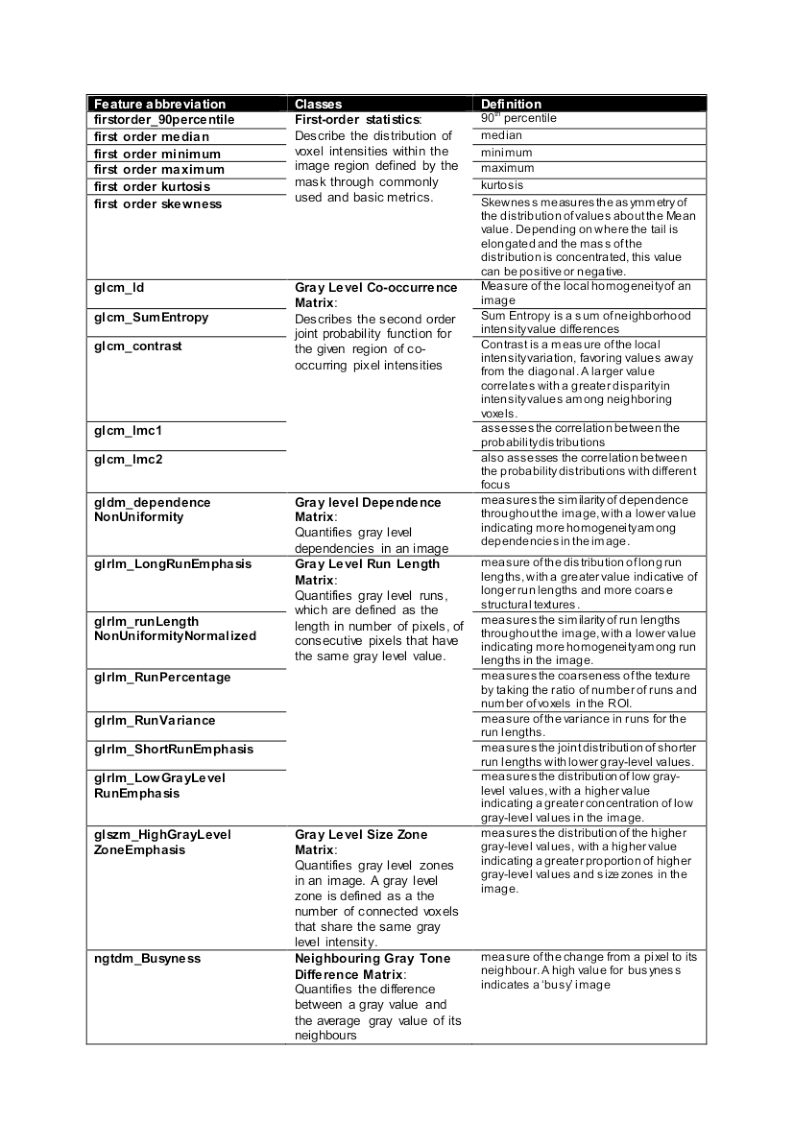
MRI examinations were performed on a 1.5 T MR-scanner (MAGNETOM Avanto; Siemens Healthcare, Erlangen, Germany) using multiple sets of phased-array surface coils for covering the head, neck, chest and abdomen, pelvis and thighs. Coronal scans were acquired in four contiguous regions being subsequently composed to a wb-scan. The protocol consisted of coronal short tau inversion recovery (STIR) 2D TSE pulse sequence and coronal T1-weighted 2D TSE sequences (figure 1). The reader defined the main (largest) focal medullary lesion and subsequently set a volume of interest (VOI) in that lesion. Focal spots were contoured at their largest extent. Texture feature analysis was performed using the pyradiomics library3. Only original order features were included, filtered features (i.e. wavelets, square root) were not included due to the small sample size. Altogether 107 features were extracted and used for texture analysis. Figure 2 includes the definitions of the extracted textural features. The hematological laboratory was considered ground truth.
Inter-rater testing was performed by a second experienced radiologist. Statistical analysis was performed by Kolmogrov-Smirnov normality testing and tendencies analyzed through Wilcoxon signed rank test.
Results
T1 features: Comparison of textural features for T1 in responders and non-responders at baseline yielded no significant difference. At follow-up, following textural features diverged significantly: 1st order skewness (Z=-2.31, p=0.02) and higher order glrlm_LowGrayLevelRunEmphasis (Z=-2.43, p=0.01). Monitoring positive therapy response showed significant quantifiable features in particular in T1 with glcm_ld (Z= -2.32, p=0.02), glcm_InverseVariance (Z= -2.29, p=0.02) and glcm_SumEntropy (Z=-2.55, p=0.01).
T2 features: Comparison of textural features for T2 in responders and non-responders at baseline yielded no significant difference. Textural features diverged significantly at follow-up in responders compared to non-responders in particular in terms of glcm_contrast (Z=-2.29, p>0.025), gldm_dependenceNonUniformity (Z=-2.37, p>0.025), glrlm_LongRunEmphasis (Z=-2.24, p>0.025), glszm_HighGrayLevelZoneEmphasis (Z=-2.12, p>0.025), ngtdm_Busyness (Z=-2.45, p>0.025).
Monitoring positive therapy response between baseline and follow-up showed significant quantifiable features with three clusters of features for first order statistics (firstorder_90percentile, median, minimum, maximum, kurtosis; Z<-4.1, p>0.001), glcm_lmc1 and lmc2 (Z<-4.1, p>0.001) as well as glrlm_runLengthNonUniformityNormalized, RunPercentage, RunVariance and ShortRunEmphasis (Z<-2.3, p>0.02). Non-responders showed no significant change in texture features.
Conclusion
MRI-textural features of the main medullary lesion in myeloma patients can discriminate between responders and non-responders at follow-up in particular when using T2-imaga data.Acknowledgements
No acknowledgement found.References
1. Durie BG, Kyle RA, Belch A, Bensinger W, Blade J, Boccadoro M, et al. Myeloma management guidelines: a consensus report from the scientific advisors of the International Myeloma Foundation. Hematol J. 2003;4(6):379–98.
2. International Myeloma Working Group. Criteria for the classification of monoclonal gammopathies, multiple myeloma and related disorders: a report of the International Myeloma Working Group. Br J Haematol. 2003;121(5):749–57.
3. van Griethuysen, J. J. M., Fedorov, A., Parmar, C., Hosny, A., Aucoin, N., Narayan, V., Beets-Tan, R. G. H., Fillon-Robin, J. C., Pieper, S., Aerts, H. J. W. L. (2017). Computational Radiomics System to Decode the Radiographic Phenotype. Cancer Research, 77(21), e104–e107. https://doi.org/10.1158/0008-5472.CAN-17-0339
Figures