2342
SLICs Algorithm for Non-Invasive Response Evaluation in Osteosarcoma with Multiparametric MR Imaging1Centre for Biomedical Engineering, Indian Institute of Technology Delhi, New Delhi, India, 2Medical Oncology, IRCH, All India Institute of Medical Sciences, New Delhi, India, 3Radio Diagnosis, All India Institute of Medical Sciences, New Delhi, India
Synopsis
Osteosarcoma is a highly morbid bone-tumor with poor prognosis. Neoadjuvant-chemotherapy(NACT) is the current standard of care. The response of NACT is judged on Histopathology-examination(HPE) after surgical resection of tumor. However, a non-invasive and accurate methods for evaluation of treatment response during the course of therapy is highly desirable. In this research, a Simple-linear-iterative-clustering supervoxels(SLICs) algorithm based methodology using multiparametric MRI (T2,DWI and ADC) has been developed for identification of sub-parts of tumor (active-tumor, necrosis). The volume of active-tumor and necrosis were estimated using this novel approach in patients with OS, before NACT(baseline) and after 3 cycles of NACT(follow-up). The level of necrosis estimated using SLICs and measure with HPE showed a close match. SLICs based estimation of necrosis level is a non-invassive technique that can be useful in response evaluation of cancer imaging.
Purpose
Osteosarcoma is a primary bone tumor in children and adolescents1. Despite improvements in diagnosis and treatment like neoadjuvant chemotherapy(NACT), it has high morbidity and poor overall prognosis1,2. Identification of tumor and its assessment is crucial in treatment-planning and monitoring treatment-response. Histopathology is the gold standard to evaluate the response of NACT, but is possible only after surgical resection. Non-invasive and accurate methods is desirable for evaluation of treatment response during the course of therapy. We investigated a fully automated Simple-linear-iterative-clustering(SLIC)3 supervoxels-based method4,5 for detection and identification of level of edema, active-tumor and necrosis in osteosarcoma before and after NACT using MR imaging.Methods
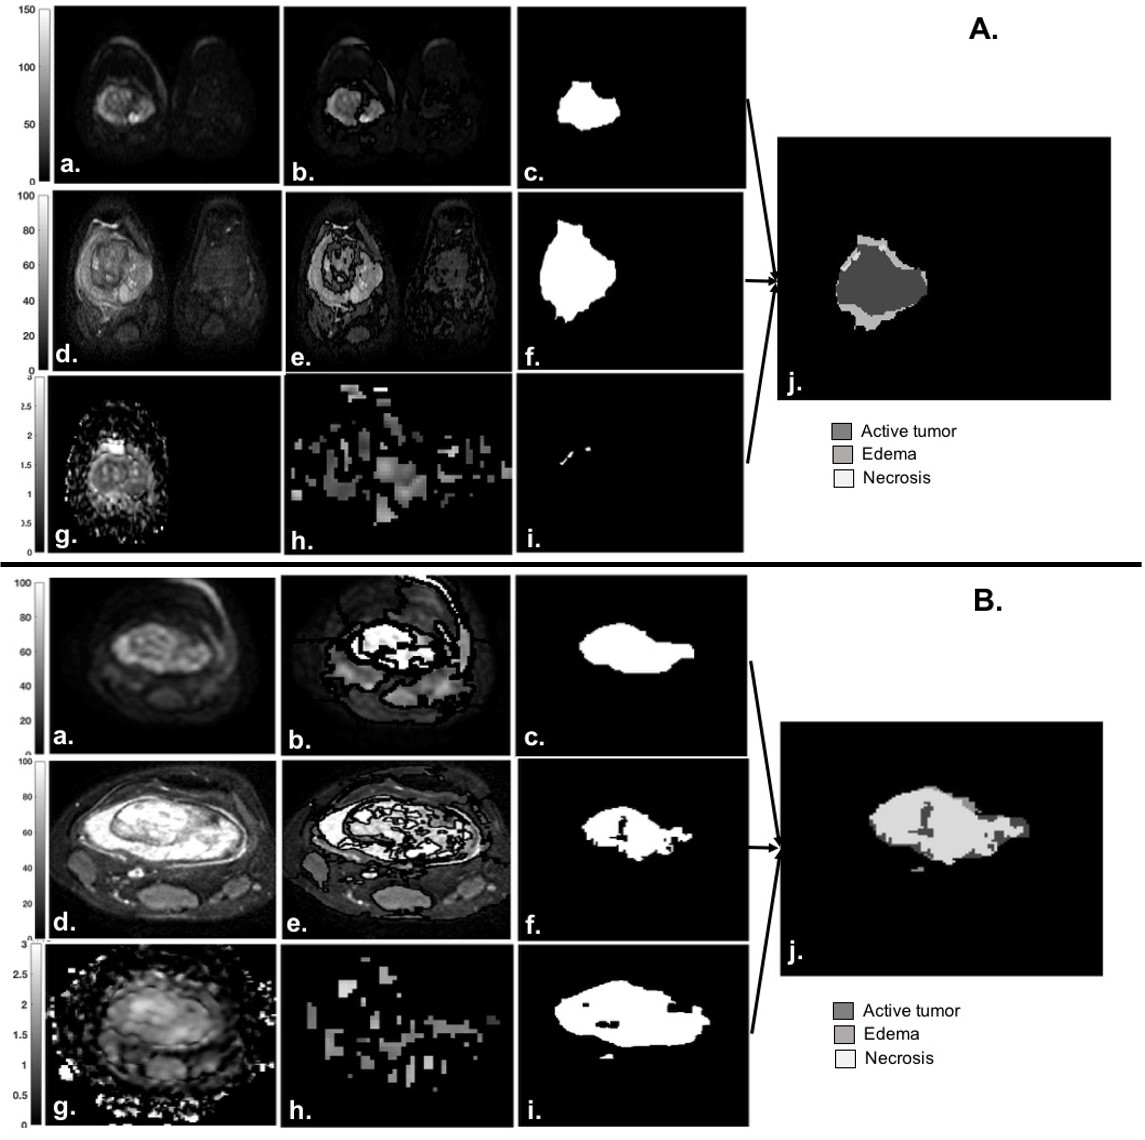
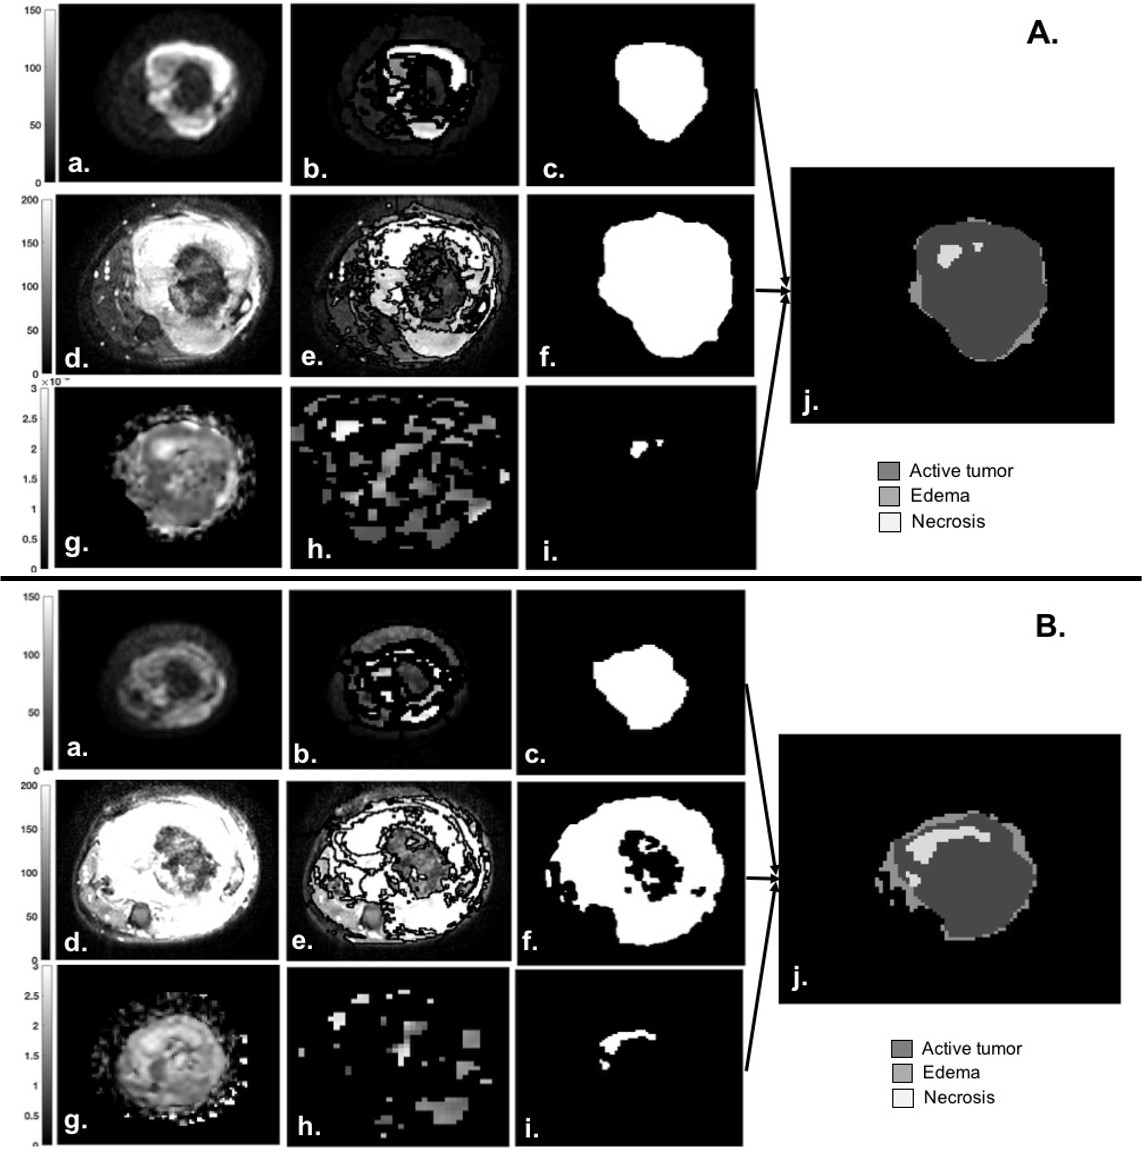
MRI dataset of fourteen patients(n=14;M:F=10:4;Age=16.8±2.5years) with osteosarcoma were acquired on1.5T Philips Achieva MRI-scanner before (baseline) and after 3 cycles NACT (follow-up). After NACT, all patients underwent surgical resection followed by histopathological assessment(HPE). DWI with b=800s/mm2(DWI800) and T2-fatsat images were used to carry out differentiation between tumor and edema. ADC-parameter map was used to capture necrotic region within tumor. Ground truth region of interest(ROI) for tumor tissue (tumor-mask) and necrosis (necrosis-mask) were demarcated on DWI800 slices and corresponding ADC maps respectively for all patients by an expert radiologist. Hyper-intense area was demarked (T2-mask) on T2-fatsat images for possible tumor+edema area and segmentation mask was registered with DWI800. Figure1A&B(a,d&g) and Figure2A&B(a,d&g) shows DWI800, ADC map, T2-fatsat images of two representative patients with osteosarcoma at baseline and follow-up respectively.
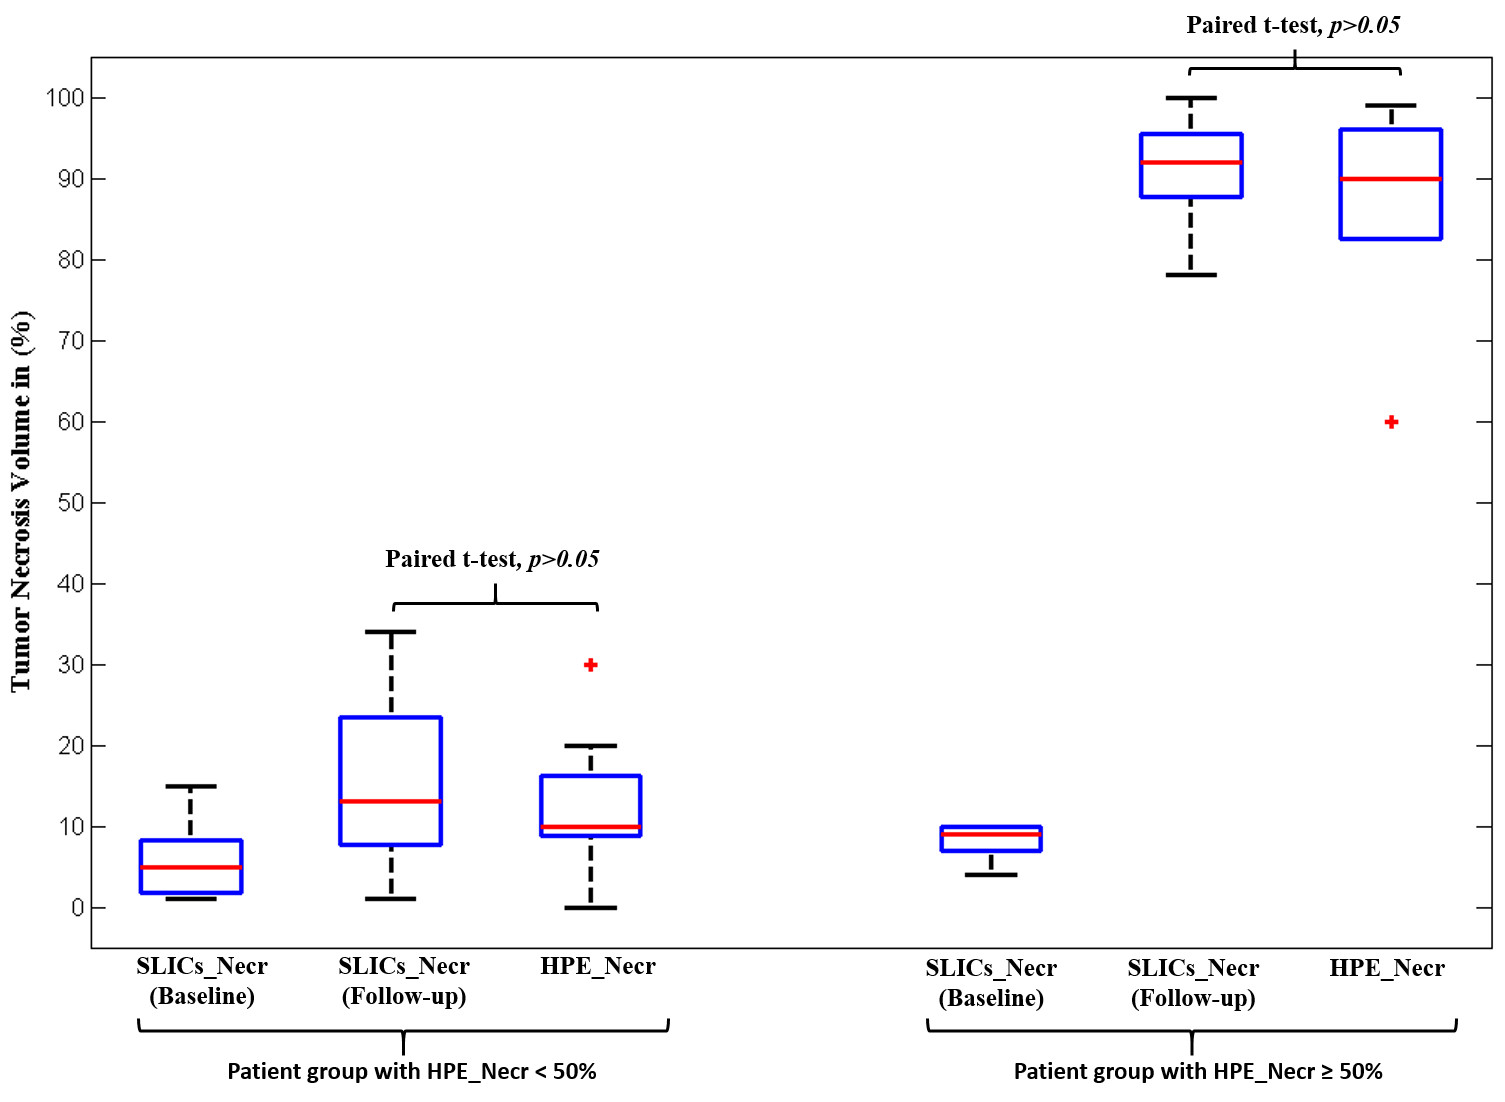
SLIC Supervoxels-based (SLICs) technique has been already optimised by us6 on axial MR images for supervoxels with higher mean intensities (>3rd threshold of total 4 multi-thresholds) to compute masks for active-tumor (DWI-mask) and tumor+edema (T2-mask) respectively6. Twenty supervoxels were generated with compactness=0.025. Edema were calculated as: Edema=T2W-mask – DWI-mask. For necrosis, 150 supervoxels with compactness=0.005 were generated. Histogram analysis of ADC values in tumor volume were performed and a hyper-parameter=mean×entropy of ADC value was calculated. Threshold for this hyper-parameter was determined experimentally as 0.0201 and 0.0236 for baseline and follow-up respectively. Total 9 multi-thresholds were generates for mean values of ADC supervoxels. For patients with hyper-parameter>0.0201 at baseline and hyper-parameter>0.0236 at follow-up, ADC supervoxels with mean>8th threshold were considered as necrosis; while for other group of the patients, ADC supervoxels with mean>6th and 3rd threshold were considered as necrosis at baseline and follow-up respectively. SLICs-based estimated necrosis volume at follow-up were compared with HPE-necrosis using paired t-test with p≤0.05 significance level.
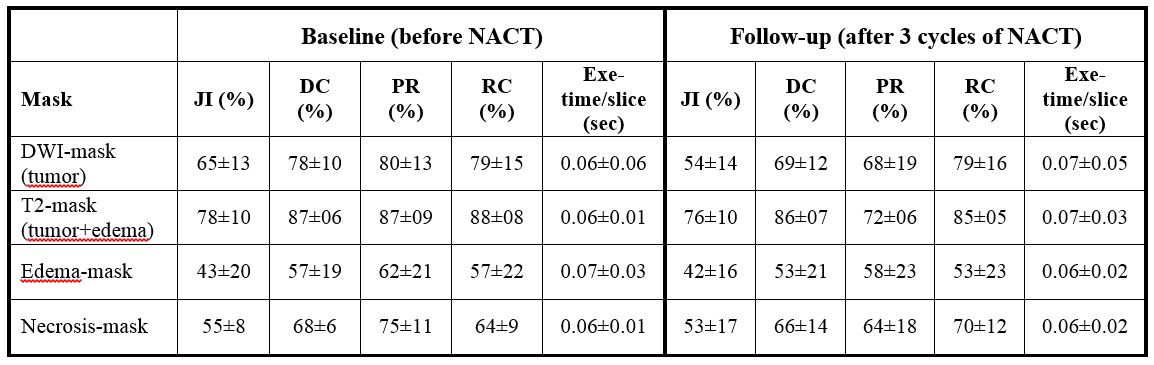
Accuracy metrics: Ground truth ROIs and segmentation results were compared to calculate performance analytical parameters Jacquard Index(JI)=│A∩B│/│AUB│×100, Dice-Coefficient(DC)= 2│A∩B│/(│A│+│B│)×100, Precision(PR)=│A∩B│/│B│×100 and Recall(RC)=│A∩B│/│A│×100. Here A and B are areas demarcated as tumor by radiologist and SLICs algorithm respectively. All the analysis were performed using MATLAB(R2017a).
Results
Table1 represents the accuracy of SLICs-based segmentation for DWI-, T2- and ADC- mask for identification of subparts of tumor at baseline and follow-up for all patients. Active-tumor and tumor+edema were detected with satisfactory accuracy (JI=54-65%;DC=69-78%;PR=68-80%;RC=79%) and (JI:76-78%;DC:86-87%;PR=72-87%;RC=85-88%) respectively at baseline and follow-up. Detection of edema (JI=42-43%;,DC=53-57%;PR=58-62%;RC=53-57%) and necrosis (JI=53-55%;,DC=66-68%;PR=64-75%;RC=64-70%)) were performed with moderated accuracy at baseline and follow-up. Figure1 depicts the SLICs-based estimation of necrosis (%) at baseline and follow-up and HPE-necrosis(%) for all patients. At baseline SLICs-based necrosis in all patients were observed as 5-15%; while after completion of chemotherapy patients<50% HPE-necrosis showed ~10-20% increment in SLICs-based necrosis and patients≥50% HPE-necrosis showed ~80-90% increment in SLICs-based necrosis. There was no significant difference (p=0.26) between estimated SLICs-based necrosis at follow-up and HPE-necrosis among all patients. Figure2&3 represent illustrative example of segmentation results for both time-points- baseline and follow-up from two representative patients with HPE-necrosis of 90% and 5% respectively where SLICs-based necrosis-volume at follow-up were (91% and 8% respectively) comparable with actual HPE-necrosis. Average time to process one slice-image was ~0.25 seconds.Discussion
Osteosarcoma is a highly heterogenous tumor environment, entropy indicating variability was chosen with mean ADC in tumor as a hyper-parameter. This hyper-parameter was used to segregate different response groups after NACT. Higher entropy i.e. higher heterogeneity in tumor were observed among patients who showed poor response to NACT producing lower necrosis in histopathological assessment. Thus higher threshold value for necrosis mask generation was chosen for patients with higher hyper-parameter of ADC values and vise versa. Non-invasive MRI based assessment of tumor necrosis during treatment might be helpful in treatment planning and improving overall treatment outcome.Conclusion
SLIC-supervoxels based methdology using MRI produced satisfactory performance in identification of different parts of tumor like active tissue, edema and necrosis in patients with Osteosarcoma. It is a non-invassive technique that can be useful in response evaluation of cancer imaging.Acknowledgements
Authors would like to thank the Government of India for the funding support required for the study. E.B.K. was supported with the research fellowship funds from Ministry of Human Resource Development, Govt. of India.References
1. Mirabello Let al. Osteosarcoma incidence and survival rates from 1973 to 2004: data from the Surveillance, Epidemiology, and End Results Program. Cancer 2009;115(7):1531–1543.
2. Murphey MD, Robbin MR, McRae GA, Flemming DJ, Temple HT, KransdorfMJ.; “The many faces of osteosarcoma”. RadioGraphics 1997;17(5): 1205–1231.
3. Achanta et al. SLIC Superpixels Compared to State-of-the-Art Superpixel Methods. IEEE Transactions on analysis and machine intelligence, vol. 34, NO. 11, Nov, 2012.
4. Irving et al. Automated Colorectal Tumour Segmentation in DCE-MRI using Supervoxel Neighbourhood Contrast Characteristics. Med Image Comput Comput Assist Interv. 2014;17(Pt 1):609-16.
5. Soltaninejad M. et al. Automated brain tumour detection and segmentation using superpixel-based extremely randomized trees in FLAIR MRI. Int J CARS (2017) 12:183–203. Doi:10.1007/s11548-016-1483-3.
6. Mehndiratta et al. Superpixel-based Segmentation and Automated Identification of Active Tumour and Necrotic regions in Bone Tumor using T1 and Diffusion Weighted Imaging. Proc. 26th ISMRM, 2018. https://www.ismrm.org/18/program_files/TP05.htm
Figures