2341
Comparison of DCE-MRI Parametric Map-Based Features for Early Prediction of Breast Cancer Therapy Response1Oregon Health and Science University, Portland, OR, United States
Synopsis
DCE-MRI data from 55 breast cancer patients collected before and after the first cycle of neoadjuvant chemotherapy were subjected to pharmacokinetic analysis. Four texture features, GLCM, RLM, single- and multi-resolution fractals extracted from DCE-MRI parametric maps, were analyzed for early prediction of therapy response. Generally, the multi-resolution fractal features from individual maps or the concatenated features from all parametric maps showed better predictive performance. The results suggest that multi-resolution analysis, which decomposes the texture at various spatial-frequency scales, may more accurately capture changes in tumor vascular heterogeneity as measured by DCE-MRI, and thus provide better early prediction of therapy response.
Introduction
Tumor vasculature generally exhibits strong spatio-temporal heterogeneity, which reflects tumor progression and disease stage1. A significant change in perfusion/permeability and metabolism usually precedes tumor size reduction in response to neoadjuvant chemotherapy (NACT)2. Image texture features that capture the change of heterogeneity in tumor microvasculature as measured by DCE-MRI have been shown to be capable of providing early prediction of breast cancer response to NACT3, 4. Using voxel-based parametric maps of DCE-MRI pharmacokinetic (PK) parameters, the goal of this study was to compare the performance of multi-resolution fractal analysis (MRFA) with those of single-resolution fractal analysis (SRFA) and the conventional statistical features extracted from grey-level co-occurrence matrix (GLCM) and run-length matrix (RLM) for early prediction of breast cancer pathologic response to NACT.Methods
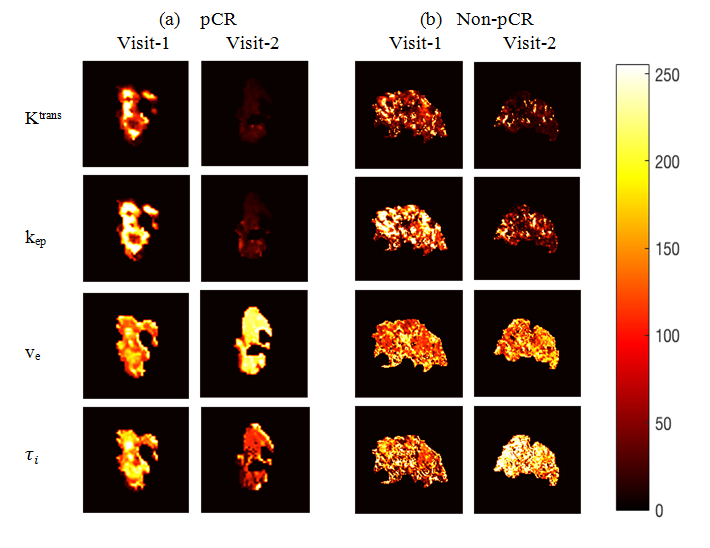
Fifty-five breast cancer patients who were treated with NACT as standard of care underwent 3D DCE-MRI at visit-1 (before NACT) and visit-2 (after the first of 6-8 cycles of NACT). Tumor ROIs were manually drawn on post-contrast DCE-MRI images. The voxel DCE time-course data within the ROI was fitted with the Shutter-Speed PK model5, yielding parametric maps of Ktrans, ve, kep (=Ktrans/ve), and τi (mean intracellular water lifetime) on multiple slices containing the tumor. Pathological analysis of post-NACT surgical specimens classified NACT response as pathologic complete response (pCR) or non-pCR. Figure 1 shows examples of voxel-based parametric maps of the four parameters for a pCR (1a) and a non-pCR (1b) tumor at visit-1 and visit-2.
Texture analysis of each parametric map was performed using GLCM, RLM, SRFA, and MRFA. Twelve Haralick features6 were extracted from the GLCM4 and thirteen features from the RLM7. SRFA estimated fractal dimension (FD) from 3D parametric maps directly based on the power spectrum of 3D Fourier transformation of the parametric maps8. MRFA used wavelet analysis to decompose the parametric maps down to four levels of resolution, using FD to guide the tree-structure decomposition9. The concatenation of the highest and lowest FD at each level formed the feature vector for MRFA.
For each feature of each parameter, percentage change in the feature value at visit-2 relative to visit-1 was calculated, which was then given as input to a Support Vector Machine (SVM)10 to generate a predictive model for classification of pCR vs. non-pCR. The predictive performance was assessed for the features extracted from each of the four parametric maps as well as those constructed by concatenating the texture features from all four parametric maps of Ktrans, kep, ve and τi, designated as “All”. The SVM classification performance was evaluated by calculating the average over ten random partitions of the training and testing data. The ROC AUC values were compared between different features by calculating the critical ratio according to the Hanley and McNeil’s formula11. The statistical significance was set at P < 0.05.
Results
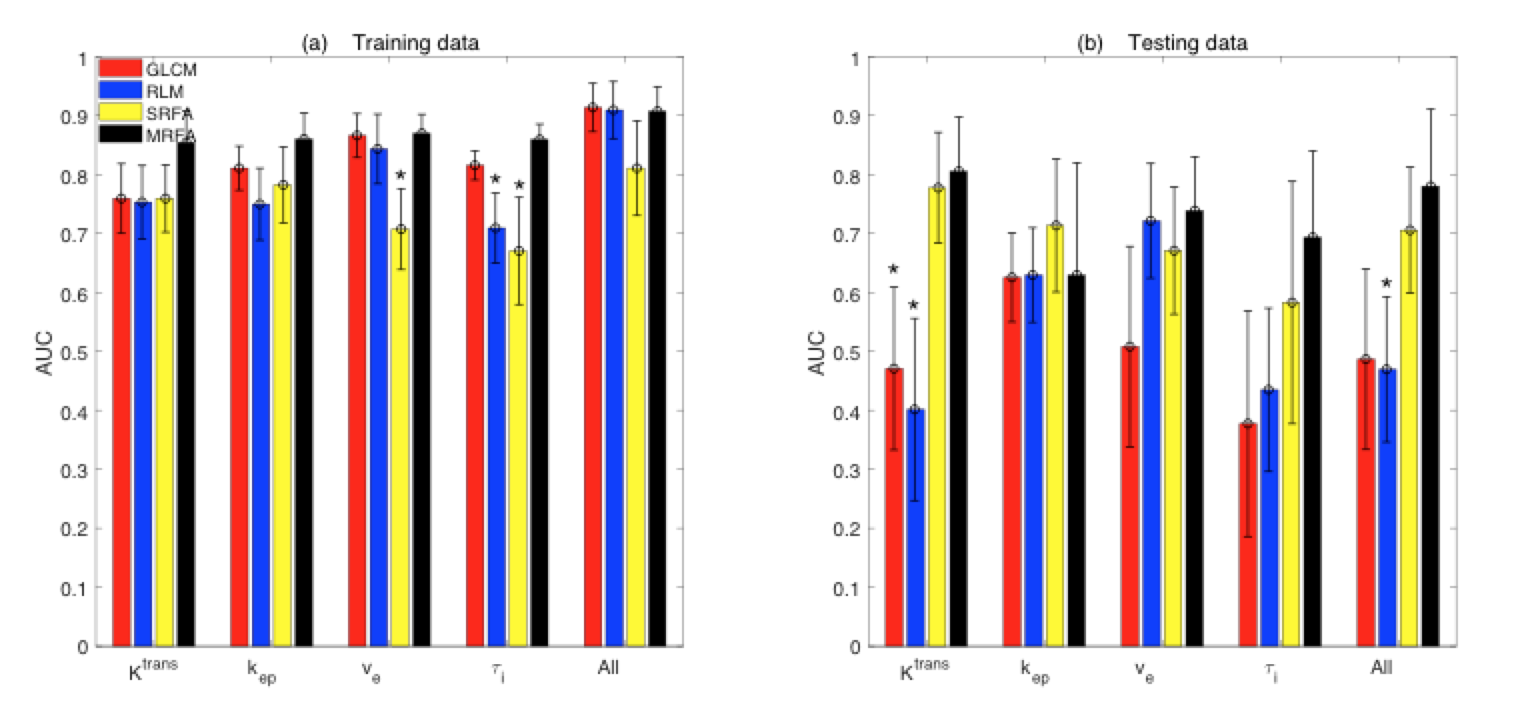
Fourteen patients were pCRs and the other 41 non-pCRs. 9 pCRs/31 non-pCRs and 5 pCRs/10 non-pCRs were selected randomly to form the training and testing sets, respectively. The mean ROC AUC values for classification of pCR vs. non-pCR in the training and testing datasets using the different feature types extracted from individual parametric maps and the concatenated features (“All”) are shown in Figure 2. MRFA features generally demonstrated better predictive performance than GLCM, RLM, and SRFA features in both datasets, with MRFA AUC = 0.85, 0.86, 0.87, 0.86, 0.91 (for Ktrans, kep, ve, τi, and All, respectively), and 0.80, 0.63, 0.74, 0.70, 0.78 for the training and testing datasets, respectively. For early prediction of NACT response, MRFA significantly (P < 0.05) outperformed SRFA on ve maps and SRFA and RLM on τi maps in the training set, and GLCM and RLM on Ktrans maps and RLM from “All” in the testing set.Discussion
Compared to the more conventional GLCM and RLM methods, the generally higher predictive performance by the MRFA method suggests that decomposing the texture of DCE-MRI parametric maps may help capture subtle variations in the texture and give further insights into the heterogeneity of tumor microvasculature. While the statistical GLCM and RLM features reflect the overall correlations between adjacent voxels, MRFA filters out irrelevant features and noise at different resolutions, rendering more emphasis on distinct features, and fractal analysis at each level appears to be able to capture these distinct features. For the small dataset used in this study, the MRFA features seem to capture the heterogeneity more accurately than the statistical features and provide more accurate prediction of NACT response. However, this observation needs to be validated with a larger patient cohort.Acknowledgements
NIH grant support: U01 CA154602References
[1] Egeblad M, Nakasone ES, Werb Z. Tumors as organs: complex tissues that interface with the entire organism. Developmental cell. 2010 Jun 15;18(6):884-901.
[2] Leach MO, Morgan B, Tofts PS, Buckley DL, Huang W, Horsfield MA, Chenevert TL, Collins DJ, Jackson A, Lomas D, Whitcher B. Imaging vascular function for early stage clinical trials using dynamic contrast-enhanced magnetic resonance imaging. European radiology. 2012 Jul 1;22(7):1451-64.
[3] Ashraf A, Gaonkar B, Mies C, DeMichele A, Rosen M, Davatzikos C, et al. Breast DCE-MRI kinetic heterogeneity tumor markers: preliminary associations with neoadjuvant chemotherapy response. Transl Oncol 2015; 8: 154-162.
[4] Thibault G, Tudorica A, Afzal A, et al. DCE-MRI Texture Features for Early Prediction of Breast Cancer Therapy Response. Tomography. 2017;3(1):23-32.
[5] Yankeelov TE, Rooney WD, Li X, and Springer CS. Variation of the relaxographic “Shutter-Speed” for transcytolemmal water exchange affects the CR bolus-tracking curve shape. Magn Reson Med. 2003; 50: 1151-1169.
[6] Haralick RM, Shanmugam K, Dinstein I. Textural features for image classification. IEEE Trans Syst Man Cybern. 1973;3(6):610-621.
[7] Gallowy MM. Texture analysis using gray level run length. Computer Graphics and Image Processing. 1975;4:172-9.
[8] Kontos D, Bakic PR, Carton AK, et al. Parenchymal texture analysis in digital breast tomosynthesis for breast cancer risk estimation: a preliminary study. Academic radiology. 2009; 16(3): 283-98.
[9] Al-Kadi OS, Chung DY, Carlisle RC, et al. Quantification of ultrasonic texture intra-heterogeneity via volumetric stochastic modeling for tissue characterization. Medical image analysis. 2015; 21(1): 59-71.
[10] Cortes C, Vapnik V. Support-vector networks. Machine learning. 1995 Sep 1;20(3):273-97.
[11] Hanley JA, McNeil BJ. A method of comparing the areas under receiver operating characteristic curves derived from the same cases. Radiology. 1983 Sep;148(3):839-43.
Figures