2340
Integration of DCE-MRI Texture Features with Clinical Data for Improved Early Prediction of Breast Cancer Therapy Response1Oregon Health and Science University, Portland, OR, United States
Synopsis
This study investigated the effect of integrating clinical data with DCE-MRI texture features in early prediction of breast cancer therapy response. DCE-MRI data collected from 55 breast cancer patients before and after the first cycle of neoadjuvant chemotherapy were subjected to pharmacokinetic analysis. Texture features were extracted from voxel-based DCE-MRI parametric maps. Predictive performances with imaging features alone and in combination with clinical features were assessed and compared. Addition of clinical features to image texture features increased predictive capability in discriminating pathologic complete response (pCR) vs. non-pCR compared to using imaging features alone.
Introduction
Neoadjuvant chemotherapy (NACT) is increasingly used in patients with locally advanced breast cancer to enable breast-conserving surgeries1. Complete pathological response (pCR) to NACT is a strong prognostic marker for survival2. Image texture analysis that captures the heterogeneity of tumor perfusion/permeability as measured by DCE-MRI has been shown to be capable of providing early prediction of breast cancer response to NACT3, 4. It has also been reported that molecular markers of estrogen receptor (ER), progesterone receptor (PR), and human epidermal growth factor receptor 2 (HER2) are independently associated with pCR rate5. In this preliminary study, we evaluated the potential of integrating DCE-MRI texture features with clinical data (including the molecular markers) for early prediction of breast cancer pathologic response to NACT.Methods
Fifty-five breast cancer patients treated with NACT as standard of care were consented to undergo 3D DCE-MRI at visit-1 (before NACT) and visit-2 (after the first of 6-8 cycles of NACT). Breast tumor ROIs were delineated by experienced radiologists on post-contrast DCE images. Voxel DCE time-course data within the tumor ROIs were fitted with the Shutter-Speed pharmacokinetic (PK) model6, generating parametric maps of four PK parameters: Ktrans, ve, kep (=Ktrans/ve), and τi (mean intracellular water lifetime). NACT response as pCR or non-pCR was determined by pathological analysis of post-NACT resection specimens.
Each of the parametric maps was subjected to texture analysis using grey-level co-occurrence matrix (GLCM) and run-length matrix (RLM). GLCM is a second order statistical method, which estimates the joint probability P(i,j|d,θ) that two voxels with intensity i and j are separated by distance d and direction θ4. Twelve Haralick features7 were derived from the GLCM matrix. RLM P(i,r|θ) is defined as the number of voxels with gray-level i and run-length r for a given direction θ . RLM was computed by adding all possible run lengths in 13 directions of the 3D space, and thirteen statistical features were derived from this matrix8. For each feature vector, the percentage change at visit-2 relative to visit-1was calculated, which was given as input to Support Vector Machine (SVM)9 for prediction of pCR vs. non-pCR. The predictive performance was evaluated as ROC AUC, calculated as the average over ten random partitions of the data in the training and testing sets. The AUC values were obtained for the features extracted from each of the four parametric maps as well as those constructed by concatenating the features from all four parametric maps of Ktrans, kep, ve and τi, designated as “All.” To analyze the predictive performance of integrated DCE-MRI texture features and clinical features, the two feature vectors were concatenated and submitted to SVM. The clinical features consisted of age, tumor type, tumor grade, ER, PR, HER2 status, and TNM (tumor, node, and metastasis) stage. The 12-dimensional GLCM features and 13-dimensional RLM features were each concatenated with the 9-dimensional clinical features to form new feature vectors of 21 and 22 dimensions, respectively.
Critical ratio calculated using the Hanley and McNeil’s formula10 was used to compare the AUC values, with statistical significance set at P < 0.05.
Results
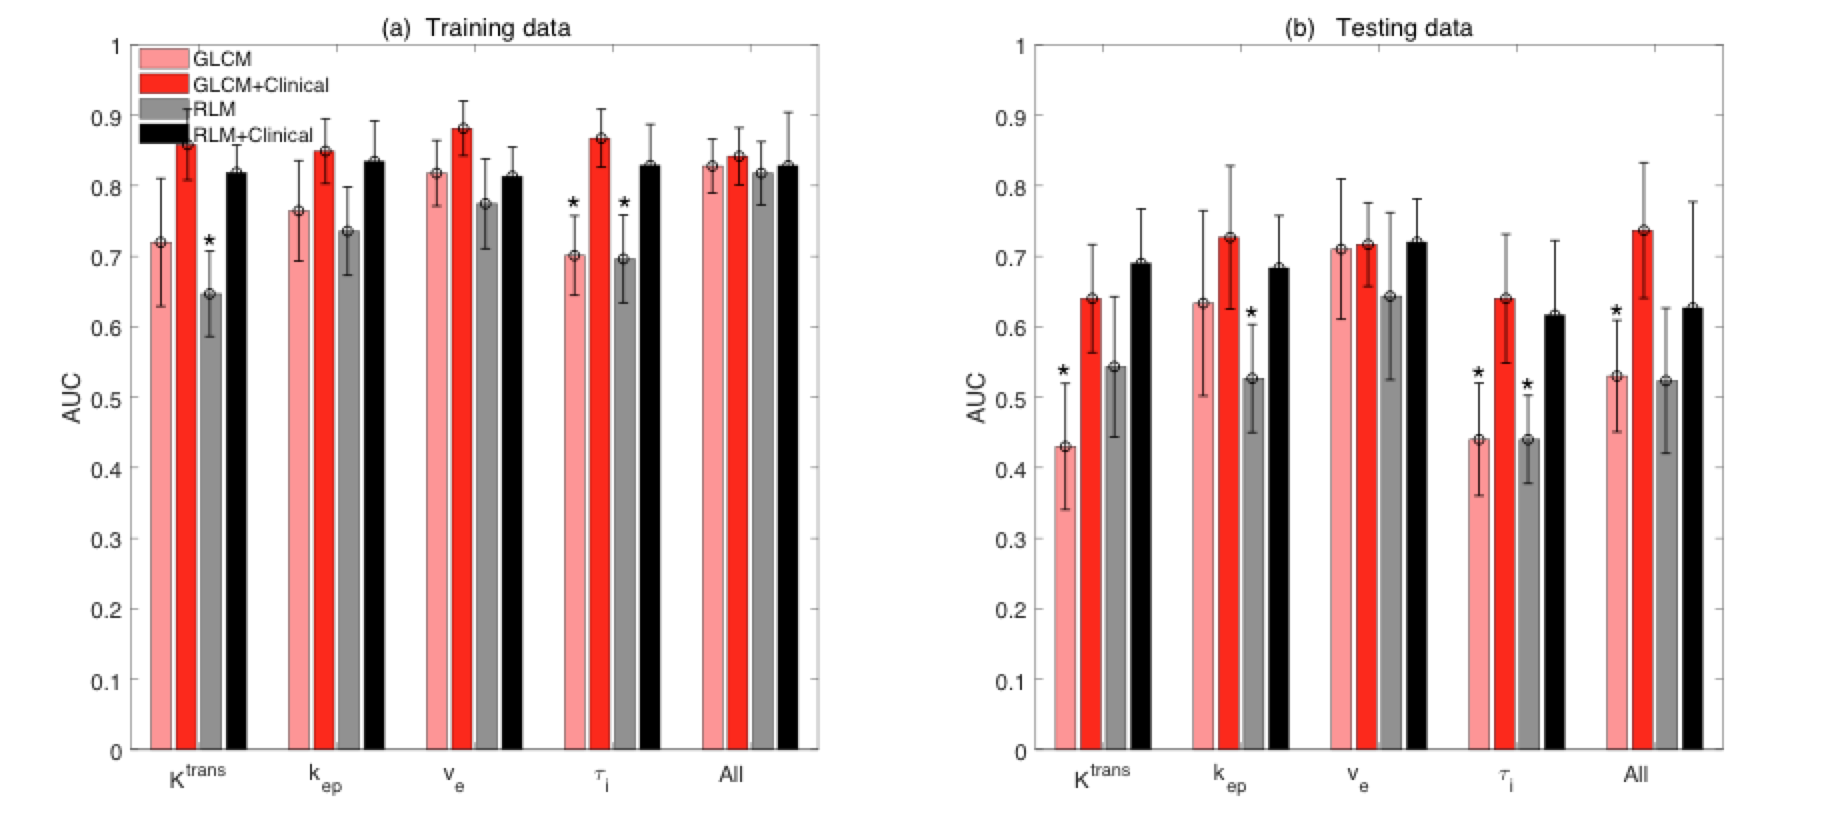
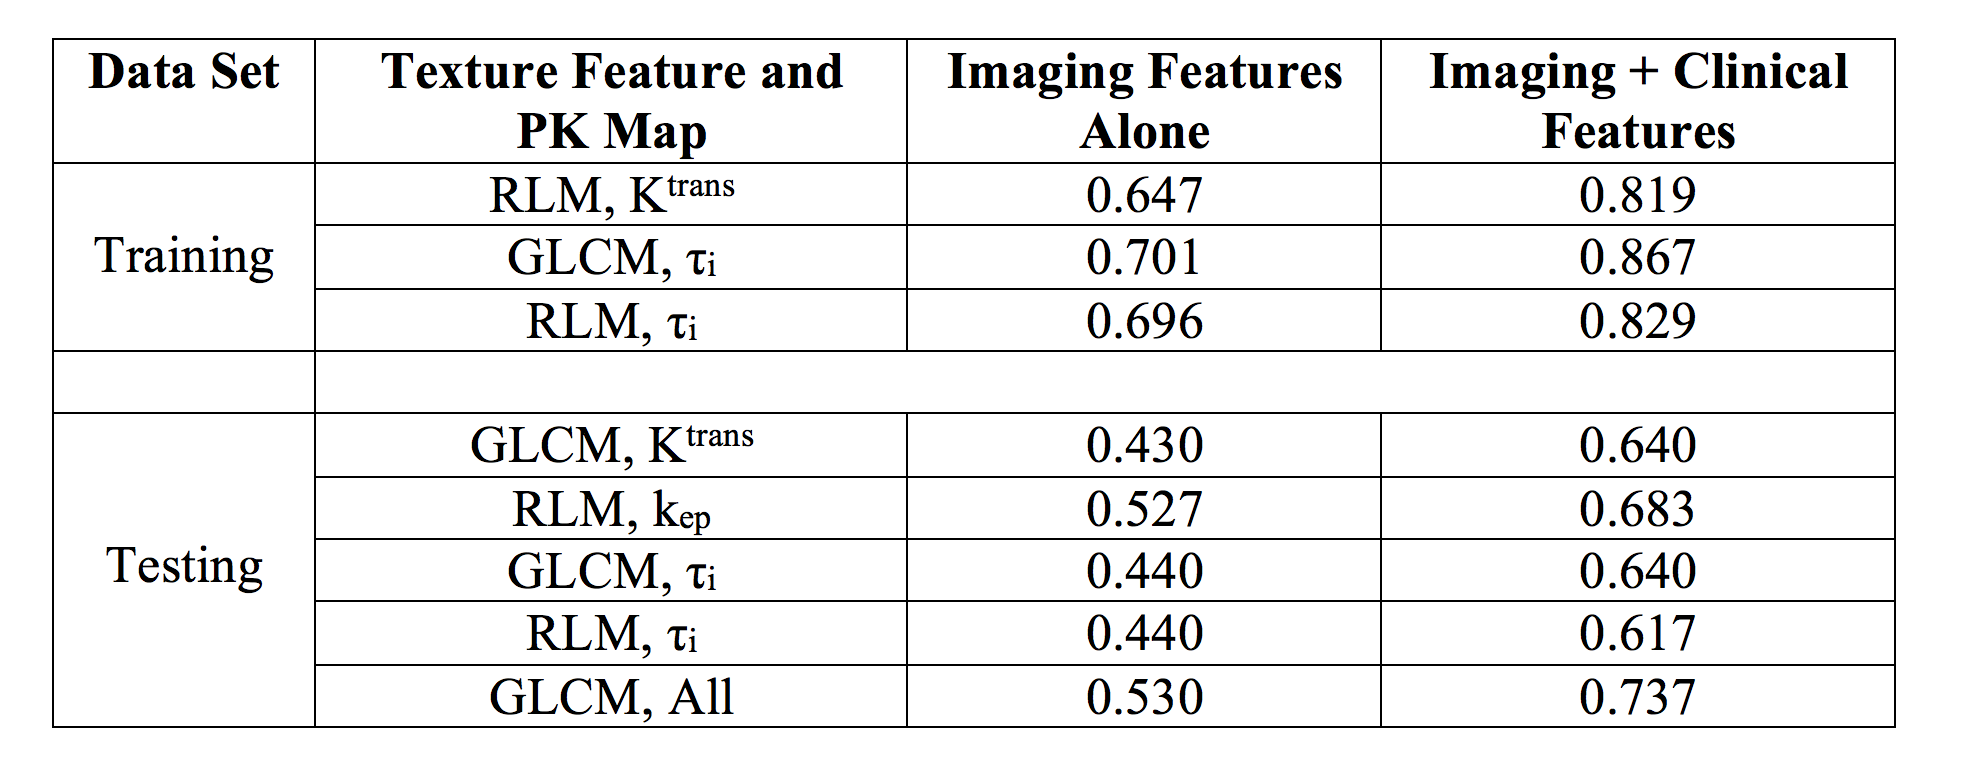
According to pathology analysis, fourteen patients were pCRs whereas the other 41 were non-pCRs. The number of train-test data split was 9-5 for pCR and 31-10 for non-pCR, respectively. The mean ROC AUC values for classifying pCR vs. non-pCR using GLCM and RLM image features alone and in combination with the clinical data are shown in Figure 1. Addition of clinical features to image features improved predictive performances in both the training and testing datasets. Table 1 shows the AUC values for the pairs of texture feature and PK parameter for which the integration with clinical features increased the AUC values significantly (P < 0.05).Discussion
Consistent with previous studies3,4, this preliminary study shows that changes in breast tumor DCE-MRI texture features in the early stage of NACT can provide good early prediction of pCR. Furthermore, our results suggest that integration of DCE-MRI texture features with clinical data provide even better prediction of NACT response, with the improvement in predictive performance statistically significant for several imaging features. In the emerging era of precision medicine, the “big data” approach of integrating imaging, proteomic, and genomic data is the way forward in management of cancer patients. In addition to validating our encouraging preliminary results with a larger patient cohort, other relevant data such as genetic test score and NACT regimen will be included in the predictive model for NACT response in future investigations.Acknowledgements
NIH grant support: U01 CA154602References
[1] Chatterjee A, Erban JK. Neoadjuvant therapy for treatment of breast cancer: the way forward, or simply a convenient option for patients?. Gland surgery. 2017 Feb;6(1):119.
[2] Rastogi P, Anderson SJ, Bear HD, et al. Preoperative chemotherapy: updates of National Surgical Adjuvant Breast and Bowel Project Protocols B-18 and B-27. Journal of Clinical Oncology: Official Journal of the American Society of Clinical Oncology. 2008;26(5):778–785.
[3] Ashraf A, Gaonkar B, Mies C, DeMichele A, Rosen M, Davatzikos C, et al. Breast DCE-MRI kinetic heterogeneity tumor markers: preliminary associations with neoadjuvant chemotherapy response. Transl Oncol 2015; 8: 154-162.
[4] Thibault G, Tudorica A, Afzal A, et al. DCE-MRI Texture Features for Early Prediction of Breast Cancer Therapy Response. Tomography. 2017;3(1):23-32.
[5] Houssami N, Macaskill P, von Minckwitz G, Marinovich ML, Mamounas E. Meta-analysis of the association of breast cancer subtype and pathologic complete response to neoadjuvant chemotherapy. Eur J Cancer 2012;48:3342-3354.
[6] Yankeelov TE, Rooney WD, Li X, and Springer CS. Variation of the relaxographic “Shutter-Speed” for transcytolemmal water exchange affects the CR bolus-tracking curve shape. Magn Reson Med. 2003; 50: 1151-1169.
[7] Haralick RM, Shanmugam K, Dinstein I. Textural features for image classification. IEEE Trans Syst Man Cybern. 1973;3(6):610-621.
[8] Gallowy MM. Texture analysis using gray level run length. Computer Graphics and Image Processing. 1975;4:172-9.
[9] Cortes C, Vapnik V. Support-vector networks. Machine learning. 1995 Sep 1;20(3):273-97.
[10] Hanley JA, McNeil BJ. A method of comparing the areas under receiver operating characteristic curves derived from the same cases. Radiology. 1983 Sep;148(3):839-43.
Figures