2339
Quantifying Information Content of Multiparametric MRI Data for Automatic Tumor Segmentation using CNNs1Dept.of Radiology, Medical Physics, Medical Center University of Freiburg, Faculty of Medicine, University of Freiburg, Freiburg, Germany, 2German Cancer Consortium (DKTK), Partner Site Freiburg, Freiburg, Germany, 3Department of Radiation Oncology, Medical Center University of Freiburg, Faculty of Medicine, University of Freiburg, Freiburg, Germany
Synopsis
Multimodality imaging with CT, PET, and MRI is the basis for precise tumor segmentation in radiation therapy. We analyze which MR imaging contrasts mainly improve the segmentation performance of a CNN by training multiple networks using different input channels. The predictive value of 7 different contrasts is compared for two tumor regions, gross tumor volume and lymph node metastasis, in head and neck tumor patients.
Introduction
Multimodality imaging with CT, PET, and MRI is the basis for precise tumor segmentation in radiation therapy (RT). With an increasing amount of multi-modal image information, automatic segmentation of the tumor has become feasible. Convolutional Neural Networks (CNNs) are among the highest scoring algorithms for this task1–5. The predictive performance of a CNN improves with the amount of input data with distinctly different information, e.g. the different MR contrasts in multiparametric MRI. Thus, in this study it is analyzed which imaging contrasts mainly improve the segmentation performance of a CNN. Therefore, in a head and neck tumor study CNNs are individually trained with different input channels (MR contrasts), and the results are compared.Materials and Methods
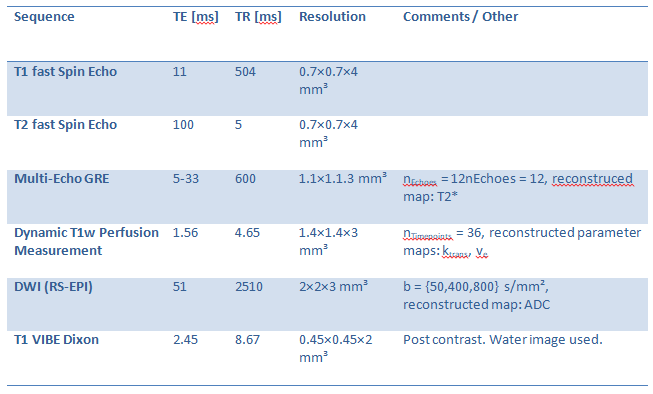
To quantify the contribution of different MR contrasts on the segmentation performance, CNNs were trained with data from a RT study in head and neck tumor patients. In total, 7 different input channels were used: pre-contrast T1w and T2w fast Spin Echo, a T2* map from multi-echo GRE, perfusion maps ktrans and ve from a dynamic contrast-enhanced acquisition, an ADC map acquired from diffusion-weighted EPI data and T1w VIBE post-contrast water image (Dixon); the relevant sequence parameters are listed in Table 1. In the study, 8 CNNs were trained: one with all channels, and 7 in which one of the available input channels was not used.
A total of 25 patients were imaged at a 3 T MRI system (Tim Trio, Siemens Healthineers, Erlangen, Germany) before (week 0) and 2 and 5 weeks into RT. Each of the 3 examinations was treated as an independent dataset. After excluding corrupted or inclomplete data, 36 sets with all 7 input channels were available. These were randomly split into 28 training-, 7 validation- and 1 testing-set.
As ground truth, gross tumor volumes and lymph node metastasis (GTV-T, GTV-LN) were contoured by a radiation oncologist and a radiologist. For CNN training, weighted contrasts (T1w, T2w, T1-VIBE-Dixon) were normalized to zero mean and unit standard deviation. The physical parameters ADC, T2*, ktrans and ve were rescaled based on a histogram approach with equal rescaling values for each parameter map.
A 10 layers deep CNN with a receptive field of 9.5×9.5×6 mm³ at a resolution of 0.45×0.45×2 mm³ was trained5. Layers 3,4,6,7 and 9 included residual connections6 to their previous layers. A second subsampled pathway with the same architecture and a subsampling factor of 5×5×1 was added to the network. Both pathways were merged and processed by two FC-layers. With every CNN the complete data were segmented and resulting probability maps were passed to the subsequent CRF for further refinement5.
Results
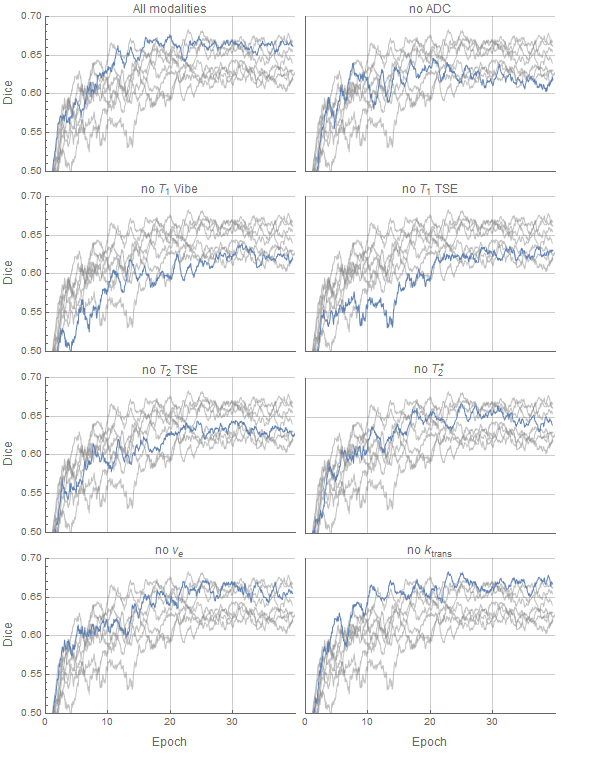
In figure 1 the change of the Dice coefficient during training is plotted. As can be seen, the improvement of segmentation performance is dependent on the provided input channels. The Dice coefficient of whole foreground (GTV-T and GTV-LN) vs background is lower when ADC and T1 VIBE are left out, whereas ktrans and ve have only a small effect on the segmentation quality.
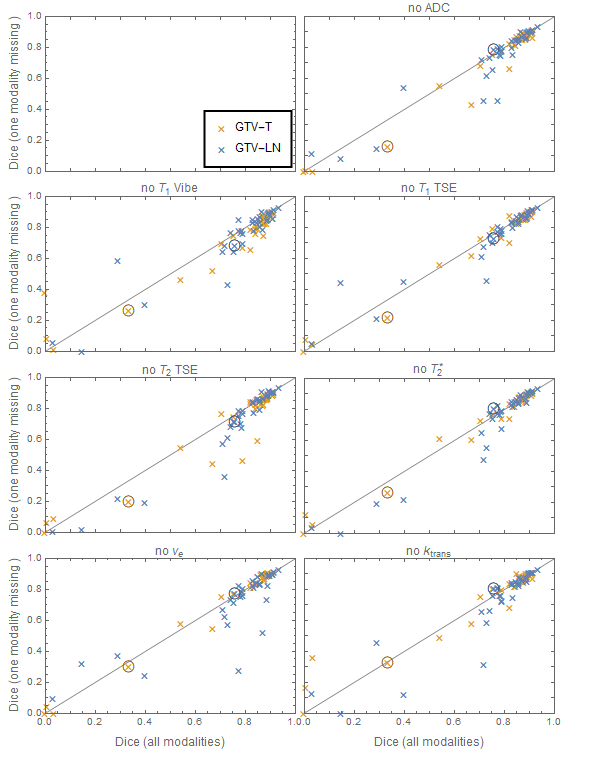
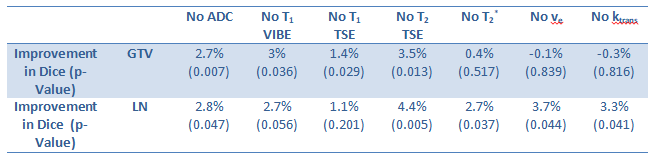
Final segmentation results for all cases are shown in figure 2 and the mean increase of the Dice coefficient is listed in table 2 together with significance/p-values from a paired t-test.
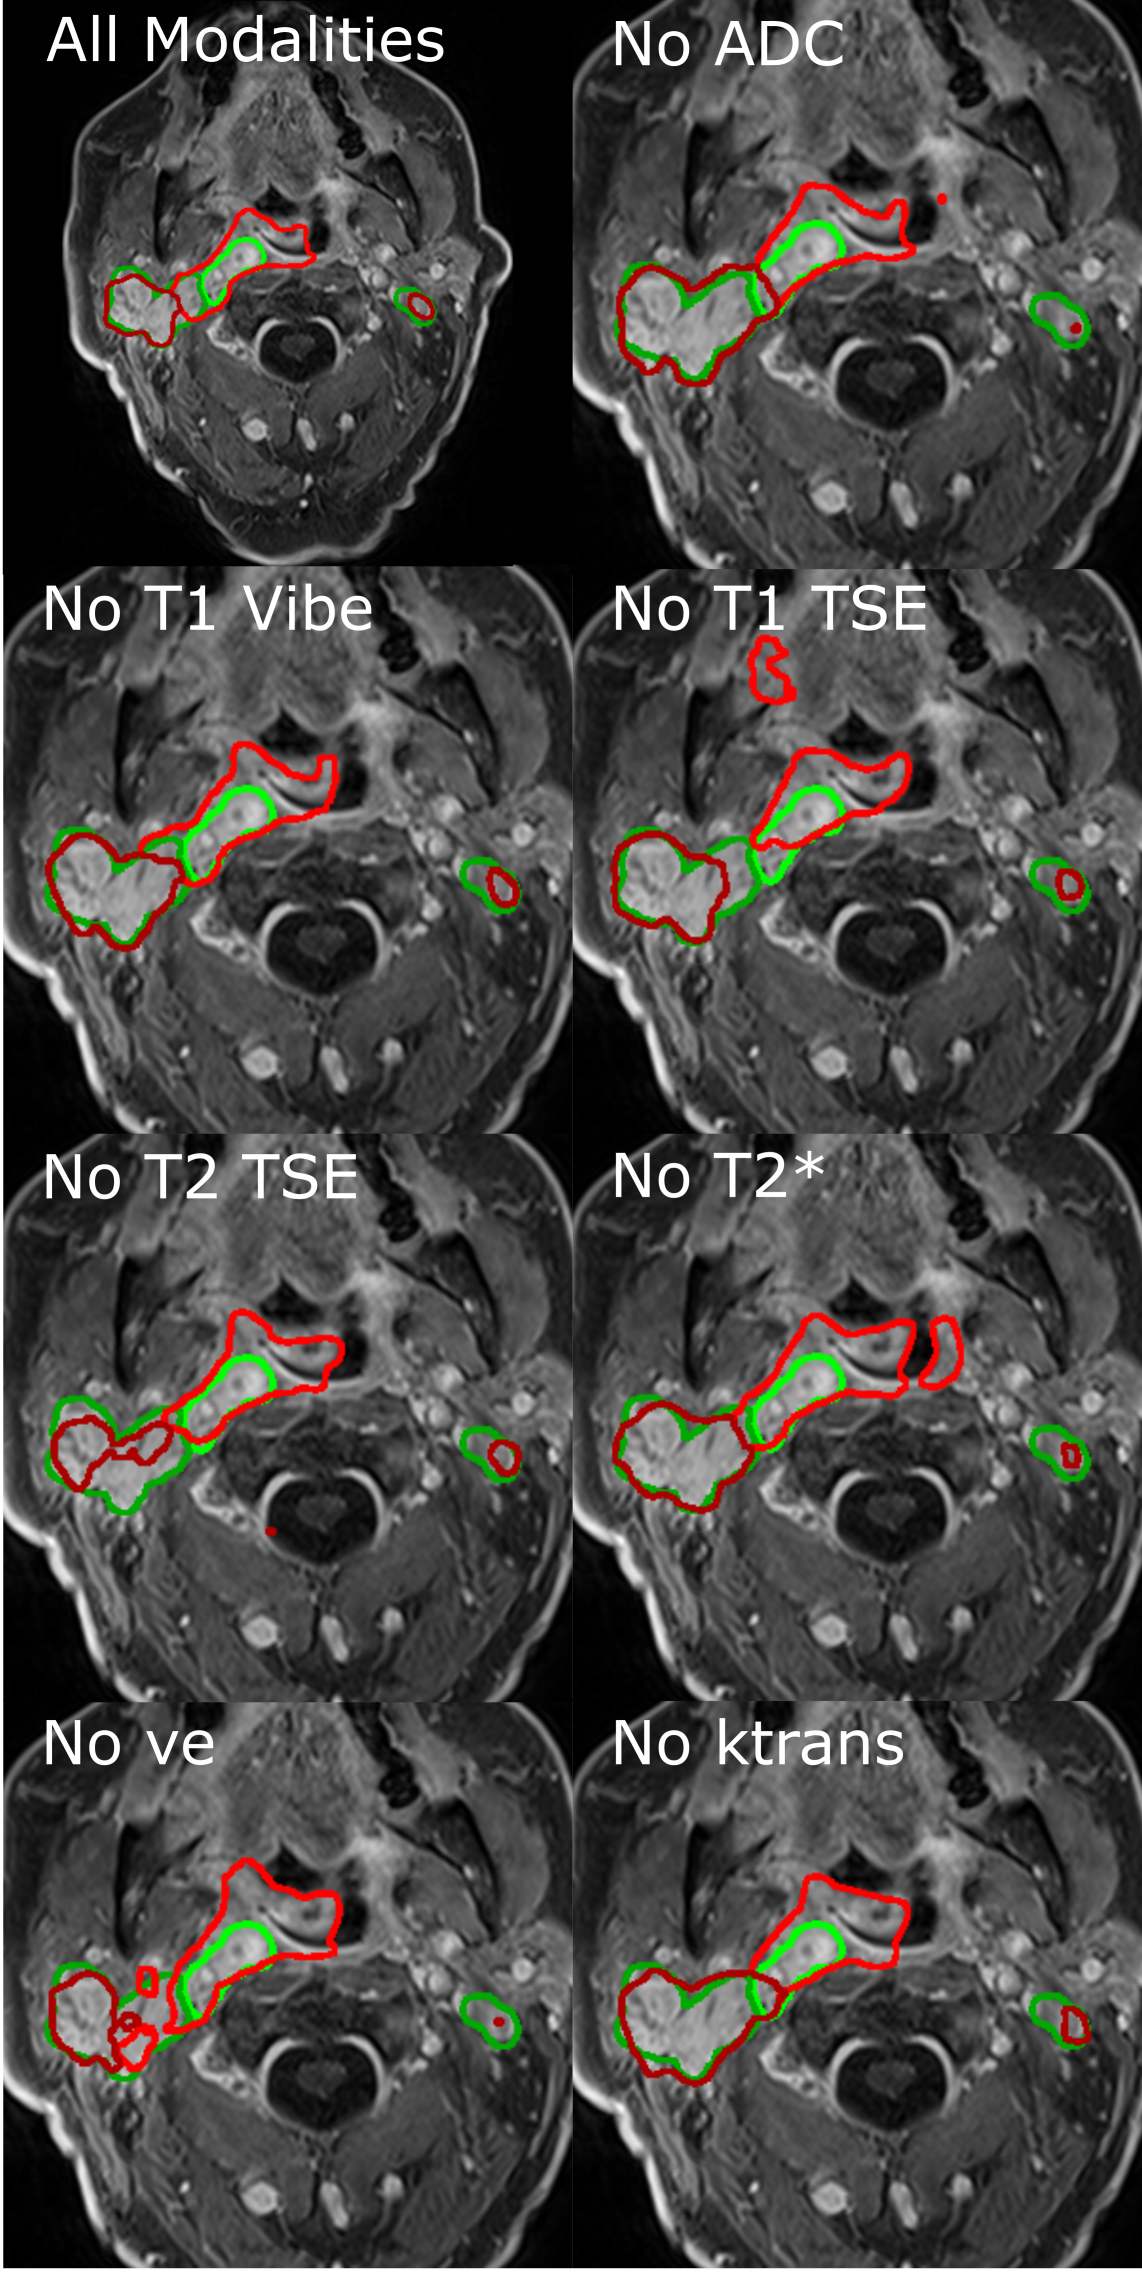
Figure 3 shows the final segmentation for the test case, which was not used during training. In general the CNNs oversegment the GTV-T while GTV-LN is undersegmented.
Discussion and Conclusion
In this study the influence of the different input channels on the segmentation performance was analyzed. From the calculated Dice coefficients one can see that ADC-maps and T2w images provide a major contribution to GTV-T and GTV-LN segmentation, whereas perfusion parameters (ktrans, ve) and T2* only show significant improvement (p<0.05) for GTV-LN segmentation while post-contrast T1 VIBE and pre-contrast T1 TSE significantly improve the GTV-T segmentation (table 2).
The T1 VIBE data may be subject to an inherent bias, as it was often used for contouring the target volumes. Therefore the GTV labels should be least error-prone in the T1 VIBE channel and consequently add most edge information. Some data is also influenced by patient motion of the highly flexible head-neck region: swallowing and gross patient motion occur over the 30min-long acquisition, which require non-rigid co-registration methods thus limiting the accuracy of the GTVs.
Higher CNN performance is expected with a growing patient database – currently, only 36 data sets are available for training. So far, due to long training times, no leave-one-out cross validation could be performed yet. Nevertheless, using CNNs with different input channels can provide valuable information about the necessary acquisition methods, which helps to shorten the acquisition protocols without compromising segmentation quality.
Acknowledgements
This work was supported in parts by a grant from the Deutsche Forschungsgemeinschaft (DFG) under grant number HA 7006/1-1.References
1. Pereira S, Pinto A, Alves V, Silva CA. Brain Tumor Segmentation Using Convolutional Neural Networks in MRI Images. IEEE Trans. Med. Imaging 2016;35:1240–1251 doi: 10.1109/TMI.2016.2538465.
2. Menze BH, Jakab A, Bauer S, et al. The Multimodal Brain Tumor Image Segmentation Benchmark (BRATS). IEEE Trans. Med. Imaging 2015;34:1993–2024 doi: 10.1109/TMI.2014.2377694.
3. Havaei M, Davy A, Warde-Farley D, et al. Brain tumor segmentation with Deep Neural Networks. Med. Image Anal. 2017;35:18–31 doi: 10.1016/j.media.2016.05.004.
4. Akkus Z, Galimzianova A, Hoogi A, Rubin DL, Erickson BJ. Deep Learning for Brain MRI Segmentation: State of the Art and Future Directions. J. Digit. Imaging 2017;30:449–459 doi: 10.1007/s10278-017-9983-4.
5. Kamnitsas K, Ledig C, Newcombe VFJ, et al. Efficient multi-scale 3D CNN with fully connected CRF for accurate brain lesion segmentation. Med. Image Anal. 2017;36:61–78 doi: 10.1016/j.media.2016.10.004.
6. He K, Zhang X, Ren S, Sun J. Deep Residual Learning for Image Recognition. ArXiv151203385 Cs 2015.
Figures