2337
Response monitoring by DCE-MRI in an experimental prostate tumor after single dose 12C-ion and photon radiotherapy1Department of Medical Physics in Radiology, German Cancer Research Center (DKFZ), Heidelberg, Germany, 2Faculty of Biosciences, University of Heidelberg, Heidelberg, Germany, 3Institute of Radiology, University Hospital Erlangen, Friedrich-Alexander-Universität Erlangen, Erlangen, Germany, 4Department of Medical Physics in Radiation Oncology, German Cancer Research Center (DKFZ), Heidelberg, Germany, 5Heidelberg Institute for Radiation Oncology (HIRO) and National Center for Radiation Research in Oncology (NCRO), Heidelberg, Germany, 6Translational Radiation Oncology, National Center for Tumor Diseases (NCT), German Cancer Research Center (DKFZ), Heidelberg, Germany, 7Department of Radiation Oncology and Radiotherapy, University Hospital Heidelberg, Heidelberg, Germany, 8Clinical Cooperation Unit Radiation Therapy, German Cancer Research Center (DKFZ), Heidelberg, Germany, 9Department of Medical Image Computing, German Cancer Research Center (DKFZ), Heidelberg, Germany
Synopsis
A series of DCE-MRI measurements was used to quantify the vascular changes after therapeutic and subtherapeutic doses of photon and 12C-ion irradiation of the anaplastic rat prostate tumor Dunning R3327-AT1. DCE-MRI data were analyzed by pharmacokinetic modelling employing the Extended Tofts model. Independent of dose, 12C-ions led to stronger and earlier treatment response than photons within the observation period indicated by increased Ktrans and ve parameters. Results were correlated to histological analyses for microvascular density, vessel maturity, tumor hypoxia, and proliferation that further underlined the faster, stronger, and more homogeneous treatment response after 12C-ion irradiation.
Objectives
Carbon (12C)-ion radiotherapy (RT) provides enhanced biological effectiveness compared to photon RT, and holds great potential especially for the treatment of radioresistant tumors 1,2. DCE-MRI and pharmacokinetic modelling is employed to quantify the vascular changes after 12C-ion and photon irradiation at therapeutic and subtherapeutic doses of the anaplastic experimental prostate tumor R3327-AT1.Methods
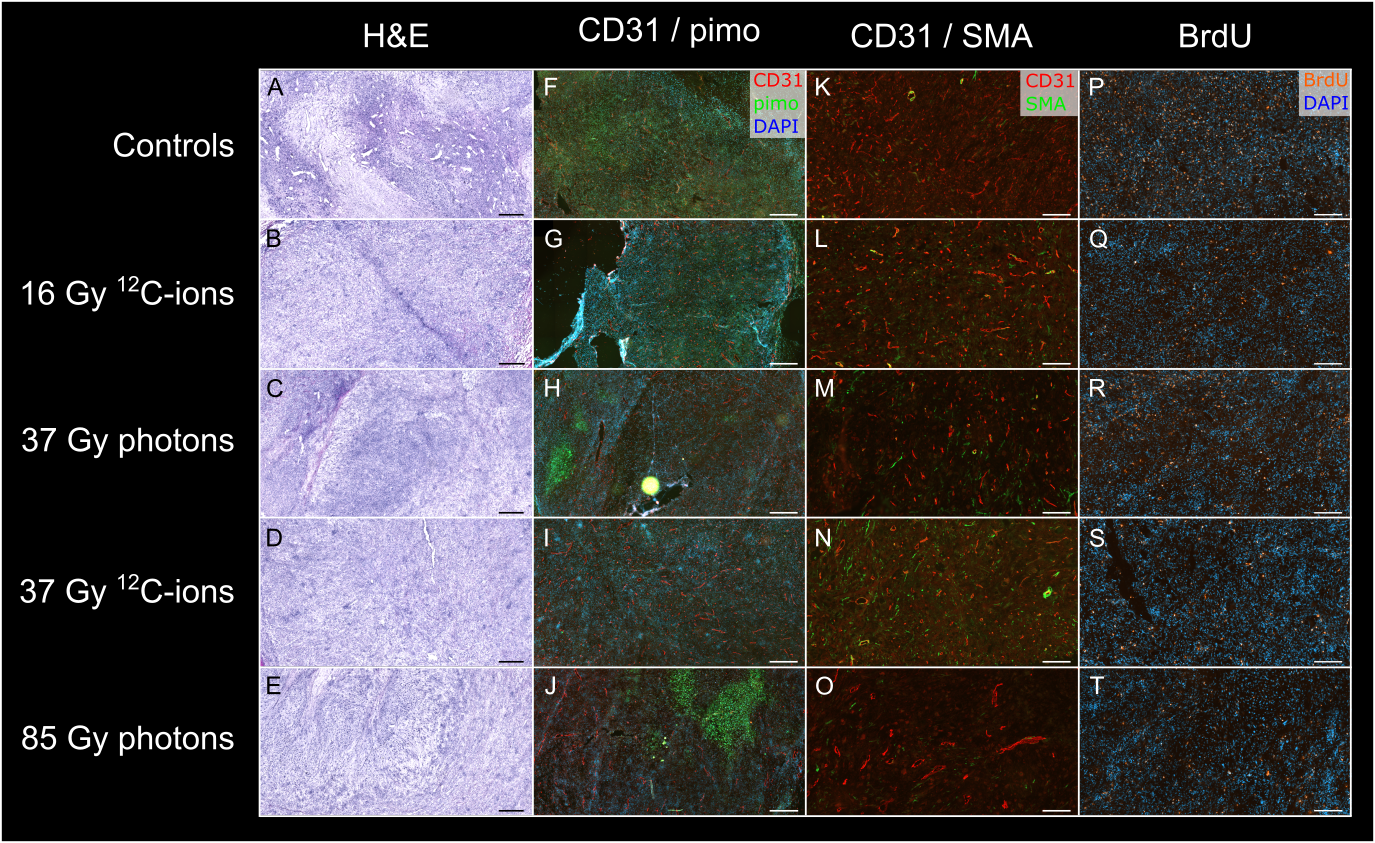
The anaplastic prostate tumor subline Dunning R3327-AT1 3 was transplanted subcutaneously on both thighs of 12 male Copenhagen rats. When tumors attained diameters of approx. 10 mm, the animals’ right tumors were irradiated with single doses of either photons (6 MeV) or 12C-ions (20 mm spread-out Bragg-peak, dose-averaged LET 75 keV/µm). Left tumors served as untreated controls. Tumors were irradiated in four groups: tumors received single doses of either 37 Gy 12C-ions or 85 Gy photons (isoeffective doses) leading to local tumor control or iso-absorbed doses of 37 Gy photons and the corresponding isoeffective dose 16 Gy 12C-ions (both subtherapeutic doses) 2. DCE-MRI (TURBO-FLASH sequence, temporal resolution: 0.75 s, 380 s total acquisition time) was performed one day before and 3, 7, 14, and 21 days, respectively, after irradiation. Image signals were converted to CA concentrations by means of absolute signal enhancement. DCE-MRI data was delay corrected 4 and analyzed voxel-wise using an in-house developed software 5 by pharmacokinetic modelling using the Extended Tofts model (ETM) 6. Image based arterial input functions were extracted per animal from the left ventricle. After the last imaging time point, tumors were dissected and histologically analyzed to assess information on the tumor morphology (H&E), vasculature (CD31/smooth muscle actin (SMA)), hypoxia (pimonidazole), and proliferation (bromodeoxyuridine (BrdU)).Results
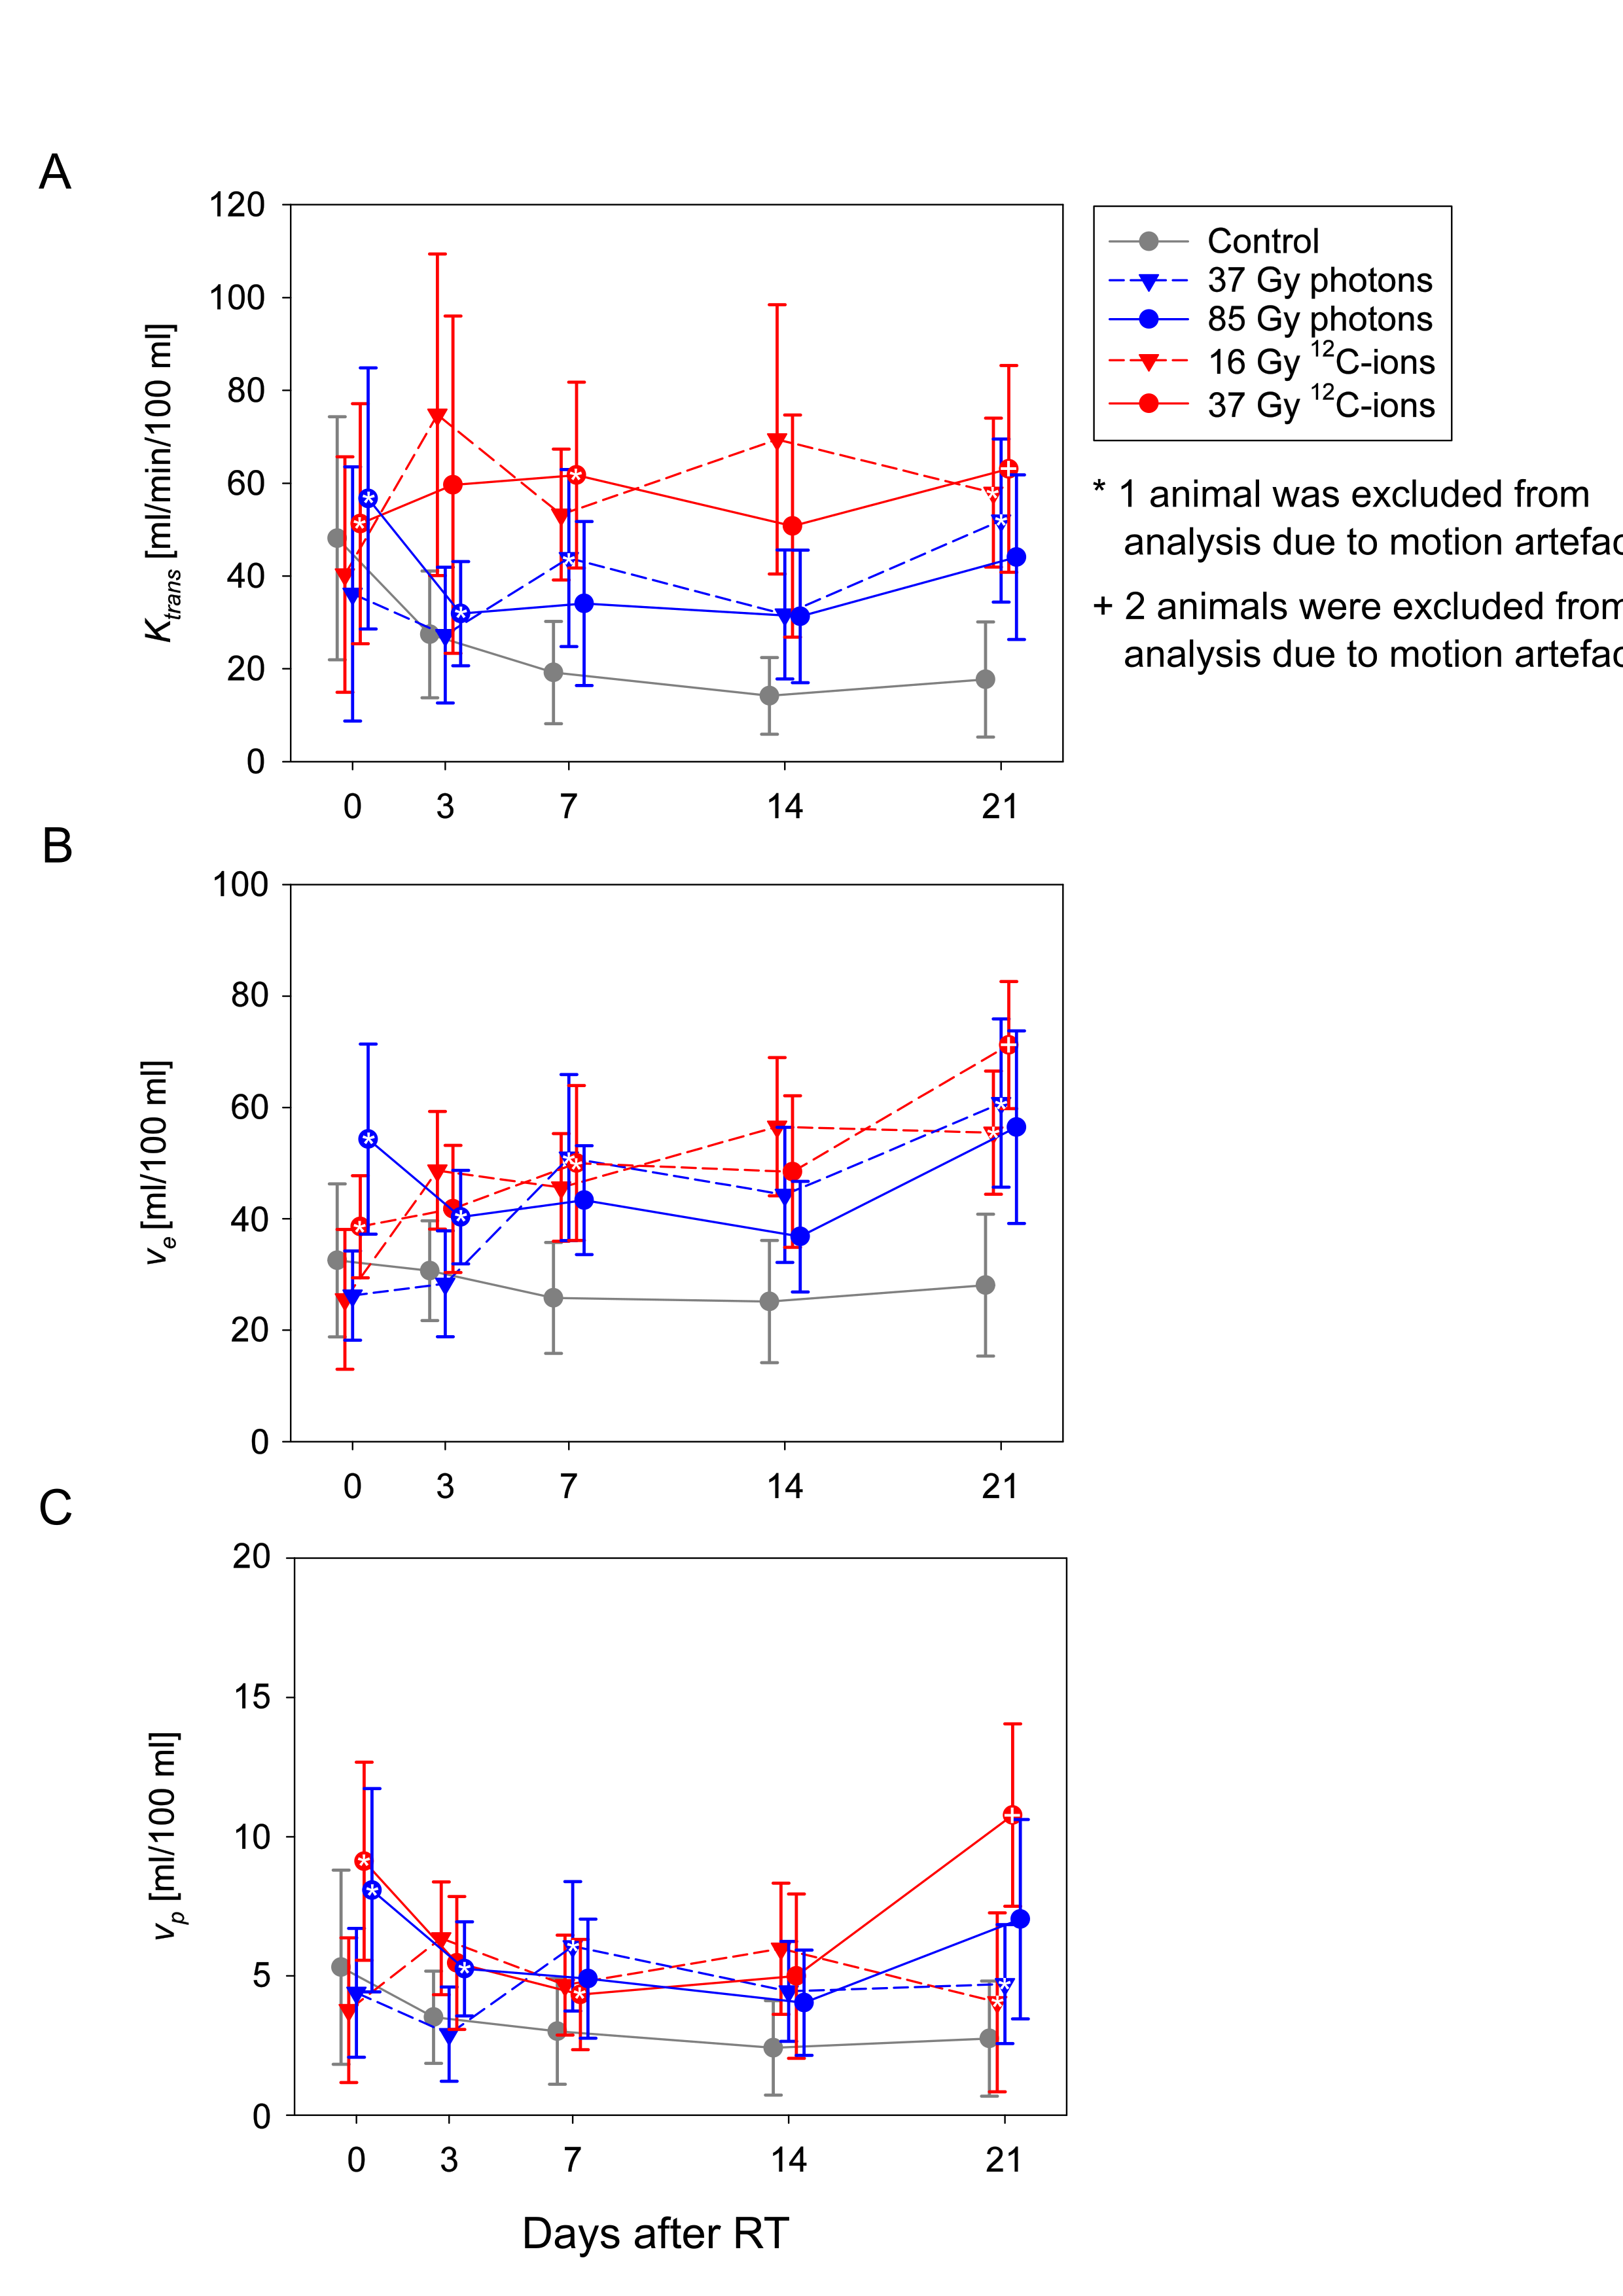
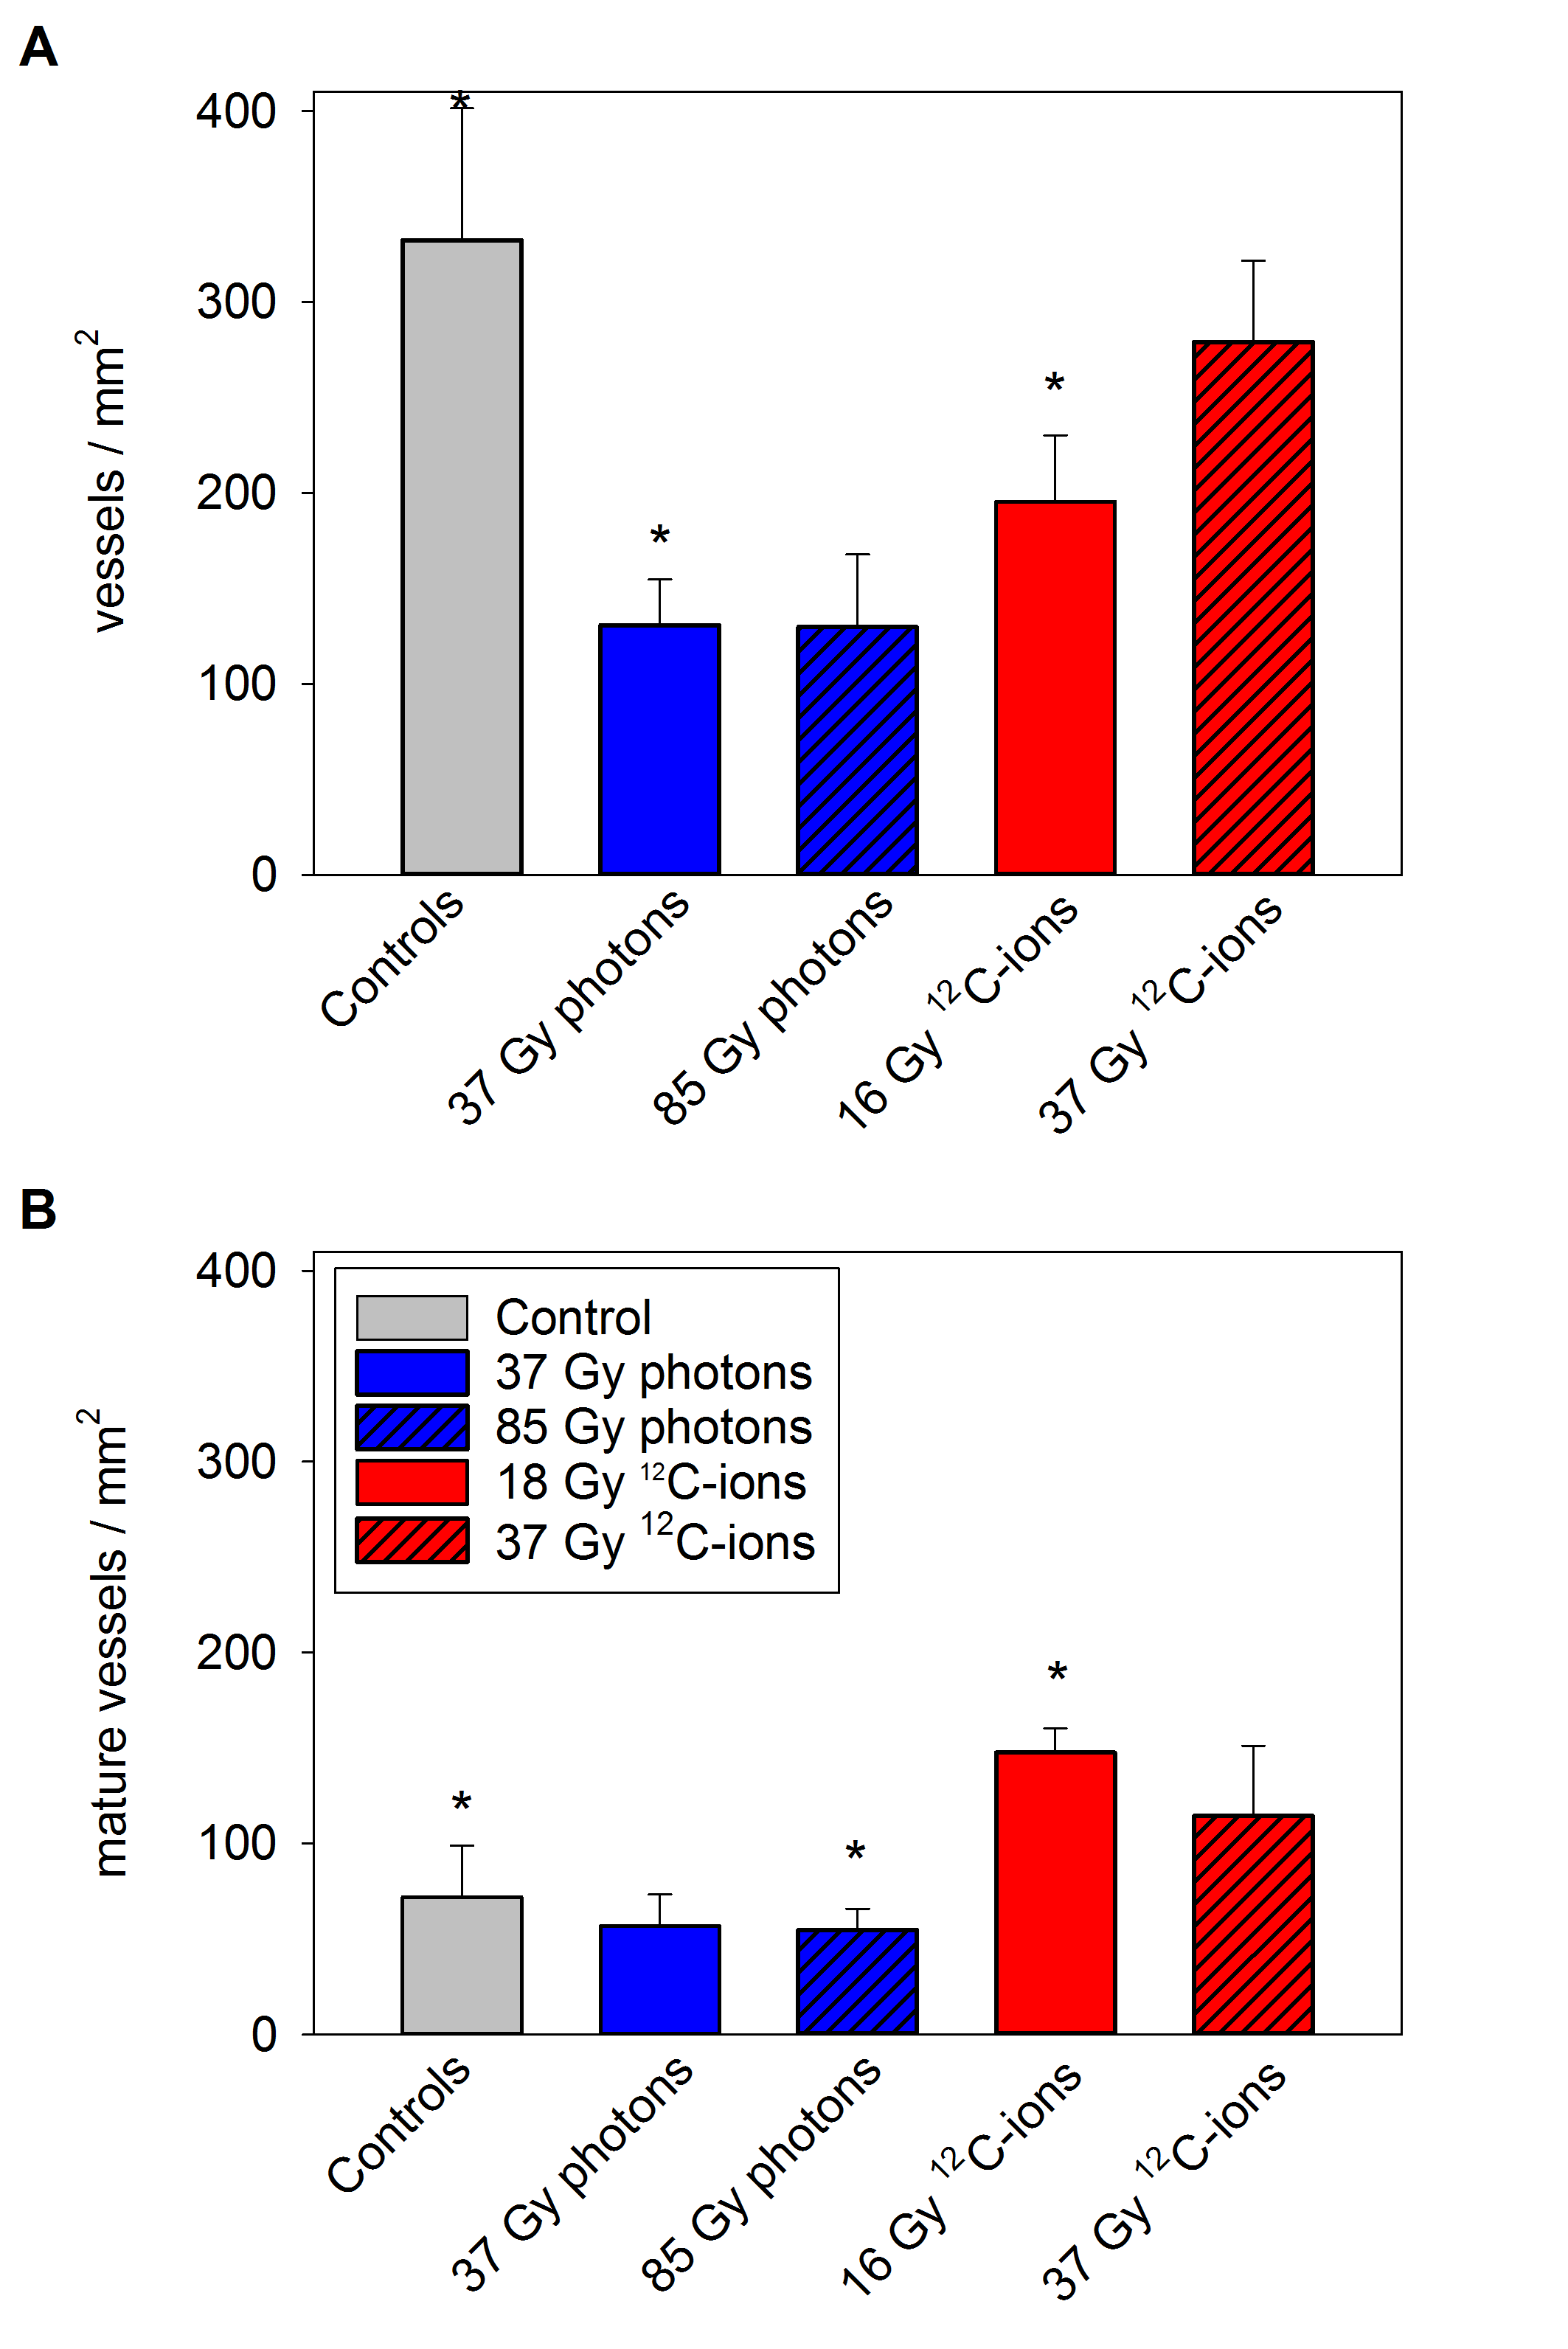
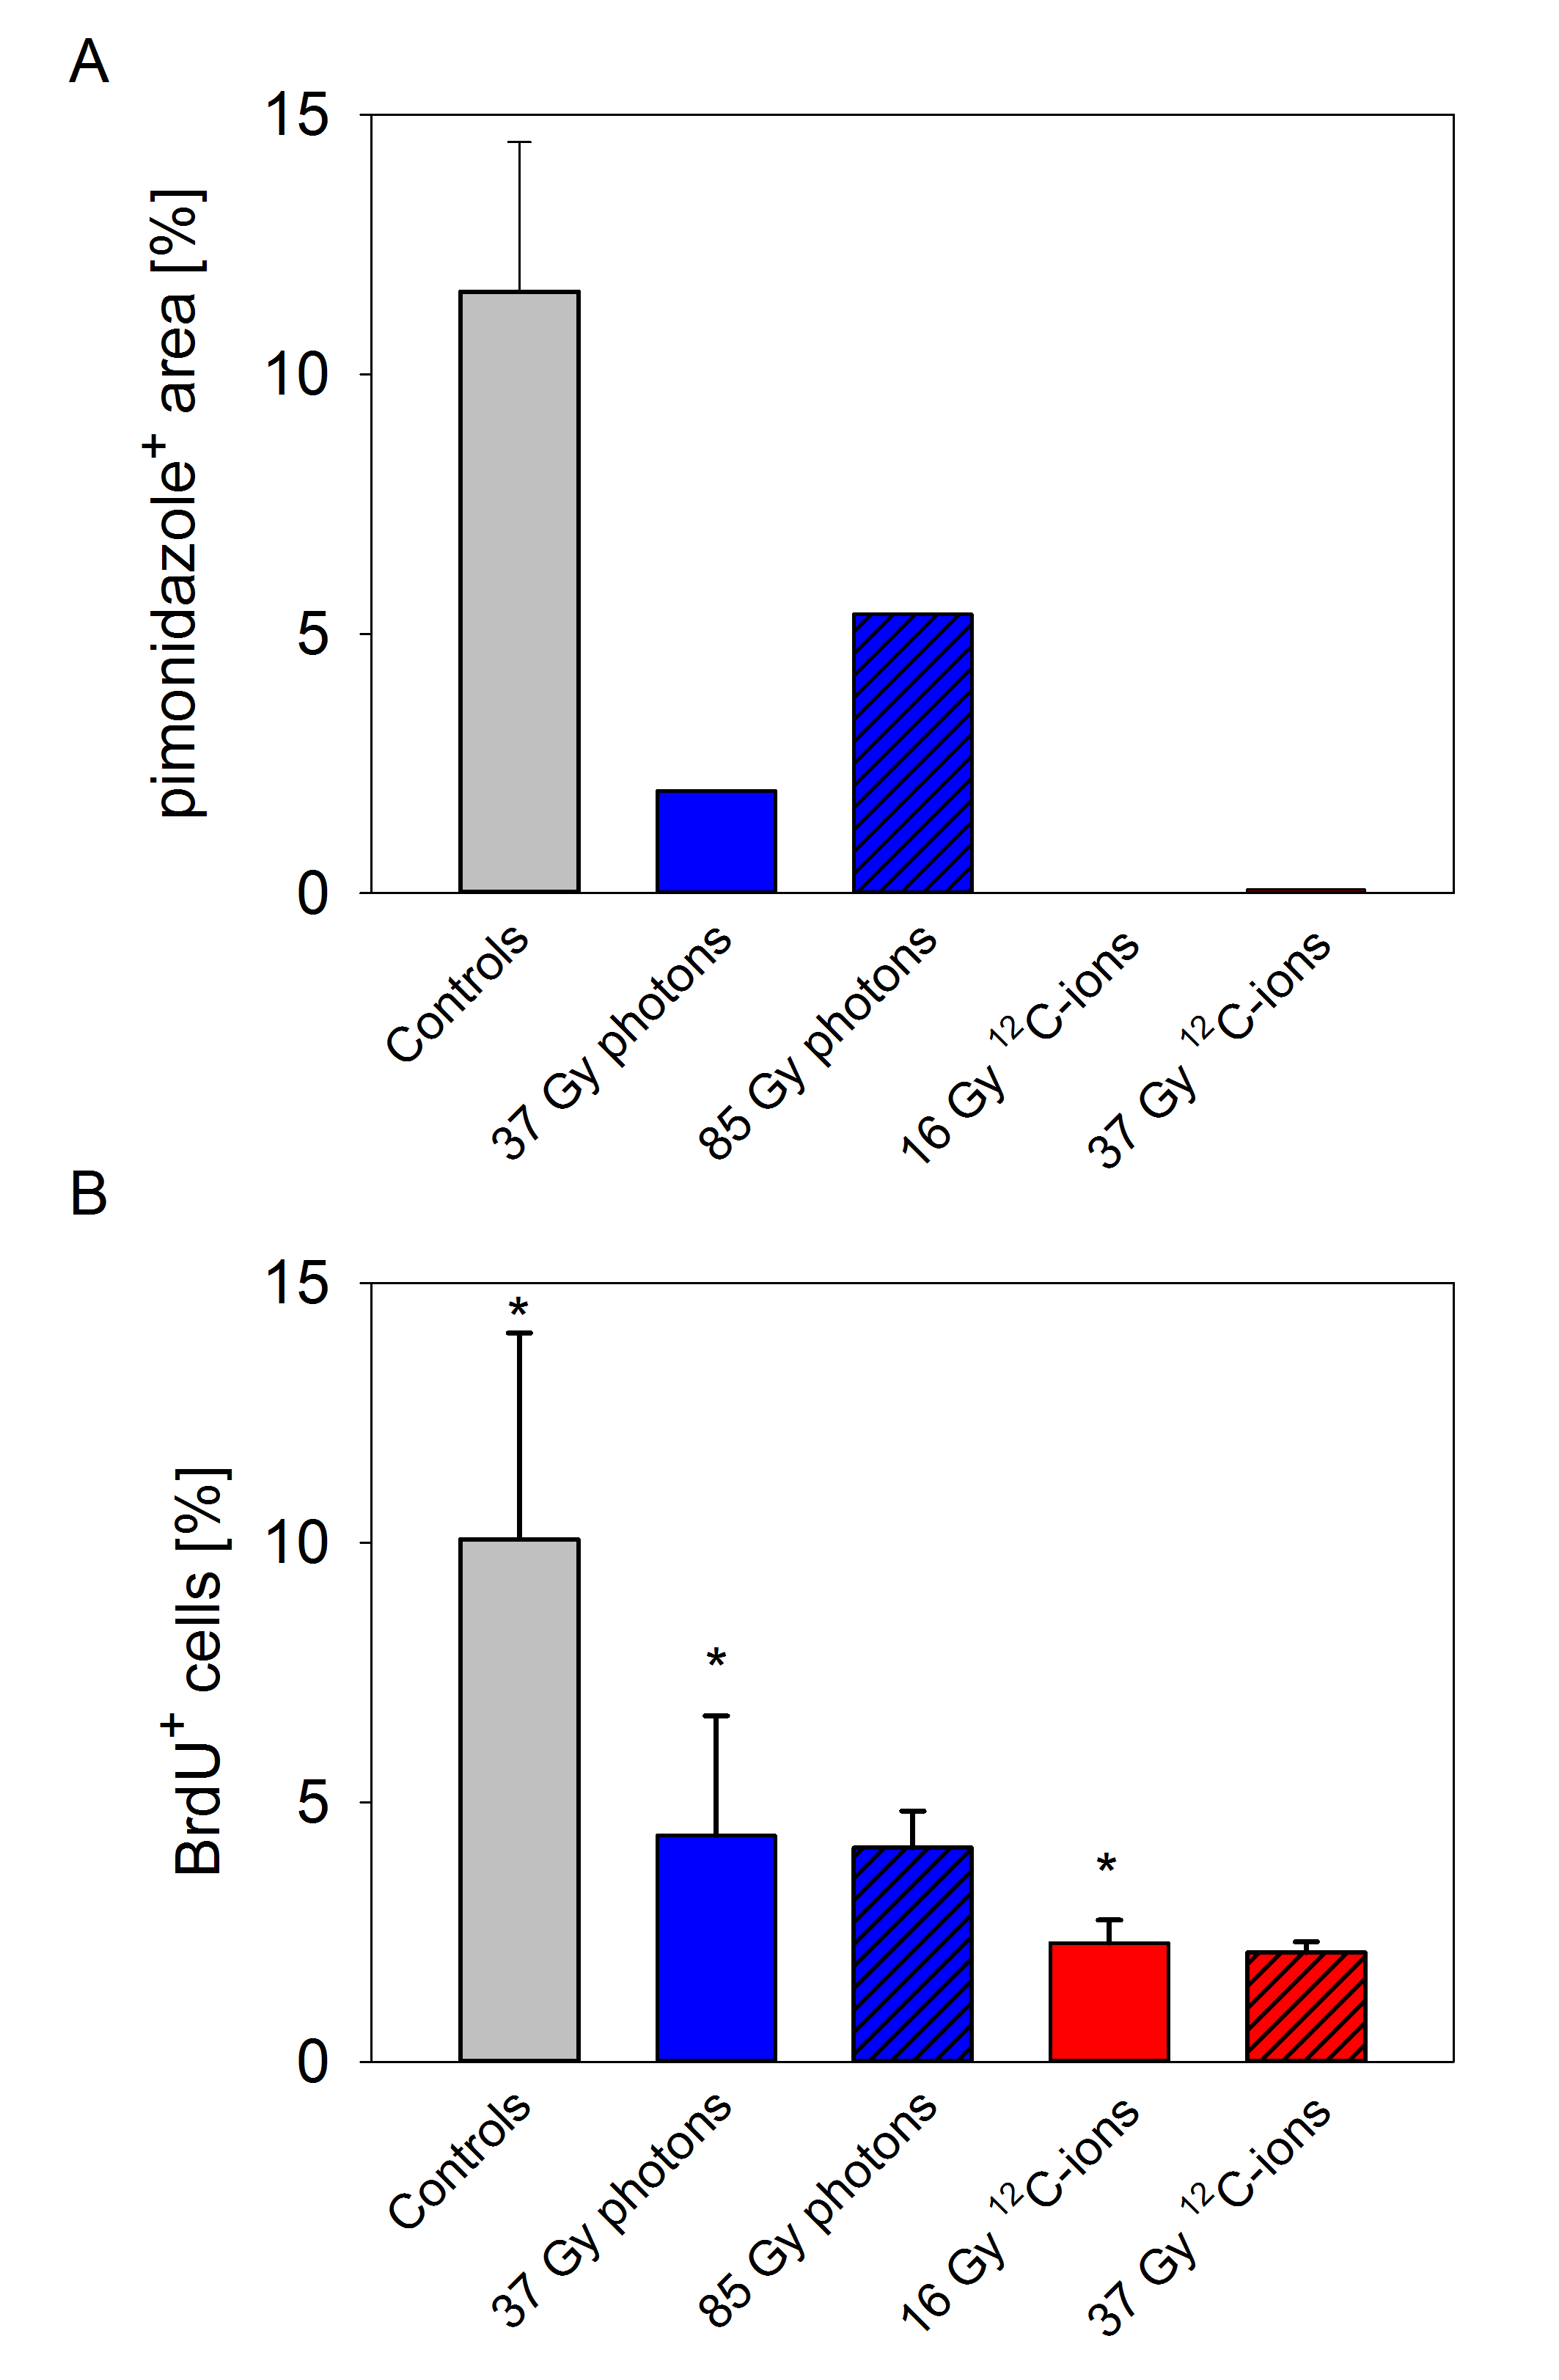
Following pharmacokinetic modelling of DCE-MRI data, non-irradiated control tumors showed a decrease in all fitted parameters (Ktrans, ve, vp, Fig. 1) over the observation period. 12C-ion treated tumors exhibited an early increase in Ktrans at day 3 while the response of photon treated tumors was prolonged until day 21. The low dose 12C-ion group exhibited the first increase in ve 3 days after RT, followed by the 37 Gy groups at 7 days and the high dose photon treated group at the last time point. Eventually, photon irradiation led to broader distributions in ve compared to 12C-ions. The vascular fraction vp exhibited reasonable values but no significant temporal changes apart from slightly enhanced values at day 21 after therapeutic doses of both modalities were found. Histological results revealed that photon RT led to heterogeneous tissue structures while 12C-ion irradiated tumors showed homogeneous and loosened tissues (Fig. 2). Non-irradiated controls exhibited the highest microvascular density but the lowest fraction of mature vessels (Fig. 3 A, B). Microvascular density and maturity were lowest after photons and increased with applied dose after 12C-ions.The hypoxic fraction was lower in irradiated tumors than in controls with no hypoxia at all in 12C-ion treated tumors (Fig. 2 F-J, 4 A). Proliferation was significantly reduced after irradiation with less than 5% proliferation after photons and less than 2.5 % after 12C-ions (Fig. 2 P-T, 4 B). Within the observation period the longitudinal development of ETM parameters and the histological endpoint results were dependent on treatment modality rather than applied dose.Discussion and conclusion
The
continuously decreasing fitting parameters observed for the non-irradiated
controls reflect well the progressive decline of perfusion within the tiny,
immature capillaries, characteristic for the AT1-tumor, and the resulting development
of hypoxia and necrosis found in histology.
12C-ions
evoked an early and strong treatment response seen in the increase in Ktrans and ve 3 days after irradiation indicating
increased perfusion and vascular permeability. The elevated ve values at the final
imaging time point correlate well with the reduced cell density observed in histology
for this time point. Furthermore, the heterogeneous tissue structure found in
photon treated tumors is reflected by the broad range of ve for this treatment group and underlines the
dependency of photon RT on the local tumor microenvironment. Decreased
proliferation activity and almost full reoxygenation 21 days after RT indicate
that treatment response is advanced for 12C-ions compared to photons.
Within
the observation period, DCE-MRI and subsequent ETM analysis and histology
revealed no differences between therapeutic and sub-therapeutic doses for both
modalities.
Hence, DCE-MRI is a feasible imaging tool for detecting treatment related
changes after photon and 12C-ion RT correlating with histological
findings. 12C-ions increased the perfusion and permeability faster
and stronger compared to photons and led to more a homogeneous tumor response.Acknowledgements
We thank Inna Babushkina for her excellent technical support. This work was supported by the German Research Foundation (Grant Numbers DFG, KFO 214, GL893/1-1, and KA2679/3-1).References
1. Uhl M, Herfarth K, Debus J. Comparing the use of protons and carbon ions for treatment. Cancer J. 2014;20(6):433 - 439.
2. Glowa C, Karger CP, Brons S, et al. Carbon ion radiotherapy decreases the impact of tumor heterogeneity on radiation response in experimental prostate tumors. Cancer Lett. 2016;378(2):97-103.
3. Isaacs JT, Heston WDW, Weissmann RM, et al. Animal Model of the Hormone-sensitive and -insensitive Prostatic Adenocarcinomas, Dunning R-3327-H,R3327-HI, and R3327-AT1. Cancer Res. 1978;38:4353 - 4359.
4. Bendinger AL, Debus C, Glowa C, et al. Bolus arrival time estimation in dynamic contrast-enhanced magnetic resonance imaging of small animals based on spline models. Phys Med Biol. 2018; Submitted.
5. Debus C, Floca R, Ingrisch M, et al. MITK-ModelFit: generic open-source framework for model fits and their exploration in medical imaging - design, implementation and application on the example of DCE-MRI. 2018:32, Located at: https://arxiv.org/abs/1807.07353.
6. Sourbron SP, Buckley DL. Classic models for dynamic contrast-enhanced MRI. NMR Biomed. 2013;26(8):1004-1027.
Figures