2335
Early non-invasive prediction of response to Temozolomide in low-grade glioma1Radiology and Biomedical Imaging, University of California San Francisco, San Francisco, CA, United States
Synopsis
Newly diagnosed low-grade glioma (LGG) patients have a relatively long survival, but nonetheless ultimately recur. New therapies are therefore being considered for LGG. One approach is the use of Temozolomide, previously reserved for treating high grade glioblastoma. However, early indicators of response are still needed. Here, we investigated response to Temozolomide treatment in an orthotopic LGG mouse model. Using 1H MRS we detected an early decrease in total choline and a surprising increase in both glutamine and glutamine plus glutamate that were associated with ultimate tumor shrinkage. This identifies potential early metabolic biomarkers of response to Temozolomide treatment in LGG.
Introduction
World Health Organization (WHO) grade II/III diffuse infiltrative low-grade gliomas (LLG) are comprised of astrocytoma and oligodendroglioma tumors. Compared to high grade glioblastoma, newly diagnosed LGG have a relatively long-term survival, but these tumors always recur, and new therapeutic approaches are being considered for these tumors. One promising approach is treatment with Temozolomide (TMZ), which was previously used only in the management of glioblastoma1. However, early indicators of LGG response to TMZ are currently not available. The goal of this study was therefore to use 1H MR spectroscopy (MRS) to identify potential metabolic biomarkers that can predict therapeutic response to treatment with TMZ in a LGG mouse model.Methods
LGG mouse model: BT142 cells, a patient-derived mutant IDH glioma model, were grown as neurospheres in serum-free medium (NeuroCult, Stemcell technologies) and then 1x10⁵ BT142 cells were intracranially injected into SCID Fox mice (Charles River Lab)2. Treatment was initiated when tumor reached a size of 81±28mm3. Mice were treated daily p.o. with Ora-plus (4ml/kg) or TMZ resuspended in Ora-plus (5 mg/kg, 4ml/kg).
MR studies: all studies were performed in a vertical wide-bore Agilent 600MHz scanner. Axial T2-weighted images were acquired using a spin-echo multi-slice sequence (TE/TR=20/1200ms, FOV=30x30mm2, 256x256, slice thickness=1mm, NA=2). Tumor size was determined as the sum of manually contoured tumor area in each slice and multiplied by slice thickness using in-house software. In vivo 1H MRS spectra were recorded using Point-RESolved Spectroscopy sequence (TE/TR=20/4000ms, 512) and analyzed using LCmodel. The values obtained were normalized to voxel size and total signal. The MR studies were performed on day zero (D0) prior to onset of treatment, and at days 6±1 (D6±1) and 15±1 (D15±1) of treatment. At the end of MR studies, animals were euthanized and tumors rapidly frozen in liquid nitrogen prior to extraction.
1H MRS of the tumor extracts: ~10-30mg of frozen tumor tissues were extracted using the dual-phase extraction method (n=5 per treatment group). Lyophilized aqueous phase was resuspended in 500μL of D2O and spectra were acquired on a Bruker 500MHz spectrometer. Metabolite concentrations were determined using pulse length-based concentration (PULCON)3. The concentrations obtained were normalized to wet tissue weight.
Results
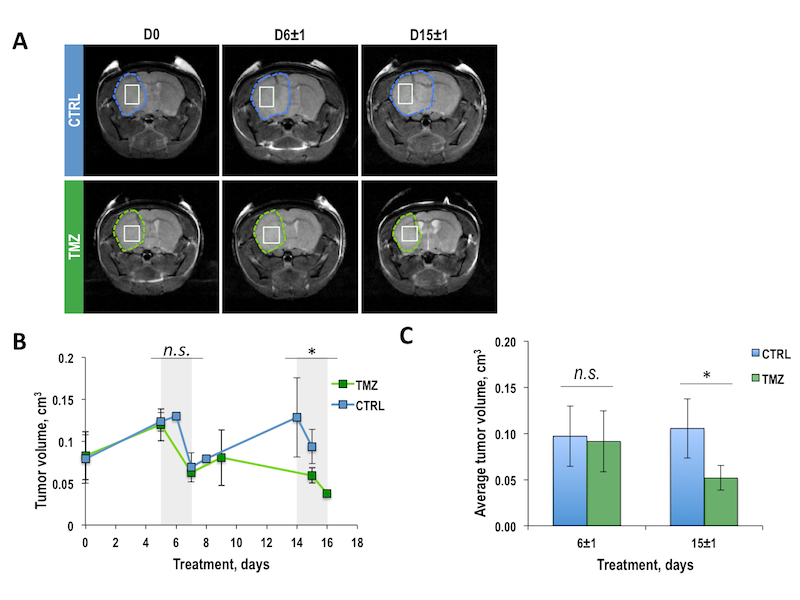
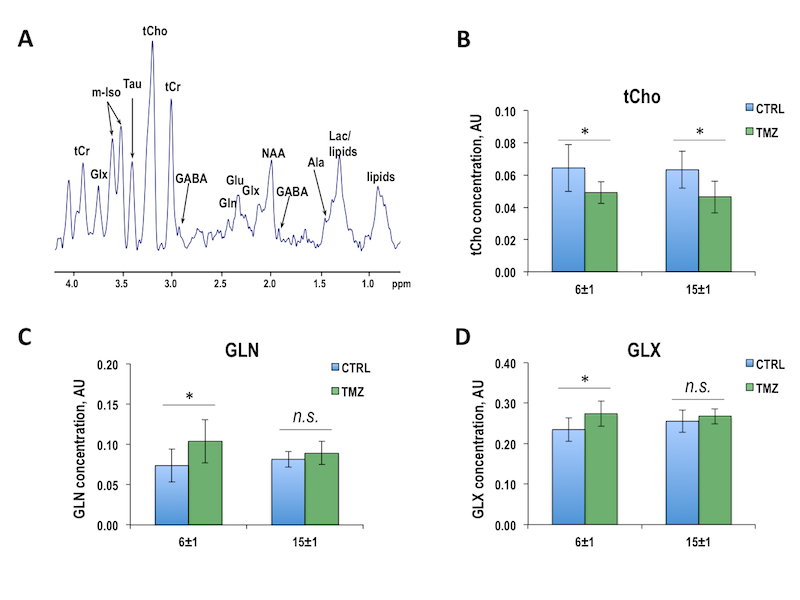
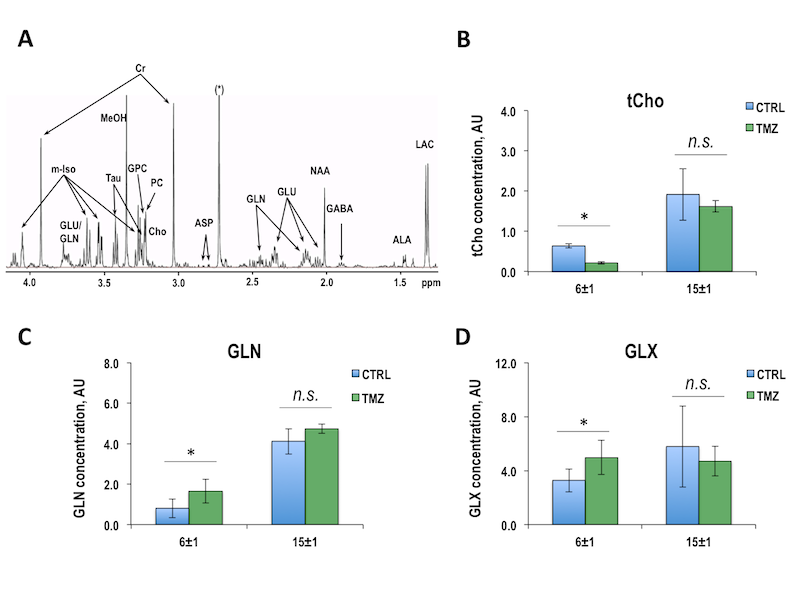
Once BT142 xenografts reached a size of 81±28mm3 (124±5 days post-implantation), mice were randomly divided into control and treatment groups. Figure 1A illustrates anatomical T2-weighted images of control and TMZ-treated BT142 tumor-bearing mice at D0, D6±1 and D15±1 of treatment. Temporal evolution of average tumor volume during TMZ treatment is shown in Figure 1B. Quantification of average tumor volume in each treatment group at D6±1 (0.10±0.03cm3, n=8 for control and 0.09±0.03cm3, n=7 for TMZ-treated, p-value=0.620) and D15±1 (0.11±0.03cm3, n=5 for control and 0.05±0.01cm3, n=5 for TMZ-treated, p-value=0.013) is shown in Figure 1C. The significant tumor shrinkage, observed at D15±1, confirmed our previous studies of BT142 tumor response to TMZ treatment4. Figure 2A exhibits the in vivo 1H MRS spectrum from the tumor voxel shown in Figure 1A. Metabolites from spectra acquired at D6±1, prior to visible tumor changes, and at D15±1, when tumor shrinkage was observed, were quantified. As shown in Figures 2B-D, significant changes were observed in total choline (tCho), glutamine (GLN) and the sum of glutamine and glutamate (GLX). At D6±1 of treatment, tCho decreased by 22.4% (p-value=0.045), GLN increased by 48.5% (p-value=0.020) and GLX increased by 16.6% (p-value=0.040). Interestingly at D15±1 the reduction in tCho was comparable at 26.6% (p-value=0.038), while GLN and GLX levels were similar to those observed in the TMZ-treated tumors (p-value=0.349 and p-value=0.457). We further assessed our findings by analyzing 1H spectra of extracted control and TMZ-treated tumors (Figure 3A). At D6±1 of TMZ treatment there was a significant 28.5% reduction in tCho (p-value=0.05), a significant 103.0% increase in GLN (p-value=0.036) and a significant 51.5% increase in GLX (p-value=0.043) in line with the in vivo observations, whereas data acquired at D15±1 no significant differences in either tCho (p-value=0.316), GLN (p-value=0.881) or GLX (p-value=0.486) between control and treated tumors (Figures 3B-D).Conclusions
In this study we observed that a decrease in tCho and increase in GLN and GLX occur in a LGG model following TMZ treatment prior to visible changes in tumor volume. The decrease in tCho concentration might reflect a decrease in membrane synthesis and cellularity. The increase in GLN/GLX remains to be explained, but, importantly, was previously reported by our group in LGG cell models treated with TMZ5. Further studies are needed to confirm the generality of our findings, but our study identifies the increase in GLN/GLX as potential early metabolic biomarkers of LGG response to TMZ treatment.Acknowledgements
NIH R01CA197254References
1. Roxas, R.C.D., Suratos, C.T.R. & Fernandez, M.L.L. Temozolomide as Treatment in Lowgrade Glioma: A Systematic Review. Neuro-Oncology 1 (2016).
2. Luchman, H.A. et al. An in vivo patient-derived model of endogenous IDH1-mutant glioma. Neuro Oncol 14, 184-191 (2012).
3. Goldoni, L., Beringhelli, T., Rocchia, W., Realini, N. & Piomelli, D. A simple and accurate protocol for absolute polar metabolite quantification in cell cultures using quantitative nuclear magnetic resonance. Analytical Biochemistry 501, 26-34 (2016).
4. Chaumeil, M.M. et al. Hyperpolarized 13C MR imaging detects no lactate production in mutant IDH1 gliomas: Implications for diagnosis and response monitoring. NeuroImage: Clinical 12, 180–189 (2016).
5. Subramani, E., Le Page, L.M., Pieper, R.O. & Ronen, S.M. Magnetic resonance spectroscopy-based metabolic biomarkers of IDH1 mutant glioma in response to temozolomide therapy. ISMRM Abstract #4009 (2018).
Figures