2331
Respiratory motion variability in 4D-MRI for MR-guided radiotherapy1Radiotherapy, University Medical Center Utrecht, Utrecht, Netherlands, 2MR Code B.V., Zaltbommel, Netherlands, 3Biomedical Engineering, University of Technology Eindhoven, Eindhoven, Netherlands
Synopsis
Respiratory-induced motion of abdominal tumors can lead to displacements up to five centimeter, making radiotherapy treatments very challenging. The respiratory motion can be characterized by a 4D-MRI, acquired prior to treatment. In this study we investigate how long the 4D-MRI is valid for after acquisition. Additionally, the longitudinal validity of a motion model, derived from the 4D-MRI is assessed.
Purpose
Respiratory-induced motion of abdominothoracic tumors can lead to displacements up to five centimeter, making radiotherapy treatments very challenging1. Generally, the respiratory motion is characterized pre-treatment using a respiratory-correlated 4D-CT. It is known, however, that 4D-CT, which is only acquired once during the entire treatment course, has poor soft tissue contrast, and may not be representative for subsequent days2. MR-guided radiotherapy may overcome these issues, by acquiring a daily 4D-MRI immediately prior to treatment3. During treatment, MR imaging is usually limited to (a few) 2D slices, due to high temporal resolution requirements, whereas 3D volumes are ideally used to fully account for respiratory motion in all directions for all structures. One way to generate high spatiotemporal resolution 3D volumes is through the use of motion models, extracted from a respiratory-correlated 4D-MRI4. Nonetheless, this approach is only accurate, if the model is valid throughout the entire treatment. The goal of this study is to determine the intra- and inter-fractional respiratory variations, captured by 4D-MRI and how well this is represented in a motion model.Methods
Data acquisition: Four volunteers were scanned in three separate sessions on a 1.5T MRI-RT scanner (Ingenia, Philips, Best, the Netherlands). The second session followed 7 to 9 days after the first one, while the third session followed one day after the second scan. During each scan session, four 4D-MRI scans were acquired; one with the arms positioned besides the body, followed by one with the arms raised above the head to simulate differences between diagnostic and radiotherapy patient setup. Both scans (arms up and down) were repeated after approximately 15 minutes to simulate the duration of a single treatment session. This resulted in a total of 12 scans per subject. A 3D radial golden-angle stack-of-stars balanced steady-state free precession (bSSFP) sequence with fat suppression (Spectral Presaturation with Inversion Recovery – SPIR) was used (TR/TE=2.9/1.45ms, FA=40o, resolution = 1.7x1.7x4.0mm3, FOV=377x377x256mm3, acquisition time = 3m14s)4.
Image reconstruction: Raw k-space data were automatically sent to a reconstruction server where it was sorted into ten respiratory phases. To remove undersampling artifacts in the different phases, a compressed sensing algorithm in the form of XD-GRASP was used5. DICOM images were generated and send to a clinical database for further analyses.
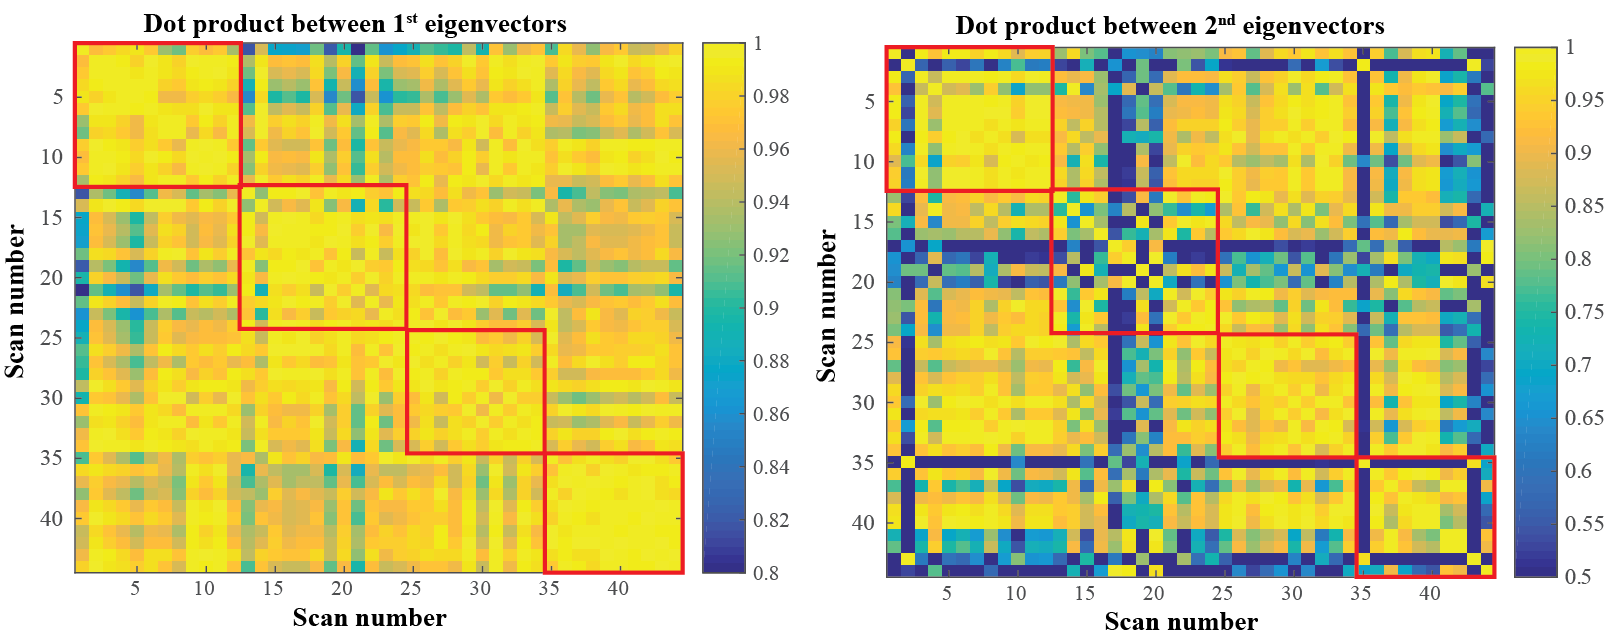
Image and motion analysis: Non-rigid registration was used to generate 3D deformation vector fields (DVFs) for all data sets6. The mean displacement within the right kidney was determined and the maximum motion in superior-inferior (SI) direction was used to determine the respiratory-induced motion amplitude. This was compared between 4D-MRIs acquired within the same session and between different days. Lastly, the DVFs were parameterized using a principal component analysis (PCA) and the directional similarity of the first two principal components (PCs) was compared between different scans by calculating the absolute value of the dot product between the normalized eigenvectors within and between subjects.
Results and Discussion
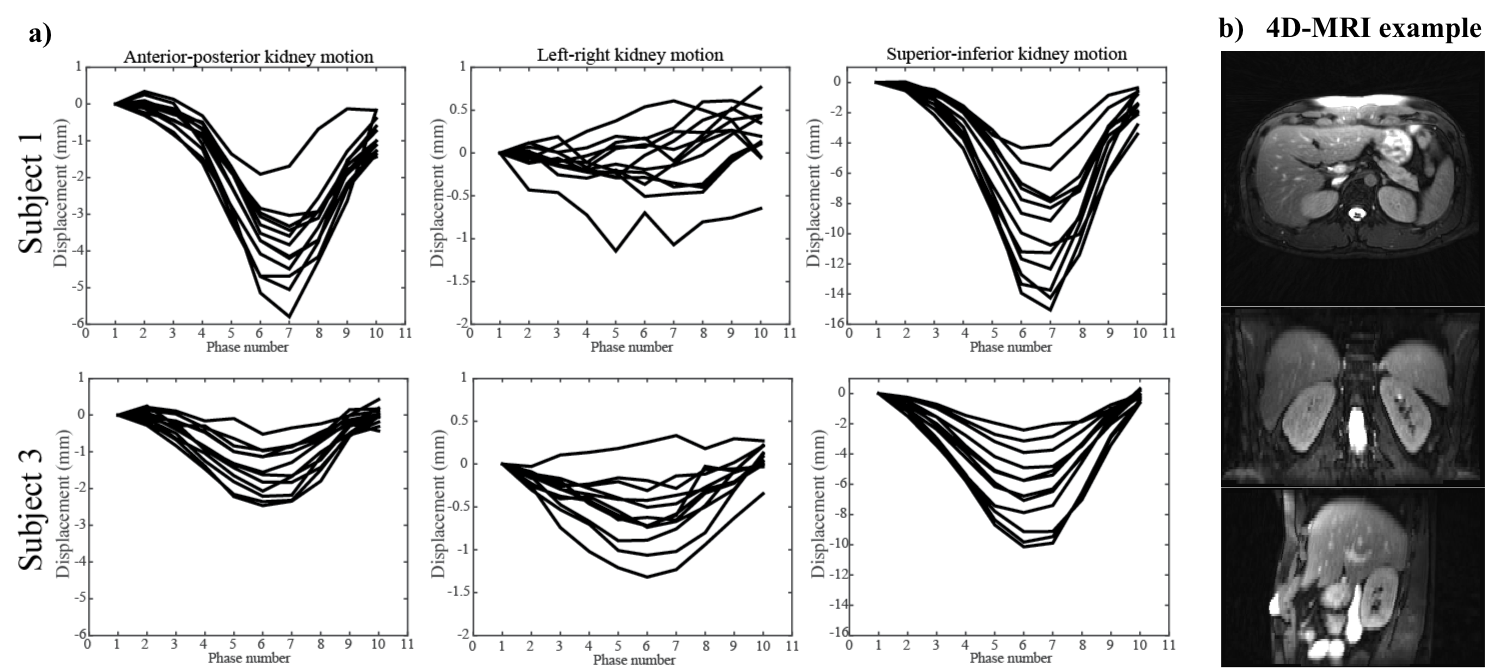
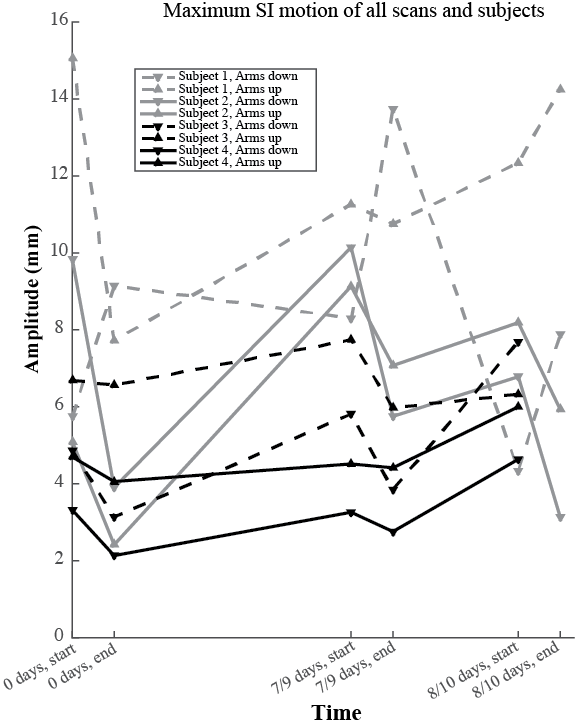
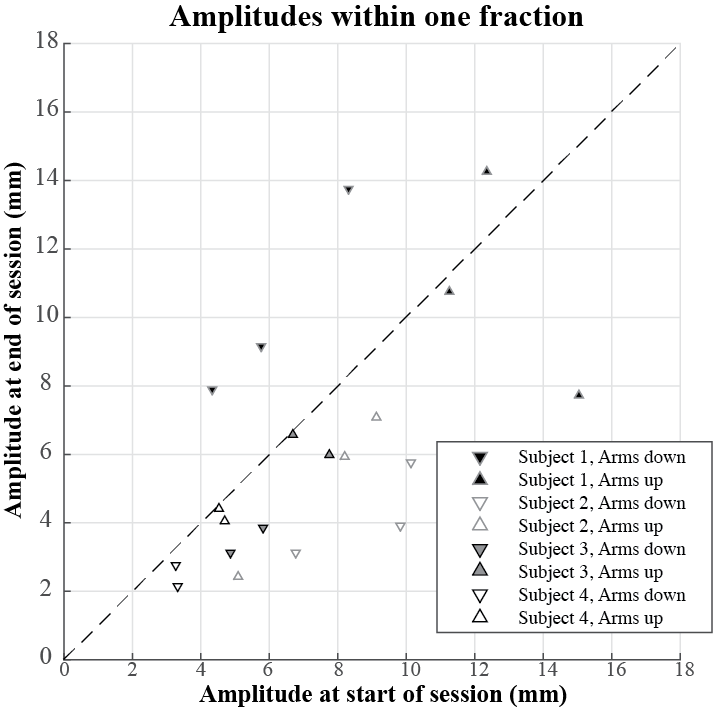
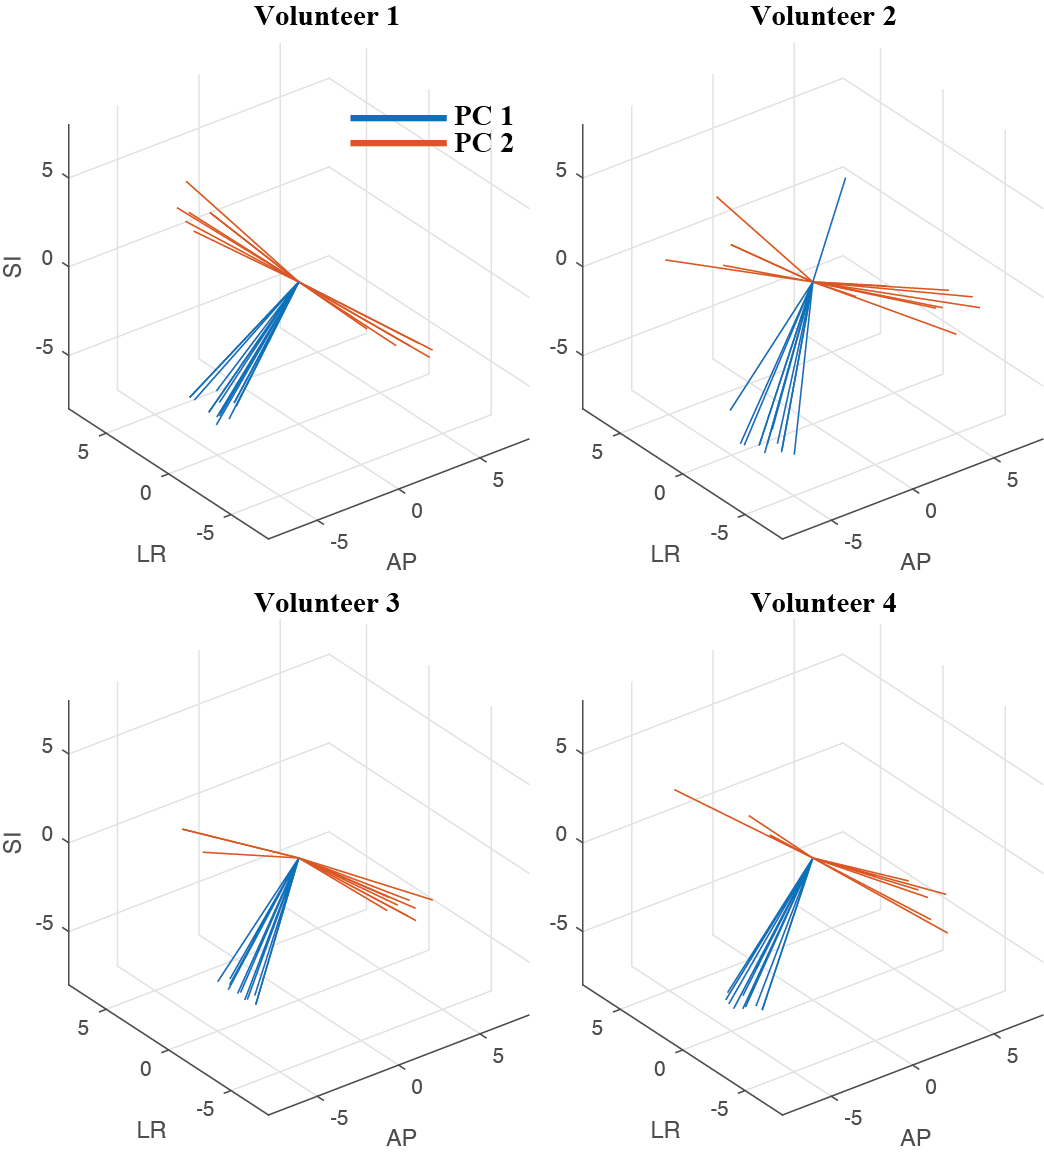
Figure 1a shows the motion in three directions for two of the subjects for all scans, Figure 1b shows a 4D-MRI example. Large variations are seen between and within these subjects, but the curves’ shapes are mostly similar within each subject, indicating that the motion follows the same motion path. Figure 2 displays the maximum amplitudes over the different scans for the arms up (triangle up) and arms down (triangle down). Again many variations are observed. Motion was larger when arms were raised above the head. Generally, except for subject 1, the motion is lower at the end of the session, which is confirmed by the scatter plot in Figure 3, but this was not significant. This means that a 4D-MRI acquired at the beginning of a treatment fraction may overestimate the motion at the end of a treatment fraction. Figure 4 shows the direction of the first two PCs of the motion model for the different volunteers. The directional similarity for the first PC was on average 0.984±0.015 and 0.800±0.209 for the second. In Figure 5 all directional correlations are shown for each subject (within the red squares) and between subjects.Conclusion
Although large variations in respiratory motion amplitude were observed for each subject, the principal direction of motion was very reproducible. Moreover, inter-subject variability is considerable and smaller variations in respiratory motion were observed for all subjects. A daily 4D-MRI therefore provides valuable information to capture the full dynamic of respiration and gives a good indication of the principal axis of motion. Nevertheless, the amplitude changes severely over the course of a treatment, which should be accounted for during treatment.Acknowledgements
This work is part of the research programme HTSM project number 15354, which is partly financed by the Netherlands Organisation for Scientific Research (NWO).References
[1] Heerkens HD, et al. MRI-based tumor motion characterization and gating schemes for radiation therapy of pancreatic cancer, Rad. Oncol. 2014;111:252-257
[2] Ge J, et al. Planning 4-Dimensional Computed Tomography (4DCT) cannot adequately represent daily intrafractional motion of abdominal tumors, IJROBP, 2013;85:999-1005
[3] Raaymakers BW, et al. First patients treated with a 1.5T MRI-Linac: clinical proof of concept of a high-precision, high-field MRI guided radiotherapy treatment. PMB2017;62:L41
[4] Stemkens B, et al. Image-drive, model-based 3D abdominal motion estimation for MR-guided radiotherapy, PMB2016;61:5335-5355
[5] Feng L, et al. XD-GRASP: Golden-angle radial MRI with reconstruction of extra motion-state dimensions using compressed sensing, MRM 2016;75:775-788
[6] Zachiu C, et al. An improved optical flow tracking technique for real-time MR-guided beam therapies in moving organs, PMB, 2015;60:9003-9010
Figures