2330
Treatment response and recurrence prediction on MR during radiotherapy in patients with head and neck squamous cell carcinoma1Radiotherapy, University Medical Center Utrecht, Utrecht, Netherlands, 2Head and Neck Surgical Oncology, University Medical Center Utrecht, Utrecht, Netherlands
Synopsis
Weekly MR imaging allows for tumor monitoring during treatment. T2 weighted imaging and distortion-free DW-TSE SPLICE were acquired weekly in 20 patients. Changes in volume and ADC could be followed over the course of (chemo)radiotherapy: volume decreases and ADC increases. Tumor delineation is crucial and becomes increasingly difficult during treatment. For the current patient population, 4 patients developed recurrent disease. However, volume changes measured on T2 weighted imaging and ADC changes did not yet show to be prognostic of tumor recurrence.
Introduction
In head and neck radiotherapy, early recognition of patients with poor response to treatment is important and might allow for treatment modification. Conventionally, tumor volume changes are used to assess treatment response. Recently, apparent diffusion coefficient (ADC) determined by diffusion weighted magnetic resonance imaging (DW-MRI) has been introduced as a prognostic factor in patients with head and neck squamous cell carcinoma. Additionally, with the introduction of hybrid MR Linac technology [1], daily DW-MRI data will become available for patients treated on these systems. Where the traditional single shot echo-planar-imaging technique suffers greatly from geometrical distortions due to the large susceptibility differences in the head and neck region, a turbo spin echo (TSE) technique, as used in this study, can provide a geometrically robust alternative.
Aim: To follow treatment response on DW-MRI and T2 weighted images of head and neck tumors.
Methods
The PREDICT study will include a total of 100 patients with stage II, III or IV head and neck squamous cell carcinoma treated with radiotherapy with or without concurrent chemotherapy. Currently, the first 20 patients enrolled in this study have at least 3 months follow up and were available for analysis.
Repeated MR imaging was performed on these patients: prior to (baseline) and during week 2, 3, 4 and 5 of the radiotherapy treatment. Imaging was obtained with the patient positioned in the radiotherapy mask on a 3.0 T Philips Ingenia system (Philips, Best, The Netherlands) using flexible surface coils.
- T2 weighted imaging: multishot TSE, TE/TR=100/4022 ms, FOV = 280x200x120 mm3, voxel size = 0.9x0.9 mm2, 2.0 mm slices, mDixon 2 acquisitions with ΔTE = 1 ms, SENSE=2, acquisition time=4m25s.
- DW-MRI: single shot TSE SPLICE [2,3], TE/TR=74/16138 ms, FOV = 280x200x120 mm3, voxel size = 1.8x1.8 mm2, 4.0 mm slices, b-values(averages) = 0(2), 200(2), 800(5) s/mm2, SENSE=2, acquisition time=6m11s.
All imaging was linked through rigid registration. Tumor delineation was performed on T2 weighted images for the baseline MRI. This delineation was transferred to the corresponding DW-MRI and ADC maps. Additionally, this delineation was transferred to the ADC maps of each treatment week. ADC ROI statistics were determined using these delineations and median ADC values were normalized on their baseline values.
Additionally, the tumor was delineated again for each consecutive week based on the T2 weighted MRI to measure differences in volume. These were also transferred to the ADC maps for analysis.
Results & discussion
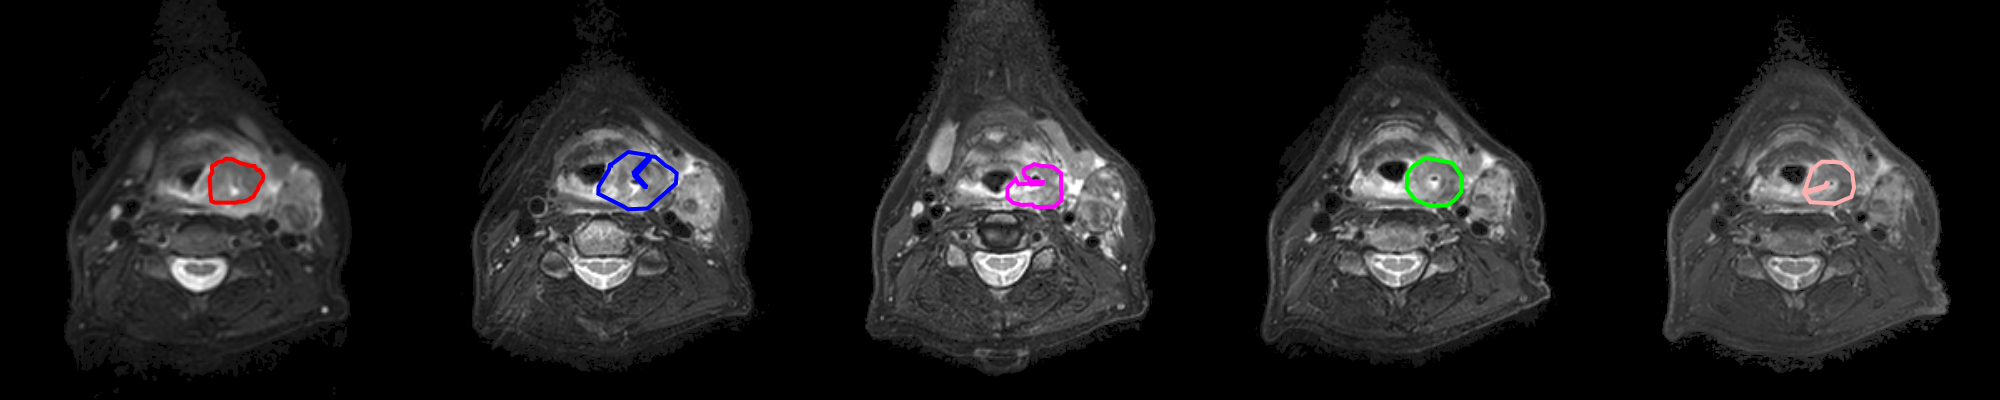
During (chemo)radiotherapy tumors generally reduce in size with each passing week. Figure 1 shows an example of T2 weighted imaging during treatment. On average tumors reduced to half their original size by the end of the third week of treatment. However, due to the treatment effects, tumors are increasingly harder to differentiate from nonmalignant tissues in the treatment area. In one patient, the tumor visibly increased in size from the third week onward; this patient had a local recurrence within 3 months after treatment. In total 4 patients developed recurrent disease during follow up.
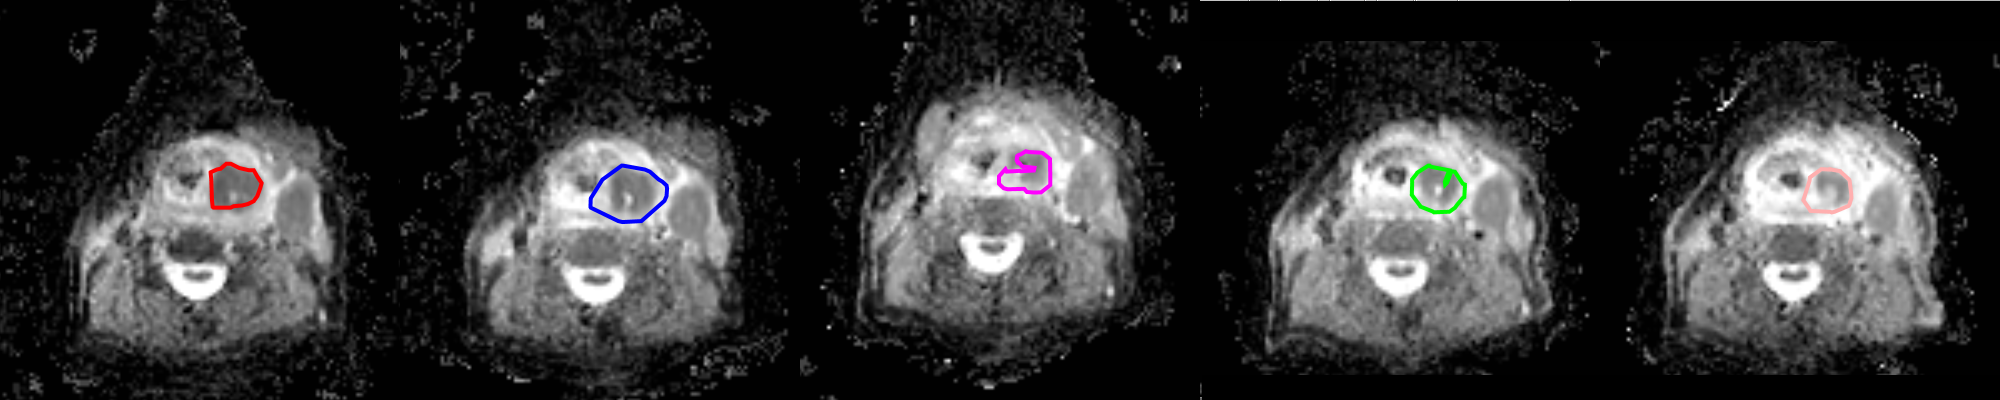
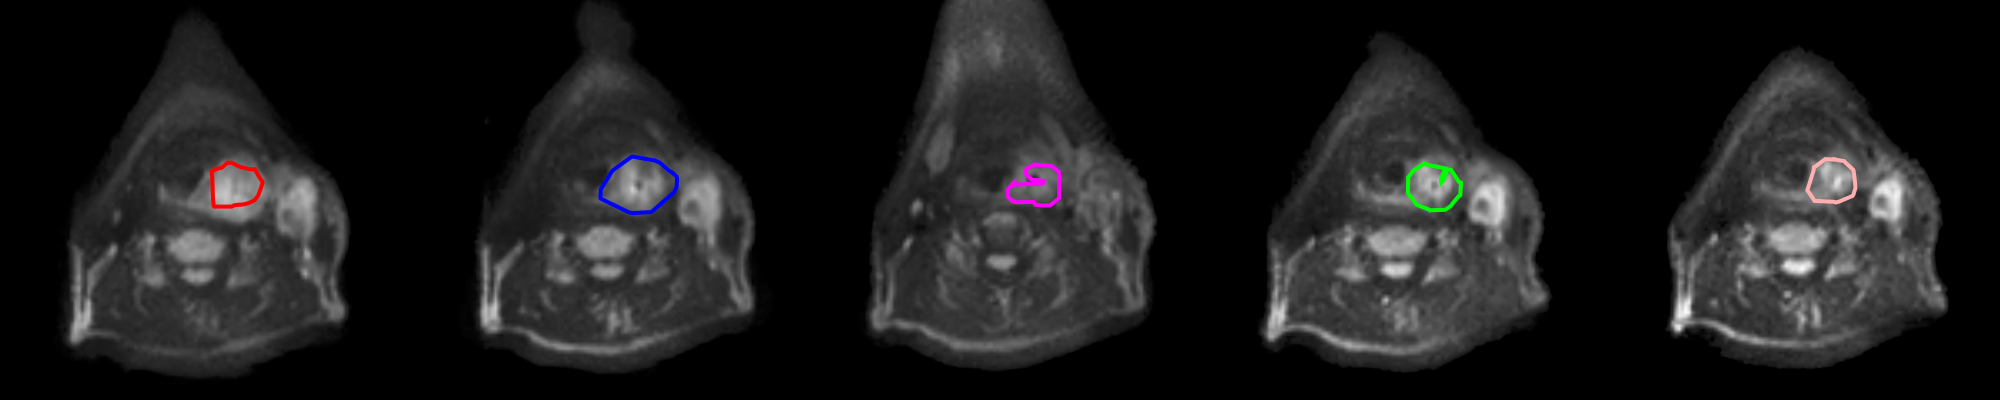
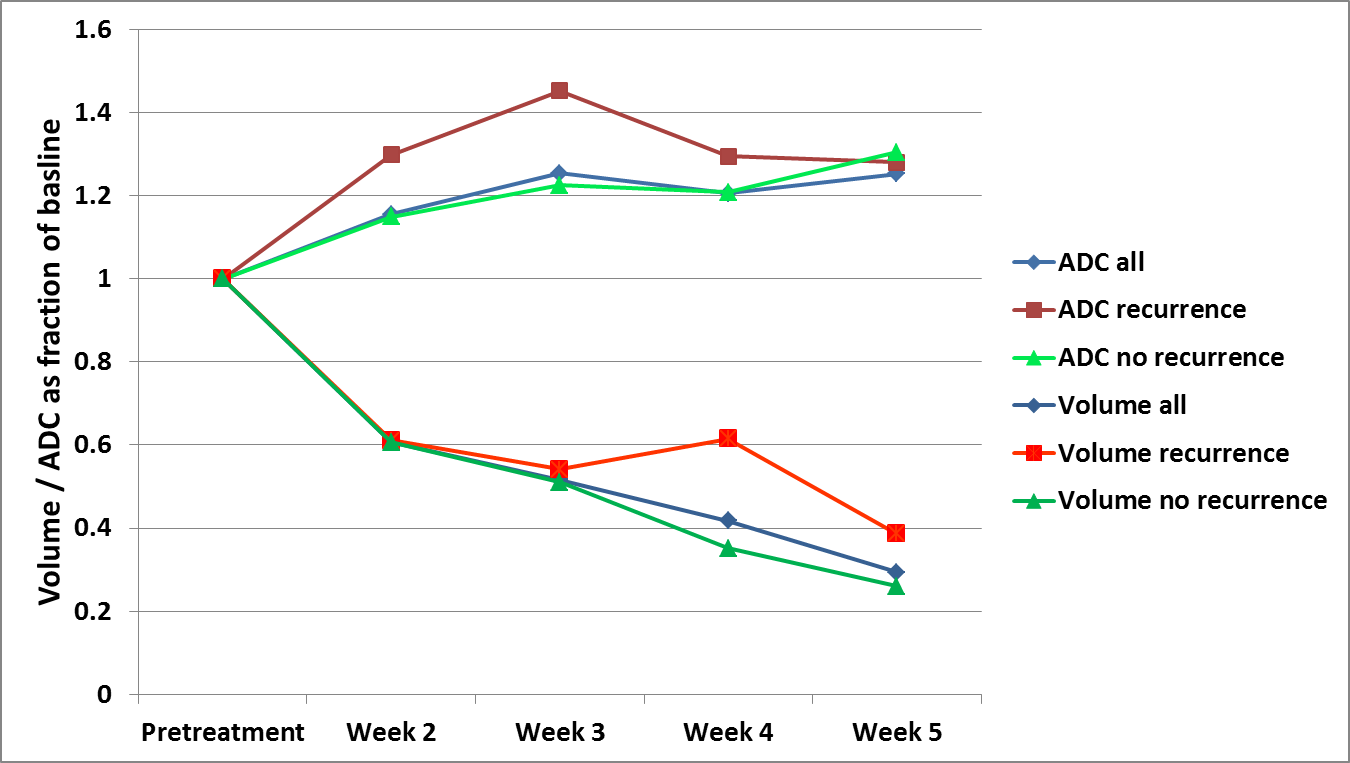
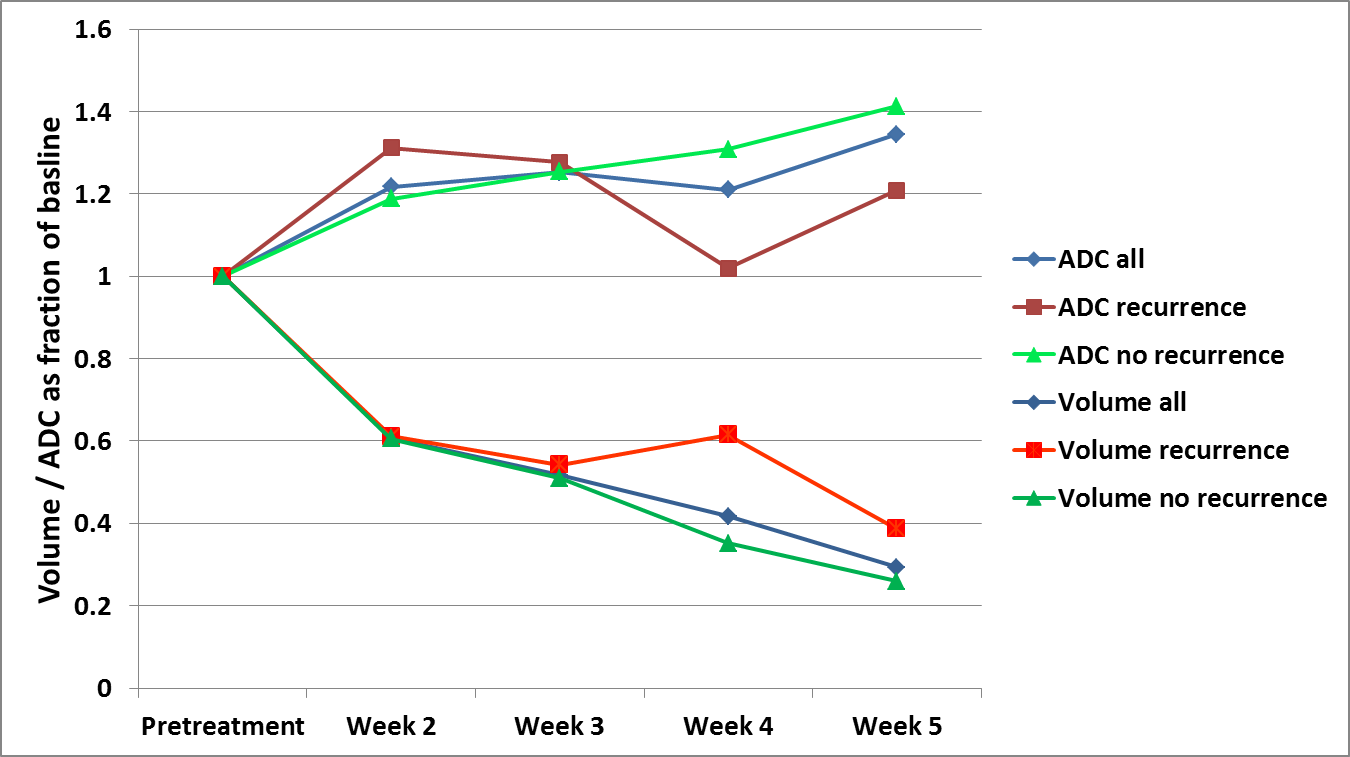
Figures 2 and 3 show ADC maps and b = 800 s/mm2 images during treatment. Due to the undistorted DW-TSE SPLICE sequence, delineations could readily be transferred from the T2 images. Median ADC values, within the delineation determined on T2 weighted imaging, showed a gradual increase over the course of treatment. When the same baseline tumor delineation was used for the consecutive weeks, a larger increase in median ADC values in week 2 and 3 was observed for patients who developed a recurrence (figure 4). However, when the tumor was redelineated every week on the T2 weighted imaging, the patients with recurrent disease showed a lower median ADC in weeks 4 and 5 (figure 5).
These differences highlight the dependence of results on the selected volumes for ADC measurements. Therefore, voxel-by-voxel comparisons of ADC changes [4] could provide more insight in the response to treatment and the prognostic value of ADC. The changes during the early weeks of treatment (2 and 3) are important since treatment modifications are still possible. The distortion-free DW-TSE SPLICE method that was used in this study would certainly facilitate such an analysis.
It was not possible to distinguish between patients who would later develop a recurrence and those who did not, based on changes in volume and ADC.
Conclusion
Weekly MR imaging allows for tumor monitoring during treatment, although delineation is crucial and increasingly difficult in some patients. For the current patient population, volume changes measured on T2 weighted imaging and ADC changes did not yet show to be prognostic of tumor recurrence.Acknowledgements
No acknowledgement found.References
[1] Lagendijk et al, Semin Radiat Oncol. 2014;24(3):207-09
[2] Schick, Magn Reson Med. 1997;38(4):638-44
[3] Schakel et al, Med Phys. 2017;44(8):4188-93
[4] Moffat et al, Neoplasia. 2006;8(4):259-67
Figures