2329
Baseline Tumor Apparent Diffusion Coefficient Value Can Predict First-line Sunitinib Therapy Response of Stage IV Clear Cell Renal Cell Carcinoma1Surgery, Peking Union Medical College Hospitall, Chinese Academy of Medical Sciences, Beijing, China, 2National Cancer Center/National Clinical Research Center for Cancer/Cancer Hospital, Chinese Academy of Medical Sciences and Peking Union Medical College, Beijing, China
Synopsis
Our single-center retrospective study focused on Stage IV Clear Cell Renal Cell Carcinoma patients who received first-line sunitinib therapy and found that baseline tumor apparent diffusion coefficient value derived from 3T diffusion weighted imaging showed different level in different response group. Baseline tumor ADC value also had significant correlation with progression-free survival. Patients with higher tumor ADC value had significantly longer progression-free survival. Basline tumor ADC can be a potential predictor in assessing targeted therapy response of Stage IV ccRCC.
Introduction
Patients with Stage IV clear cell renal cell carcinoma (ccRCC) have a poor prognosis with 5-year survival rate less than 10%. Sunitinib is the one of the recommended first-line therapy for these patients. However, the objective response rate is around 30%, which means only part of patients benefit from treatment. This study focused on the pretreatment MR imaging of ccRCC patients and aimed to explore whether the baseline tumor apparent diffusion coefficient (ADC) value can predict therapy response among these patients.Methods
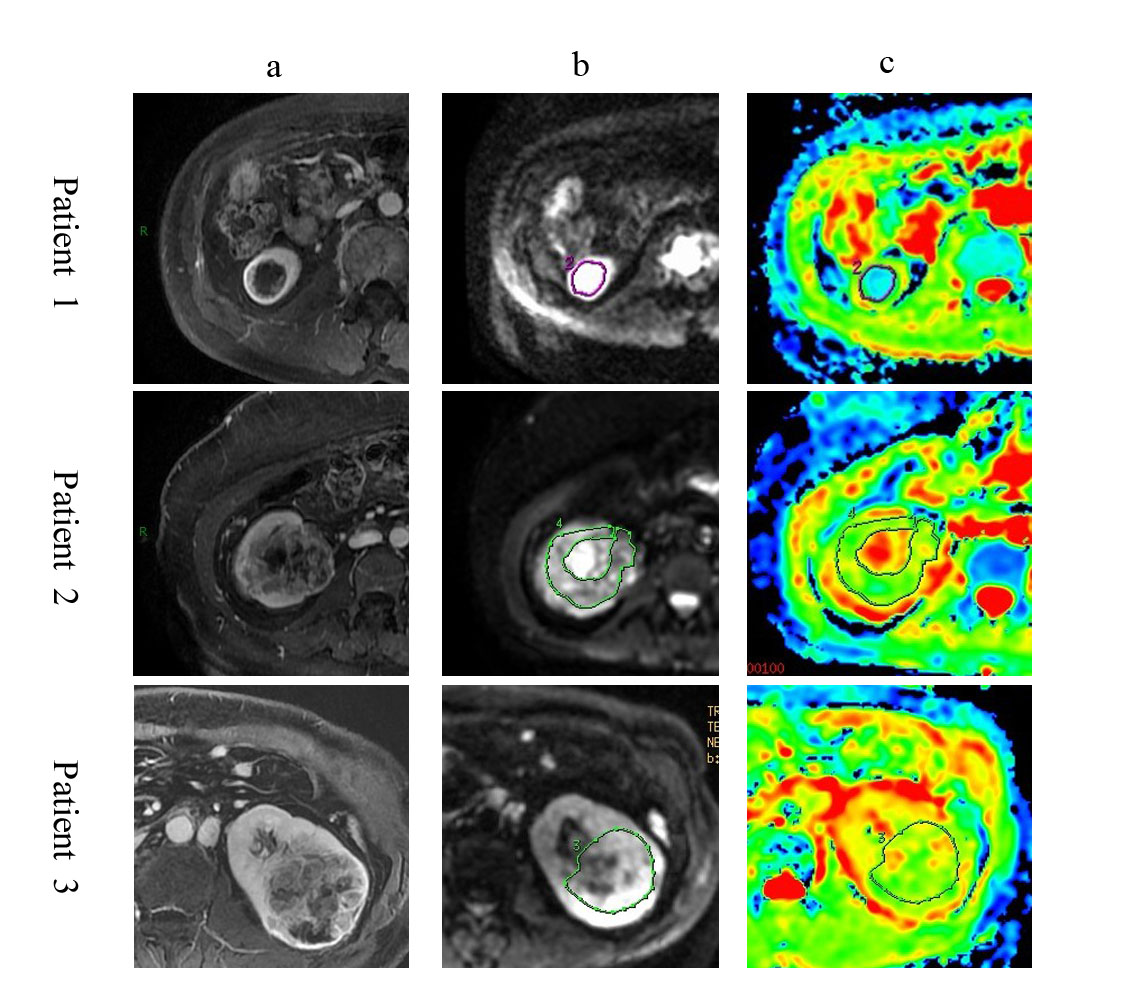
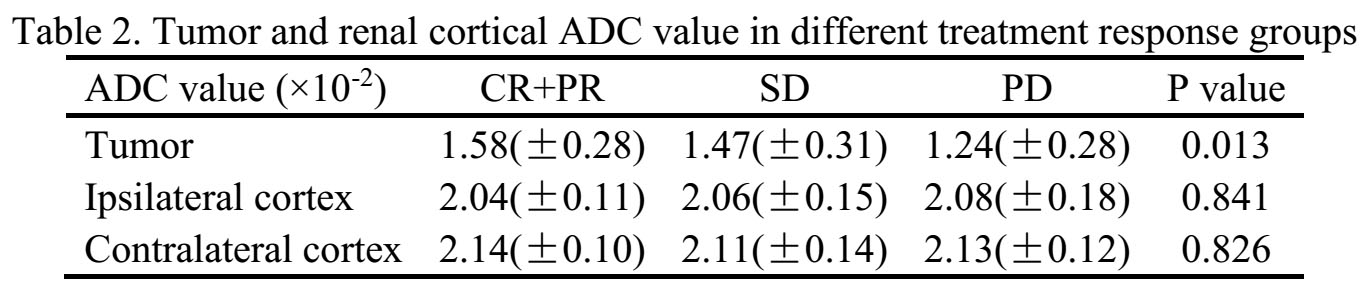
This study retrospectively included 55 stage IV clear cell renal cell carcinoma patients with pre-treatment MRI imaging, complete medical records and follow-up data. Patients with other malignant tumor were excluded. All these patients received first-line TKI therapy with (48 patients) or without (7 patients) surgery. According to therapy response, patients were divided into three groups: remission group(complete remission (CR) + partial remission (PR)) ; stable group(SD) and progression group(PD) using RECIST criteria. Clinical and pathological information including gender, age, surgery, TNM stage, number of metastatic sites and progression-free survival (PFS) were collected and compared among groups. All patients received pretreatment 3-T magnetic resonance imaging. ADC maps were generated from diffusion weighted imaging. Two radiologists independently draw the tumor’s ROI on DWI and ADC maps. The largest three cross-sections of the tumor were chosen while excluding the cross-section mostly consisted of cystic or necrotic portion. On these three largest cross-section ADC maps, three ROI including only the solid portion were drew and three ADC values were recorded by each radiologist. The average ADC value was recorded as tumor ADC value. Each radiologist also measured ADC value of ipsilateral renal cortex and contralateral renal cortex in the middle part of both kidneys.Results
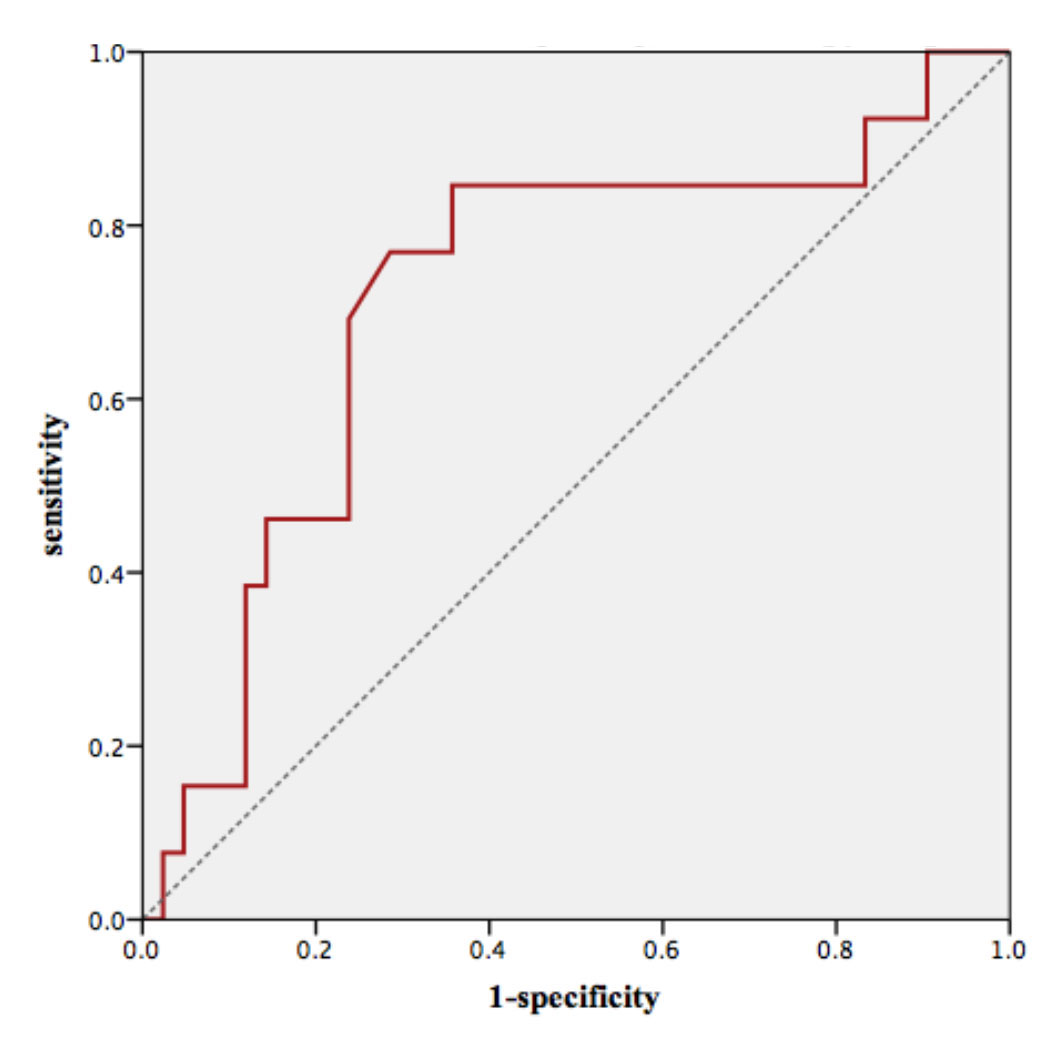
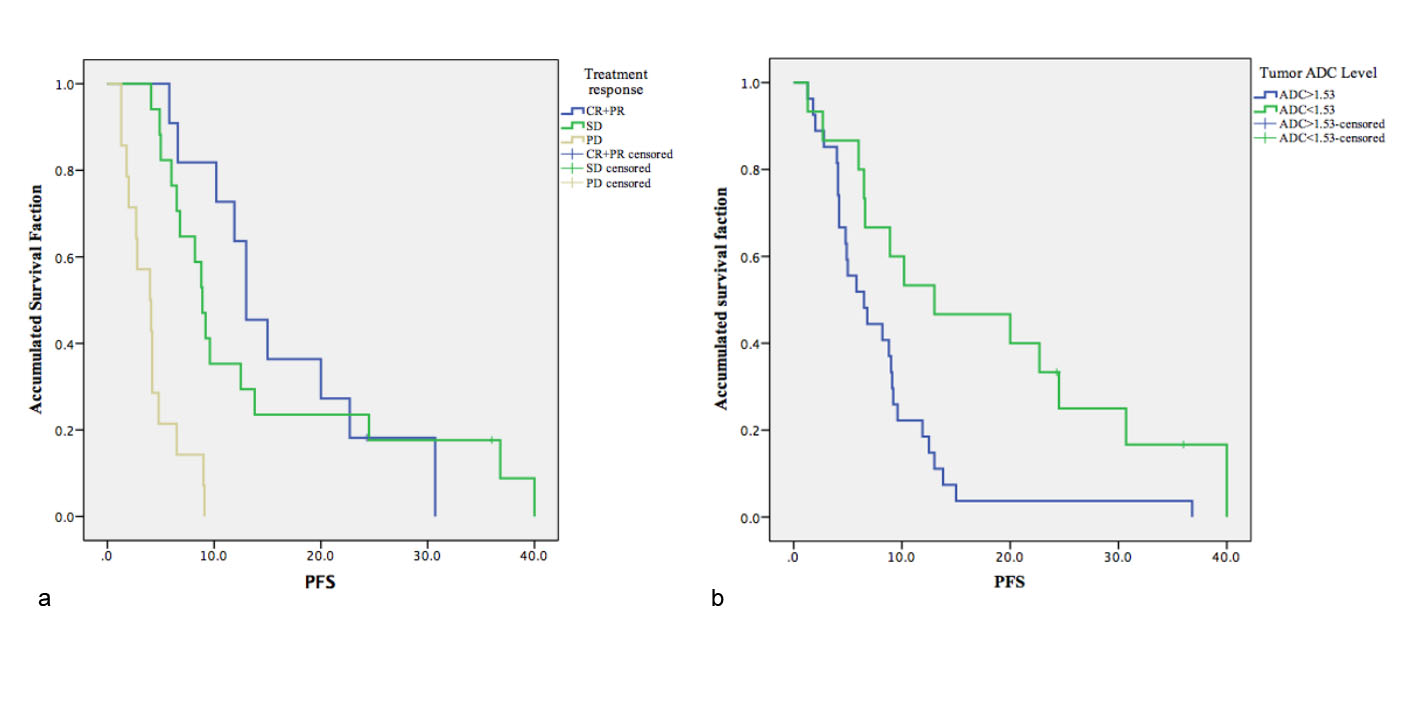
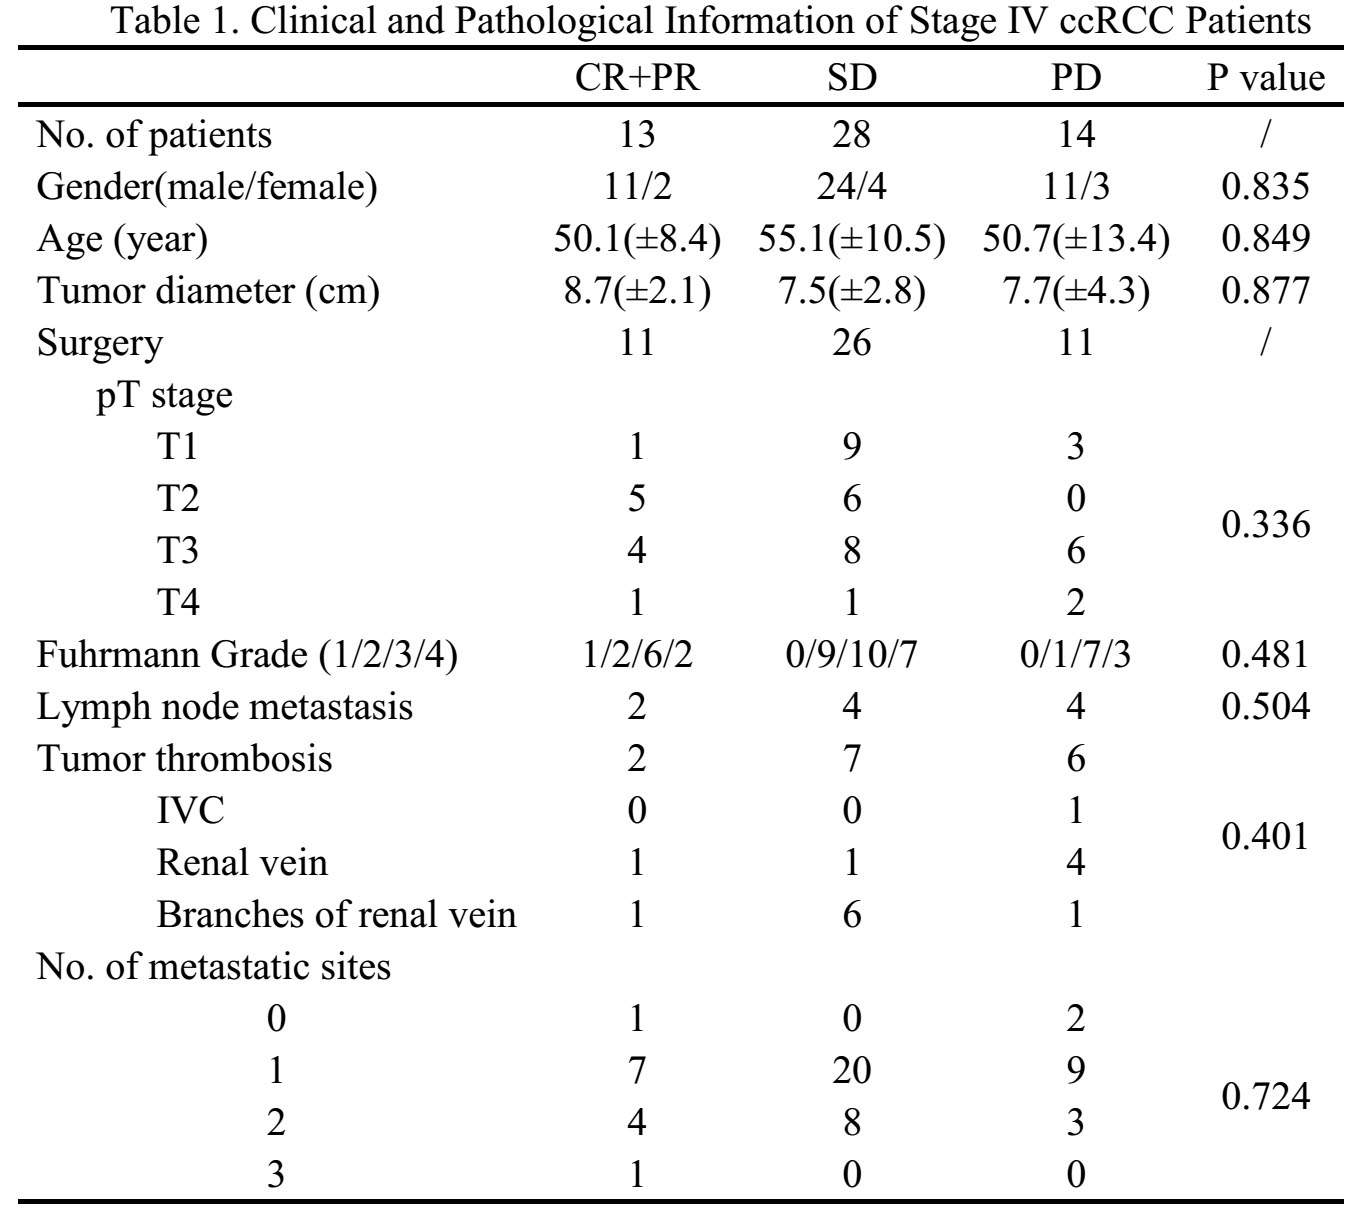
Among 55 patients, CR + PR group has 13 patients, while SD and PD group has 28 and 14 patients. The gender, age, tumor diameter, Fuhrmann grade, pT staging, lymph node metastasis, number of metastatic sites all had no significant differences among three groups. Tumor ADC value was 1.58(±0.28) ×10-2, 1.47(±0.31)×10-2 and 1.24(±0.28)×10-2 in CR+PR group, SD group and PD group, respectively (P=0.013). ROC curve was draw for tumor ADC value in predicting treatment response. The AUC was 0.72(0.55-0.88) with P value 0.007. When cut-off vale was 1.53×10⁻², the sensitivity and specificity was 69.2% and 76.2%. Accumulated survival faction curve was compared among three groups. 42 patients had complete follow-up data and were included in the survival analysis. The median PFS for CR+PR, SD and PD group was 13.0, 8.9 and 4.0 months (P=0.000). The clinical and pathological parameters and tumor ADC value was examined first in the uni-covariant Cox regression model. Only tumor ADC and lymph node metastasis has p value less than 0.10. Tumor ADC value and lymph node metastasis were examined by multi-covariant cox regression model. Only tumor ADC value has significant correlation with PFS (p=0.000, HR 0.134, 95%CI 0.043-0.413). Patients with higher level of ADC values had significantly longer PFS. Patients with ADC value>1.53×10⁻² had median PFS of 13.0 month, while patients with ADC value<1.53×10⁻² had median PFS of 6.5 month (p=0.007).Discussion
Tumor ADC value reflecting tumor activity has long been reported to correlate with tumor pathological prognostic factors, such as Fuhrmann grade. Previous large cohort of stage IV ccRCC only included clinical prognostic factors. But recent studies focused more on functional imaging. Some researchers reported that ADC value is an associative factor for recurrence after nephrectomy in localized renal cell carcinoma. Our study focused on stage IV ccRCC patients receiving targeted therapy and directly demonstrated the correlation of baseline tumor ADC value with targeted therapy response. The CR+PR group has the highest ADC value. The performance of tumor ADC value in predicting progression after first-line sunitinib therapy was moderate with sensitivity and specificity around 70%. While tumor ADC value significantly correlated with PFS. These results demonstrated the value of pretreatment functional imaging parameters in predicting renal cell carcinoma treatment response.Conclusion
Baseline tumor ADC value can be a potential predictor in assessing first-line sunitinib therapy response of stage IV clear cell renal cell carcinoma.Acknowledgements
We acknowlege the support and help from all our colleagues.References
[1] Ljungberg B, Bensalah K, Bex A, et al. Guidelines on Renal Cell Carcinoma. European Association of Urology, 2013, 1-56
[2] Wang X , Ng S , Faria M S , et al. Perfusion CT in patients with metastatic renal cell carcinoma treated with interferon.[J]. Ajr Am J Roentgenol, 2010, 194(1):166-171.
[3] Nishie A , Kakihara D , Asayama Y , et al. Apparent diffusion coefficient: An associative factor for recurrence after nephrectomy in localized renal cell carcinoma[J]. Journal of Magnetic Resonance Imaging, 2016, 43(1):166-172.
[4] Yoshida R , Yoshizako T , Hisatoshi A , et al. The additional utility of apparent diffusion coefficient values of clear-cell renal cell carcinoma for predicting metastasis during clinical staging[J]. Acta Radiologica Open, 2017, 6(1):205846011668717.
Figures