2326
A deep neural network based model for treatment response prediction using longitudinal diffusion MRI1Department of Radiological Sciences, University of California, Los Angeles, Los Angeles, CA, United States, 2Physics and Biology in Medicine IDP, University of California, Los Angeles, Los Angeles, CA, United States, 3Department of Radiation Oncology, University of California, Los Angeles, Los Angeles, CA, United States, 4Division of Surgical Oncology, Department of Surgery, University of California, Los Angeles, Los Angeles, CA, United States, 5Department of Orthopaedic Surgery, University of California, Los Angeles, Los Angeles, CA, United States, 6Department of Pathology, University of California, Los Angeles, Los Angeles, CA, United States, 7Radiation Oncology, Cedars-Sinai Medical Center, Los Angeles, CA, United States
Synopsis
A deep neural network based model was proposed to predict post-radiotherapy treatment effect score for localized soft tissue sarcoma patient using longitudinal diffusion MRI. Diffusion images were acquired three times throughout patient’s hypofractionated radiotherapy treatment. A convolutional neural network was constructed to learn the most useful spatial features from the tumor ADC maps at each time point, which is then fed into a recurrent neural network to exploit the temporal information between the extracted features. Excellent prediction performance of 97.4% accuracy on slice-based classification, and 95% accuracy on patient-based classification were achieved on independent test sets.
Introduction
Diffusion MRI has been shown to be a vital tool for evaluating and predicting treatment response for soft tissue sarcoma patient, and is potentially more sensitive and predictive than anatomical T1-weighted and T2-weighted imaging, and dynamic contrast-enhanced T1-weighted imaging (DCE)1–6. However, the majority of previous studies lean heavily on simple correlations between mean ADC or minimum ADC and patient outcome using one or two time points. In addition, only pre-treatment and/or post-treatment imaging was acquired, while the optimal number and frequency of imaging time point to capture treatment response remain unknown. Therefore, in this study, we sought to utilize longitudinal diffusion MRI and build a deep neural network for treatment response prediction on patients with localized soft tissue sarcoma.Methods
Patients enrolled in a phase II clinical trial of hypofractionated radiation therapy (RT) for soft tissue sarcomas were recruited to this prospective longitudinal MRI study. Enrolled patients received 30Gy delivered daily in 5 fractions with no concurrent chemotherapy. A treatment effect score (TE) ranging from 0 to 100% was obtained from post-RT surgery as a surrogate of patient treatment response. This treatment effect refers to the degree of necrosis, hyalinization/fibrosis, and cellularity relative to the baseline biopsy. Based on the treatment effect, patients were divided into three groups: Group 1: TE ≤20%, Group 2: 20%< TE <90%, Group 3: TE ≥90%.
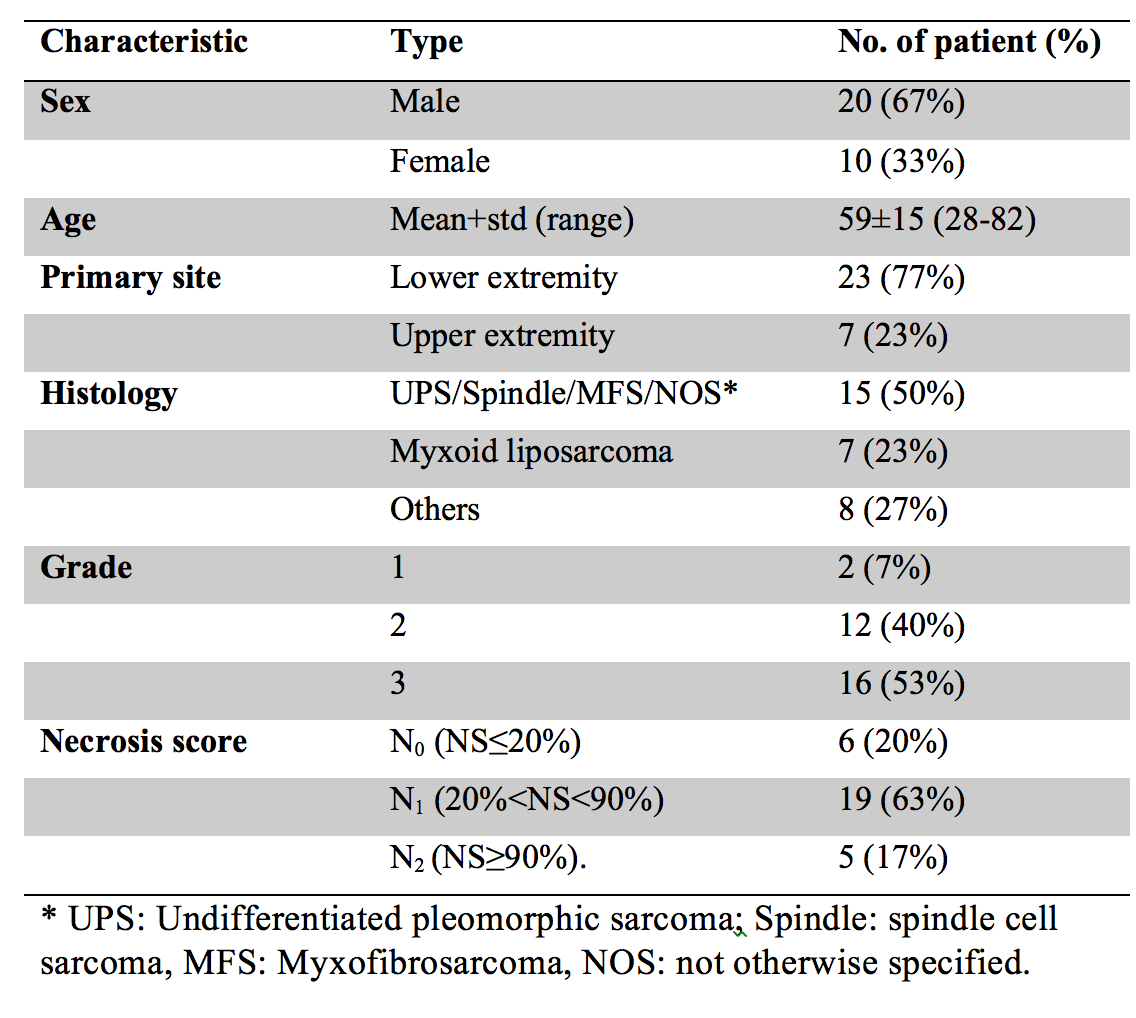
A total of 30 patients were consented for the imaging study and had a complete imaging and pathology dataset for analysis. Table 1 shows the patient characteristics. For each patient, diffusion images were acquired three times throughout the RT course using a 0.35T MR-guided radiotherapy machine (ViewRay, MRIdian, Mountain View, CA): before the first fraction (T1); immediately before or after the third fraction (T2); and immediately after the final treatment (T3). Gross tumor region was manually contoured on the diffusion-weighted images by a radiation oncologist and transformed to the ADC maps.
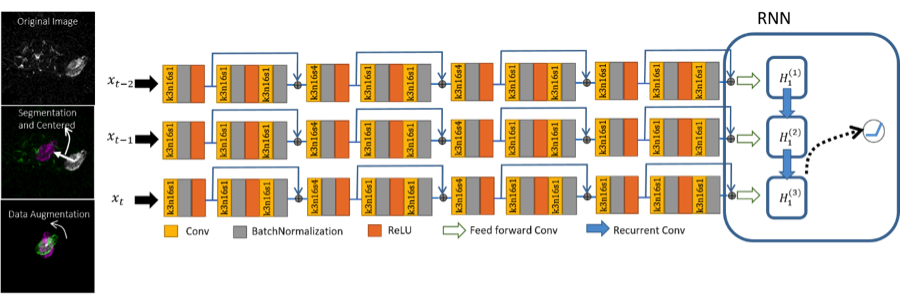
Data augmentation was performed to improve the model robustness against rotation. 1-180 degree of rotation was applied to the tumor ADC after the tumor centroid was centered. As shown in Figure 1, the network consists of feature extraction part to learn the most useful spatial features and recurrent part to exploit the temporal information between the extracted features. In the feature extraction part, image of each tumor slice from each time point was fed into a convolutional neural network (CNN) separately. The extracted features from each time point were then imported into a recurrent neural network (RNN) sequentially to take advantage of the temporal information. A single neuron with the ReLU nonlinearity was added on top of the last cell of RNN to classify the current slice into any of the aforementioned group.
Among the 30 patients, 26 patients were used for training and validation, and the remaining 4 patients that were unseen during the training process were used as an independent test set to evaluate the prediction performance. This whole process was repeated for five times with different train/test splitting to show the reliability of the model for different train/test splitting strategies. All test sets were used together to report the model performance. Two results were reported: 1) slice-based: the prediction performance was calculated based on the individual slice, and 2) patient-based: the classification performance was evaluated based on individual patient, where the majority score of all slices was used for each patient.
Results and Discussion
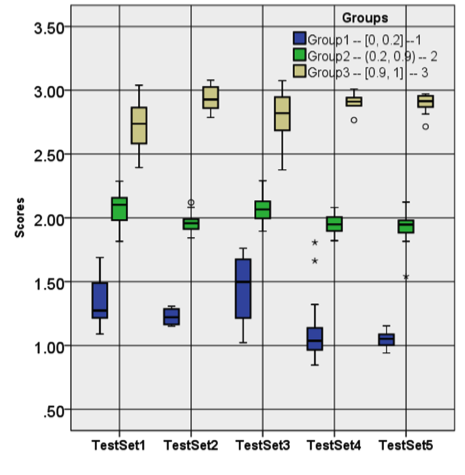
Figure 2 shows the classification results for different train/test splitting. The model is able to predict the scores correctly with only one exception in the third test set, where there is uncertainty for the patient that belongs to group 1.
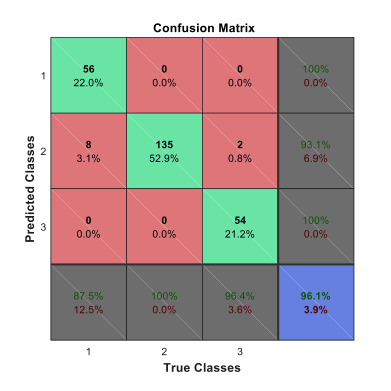
Figure 3 shows the confusion matrix for the slice-based classification. The sensitivity, specificity, and accuracy were 87.5%, 100% and 96.8% for group 1, 100%, 91.7%, and 96.1% for group 2, and 96.4%, 100%, 99.2% for group 3. The overall sensitivity, specificity, and accuracy were 94.6%, 97.2%, and 97.4%.
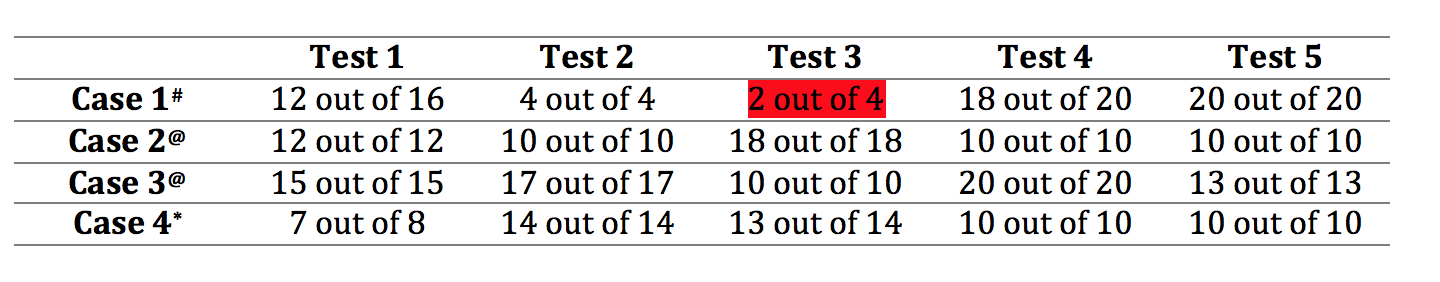
Table 2 shows the patient based classification performance. The model accurately predicted the treatment effect for all patients with good confident level except for one patient who had only 2 out 4 slices classified correctly. The model accuracy was 95% (19 out of 20).
Conclusion
In conclusion, a deep neural network based model was built to predict the post-RT treatment effect on localized soft tissue sarcoma. Excellent prediction performance with 97.4% accuracy on slice-based classification and 95% accuracy on patient-based classification was achieved on independent test sets. Even though overall accuracy is very promising, more data is required to achieve a practical and reliable classifier.Acknowledgements
No acknowledgement found.References
1. Soldatos T, Ahlawat S, Montgomery E, Chalian M, Jacobs MA, Fayad LM. Multiparametric Assessment of Treatment Response in High-Grade Soft-Tissue Sarcomas with Anatomic and Functional MR Imaging Sequences. Radiology. 2016;278(3):831-840. doi:10.1148/radiol.2015142463
2. Dudeck O, Zeile M, Pink D, et al. Diffusion-weighted magnetic resonance imaging allows monitoring of anticancer treatment effects in patients with soft-tissue sarcomas. J Magn Reson Imaging JMRI. 2008;27(5):1109-1113. doi:10.1002/jmri.21358
3. Yoshida S, Koga F, Kawakami S, et al. Initial experience of diffusion-weighted magnetic resonance imaging to assess therapeutic response to induction chemoradiotherapy against muscle-invasive bladder cancer. Urology. 2010;75(2):387-391. doi:10.1016/j.urology.2009.06.111
4. Schnapauff D, Zeile M, Niederhagen MB, et al. Diffusion-weighted echo-planar magnetic resonance imaging for the assessment of tumor cellularity in patients with soft-tissue sarcomas. J Magn Reson Imaging. 2009;29(6):1355-1359. doi:10.1002/jmri.21755
5. Uhl M, Saueressig U, van Buiren M, et al. Osteosarcoma: preliminary results of in vivo assessment of tumor necrosis after chemotherapy with diffusion- and perfusion-weighted magnetic resonance imaging. Invest Radiol. 2006;41(8):618-623. doi:10.1097/01.rli.0000225398.17315.68
6. Oka K, Yakushiji T, Sato H, Hirai T, Yamashita Y, Mizuta H. The value of diffusion-weighted imaging for monitoring the chemotherapeutic response of osteosarcoma: a comparison between average apparent diffusion coefficient and minimum apparent diffusion coefficient. Skeletal Radiol. 2010;39(2):141-146. doi:10.1007/s00256-009-0830-7
Figures