2321
Lactate chemical exchange saturation transfer MRI as a biomarker for differentiating lactate dehydrogenase activity in 9L and F98 glioma1Radiology, University of Pennsylvania, Philadelphia, PA, United States, 2Research Branch, Sidra Medicine, Doha, Qatar, 3Laboratory Animal research Center, Qatar University, Doha, Qatar
Synopsis
Lactate chemical exchange saturation transfer (LATEST) MRI method has been shown to be applicable in detecting and imaging changes in the lactate level in human subjects post heavy exercise and to measure the lactate in a mouse model of lymphoma. In this study, LATEST was implemented to differentiate the lactate dehydrogenase (LDH) activity in vivo in two different preclinical glioma models. The two gliomas studied are widely used 9L (highly immunogenic, gliosarcoma) and F98 (weakly immunogenic, glioblastoma). The LATEST contrast was found to be higher in the tumor region of F98 rats compared to the 9L glioma carrying rats.
Introduction
Cancer cells usually reprogram the cellular metabolism to meet the energy demand. Most cancers heavily rely on glycolysis for energy production and proliferation1,2. The highly aggressive or metastatic cancers may require higher energy compared to benign or slow-growing tumors. An end result of glycolysis is lactate, which is formed by the reaction catalyzed by lactate dehydrogenase (LDH). The level of lactate present in the tumor is often affected by the LDH activity and may be implicated in disease progression and clinical outcome. Recently, Lactate CEST imaging (LATEST) method has been used to probe changes in the lactate level in human subjects post heavy exercise and to measure the lactate in a mouse model of lymphoma3. 9L and F98, phenotypically different glioma cell lines, are most widely studied in preclinical studies4. 9L presents itself as gliosarcoma, with circumscribed boundaries and relatively higher immunogenicity, F98 closely mimics human glioblastoma, is highly infiltrative and has weak immunogenicity4. In this study, LATEST was implemented to probe the LDH activity in vivo in two immunogenically different rat glioma models.Methods
Syngeneic female Fisher F344/NCR rats were used to generate a glioma model as described previously5. Briefly, anesthetized rats (n=6) were intracranially injected with 50,000 F98 (n=3) and 9L (n=3) cells to generate the glioma models. MRI experiments were performed at 9.4T MRI scanner (Agilent, USA) on all the rats 3 weeks after the tumor cell administration. During the MRI scans, rats were maintained under 1-1.5% isoflurane in O2, supplied at 1L/min. During the course of the experiment, the body temperature was maintained at 37ºC. T2 weighted imaging was performed for the axial sections of the brain to locate the tumor region and to choose the slice for CEST imaging. The LATEST sequence parameters were: slice thickness=2mm, GRE flip angle=10º, GRE readout TR=5.6 ms, TE=2.7 ms, FOV=30×30 mm2, matrix size=128×128, number of averages=4. LATEST images from 0 to ±1.6 ppm (step size 0.2 ppm) were collected at 1.17 µT saturation pulse power (B1) and saturation duration of 4 seconds. B0 correction on the LATEST images was performed by acquiring Water Saturation Shift Referencing (WASSR)6 images at 0.24 μT from -1 to +1 ppm in steps of 0.1 ppm. LATEST maps were computed using the equation CESTasym (%) = 100×[(S-ve – S+ve)/S0], where S-ve and S+ve are the B0 corrected MR signals acquired while saturating at –0.5 ppm and +0.5 ppm from water resonance, while S0 is the image obtained with the application of saturation pulse at 20 ppm. B1 maps were calculated from two images acquired using square preparation pulses with flip angles 30° and 60° (pulse duration=65 μs, averages=2) followed by a spoiled gradient echo. A flip angle map was generated, and a linear correction for B1 was calculated as a ratio of the actual B1 to the expected value. The LATEST contrast map was further corrected for any B1 inhomogeneity. For immunohistochemistry studies, following the MRI experiments, rats were perfused with saline and paraformaldehyde followed by harvesting of the brain for getting 10μm thick slices containing the glioma. The immunohistochemical analysis was performed for both 9L and F98 gliomas to measure the LDH activity using Anti-LDH-A antibody (Abcam, USA).Results and Discussion
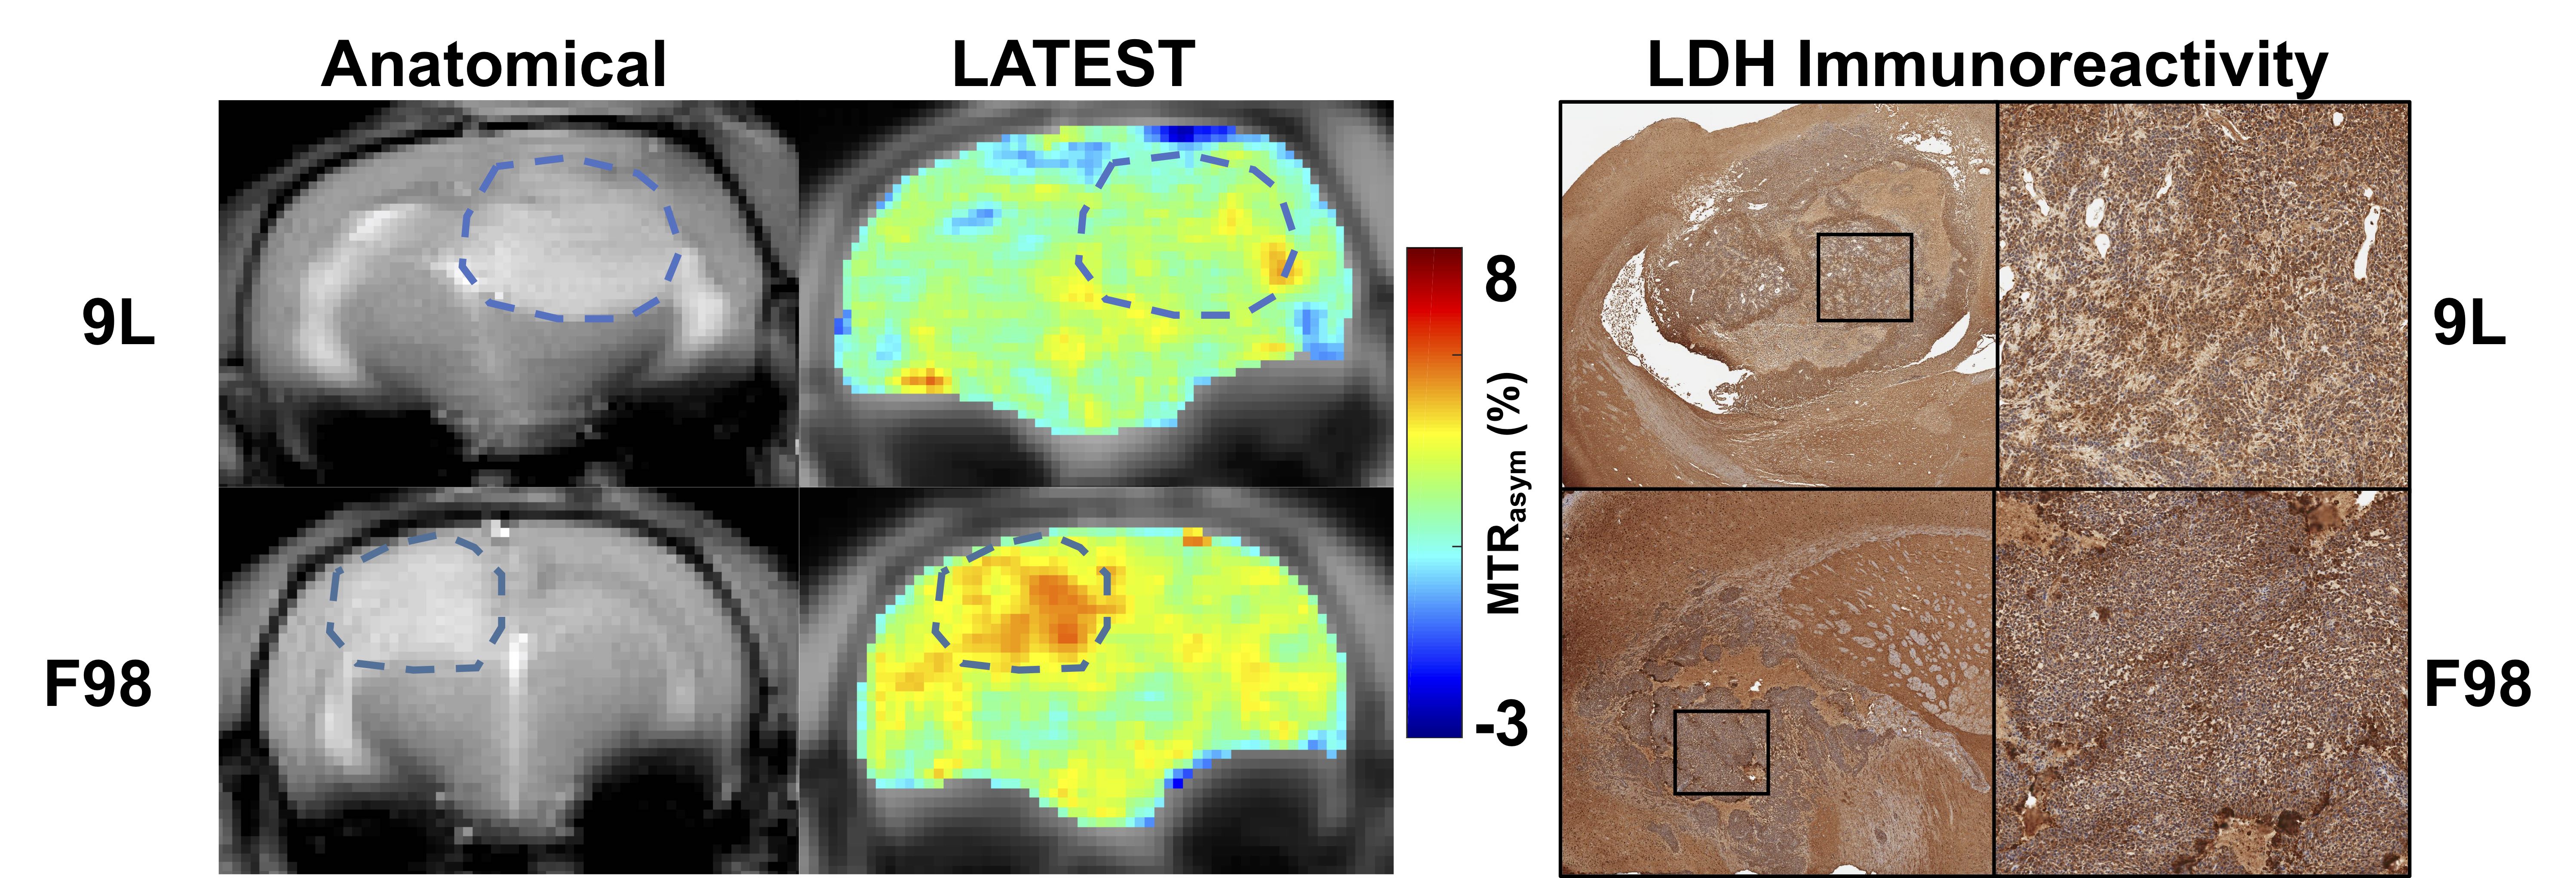
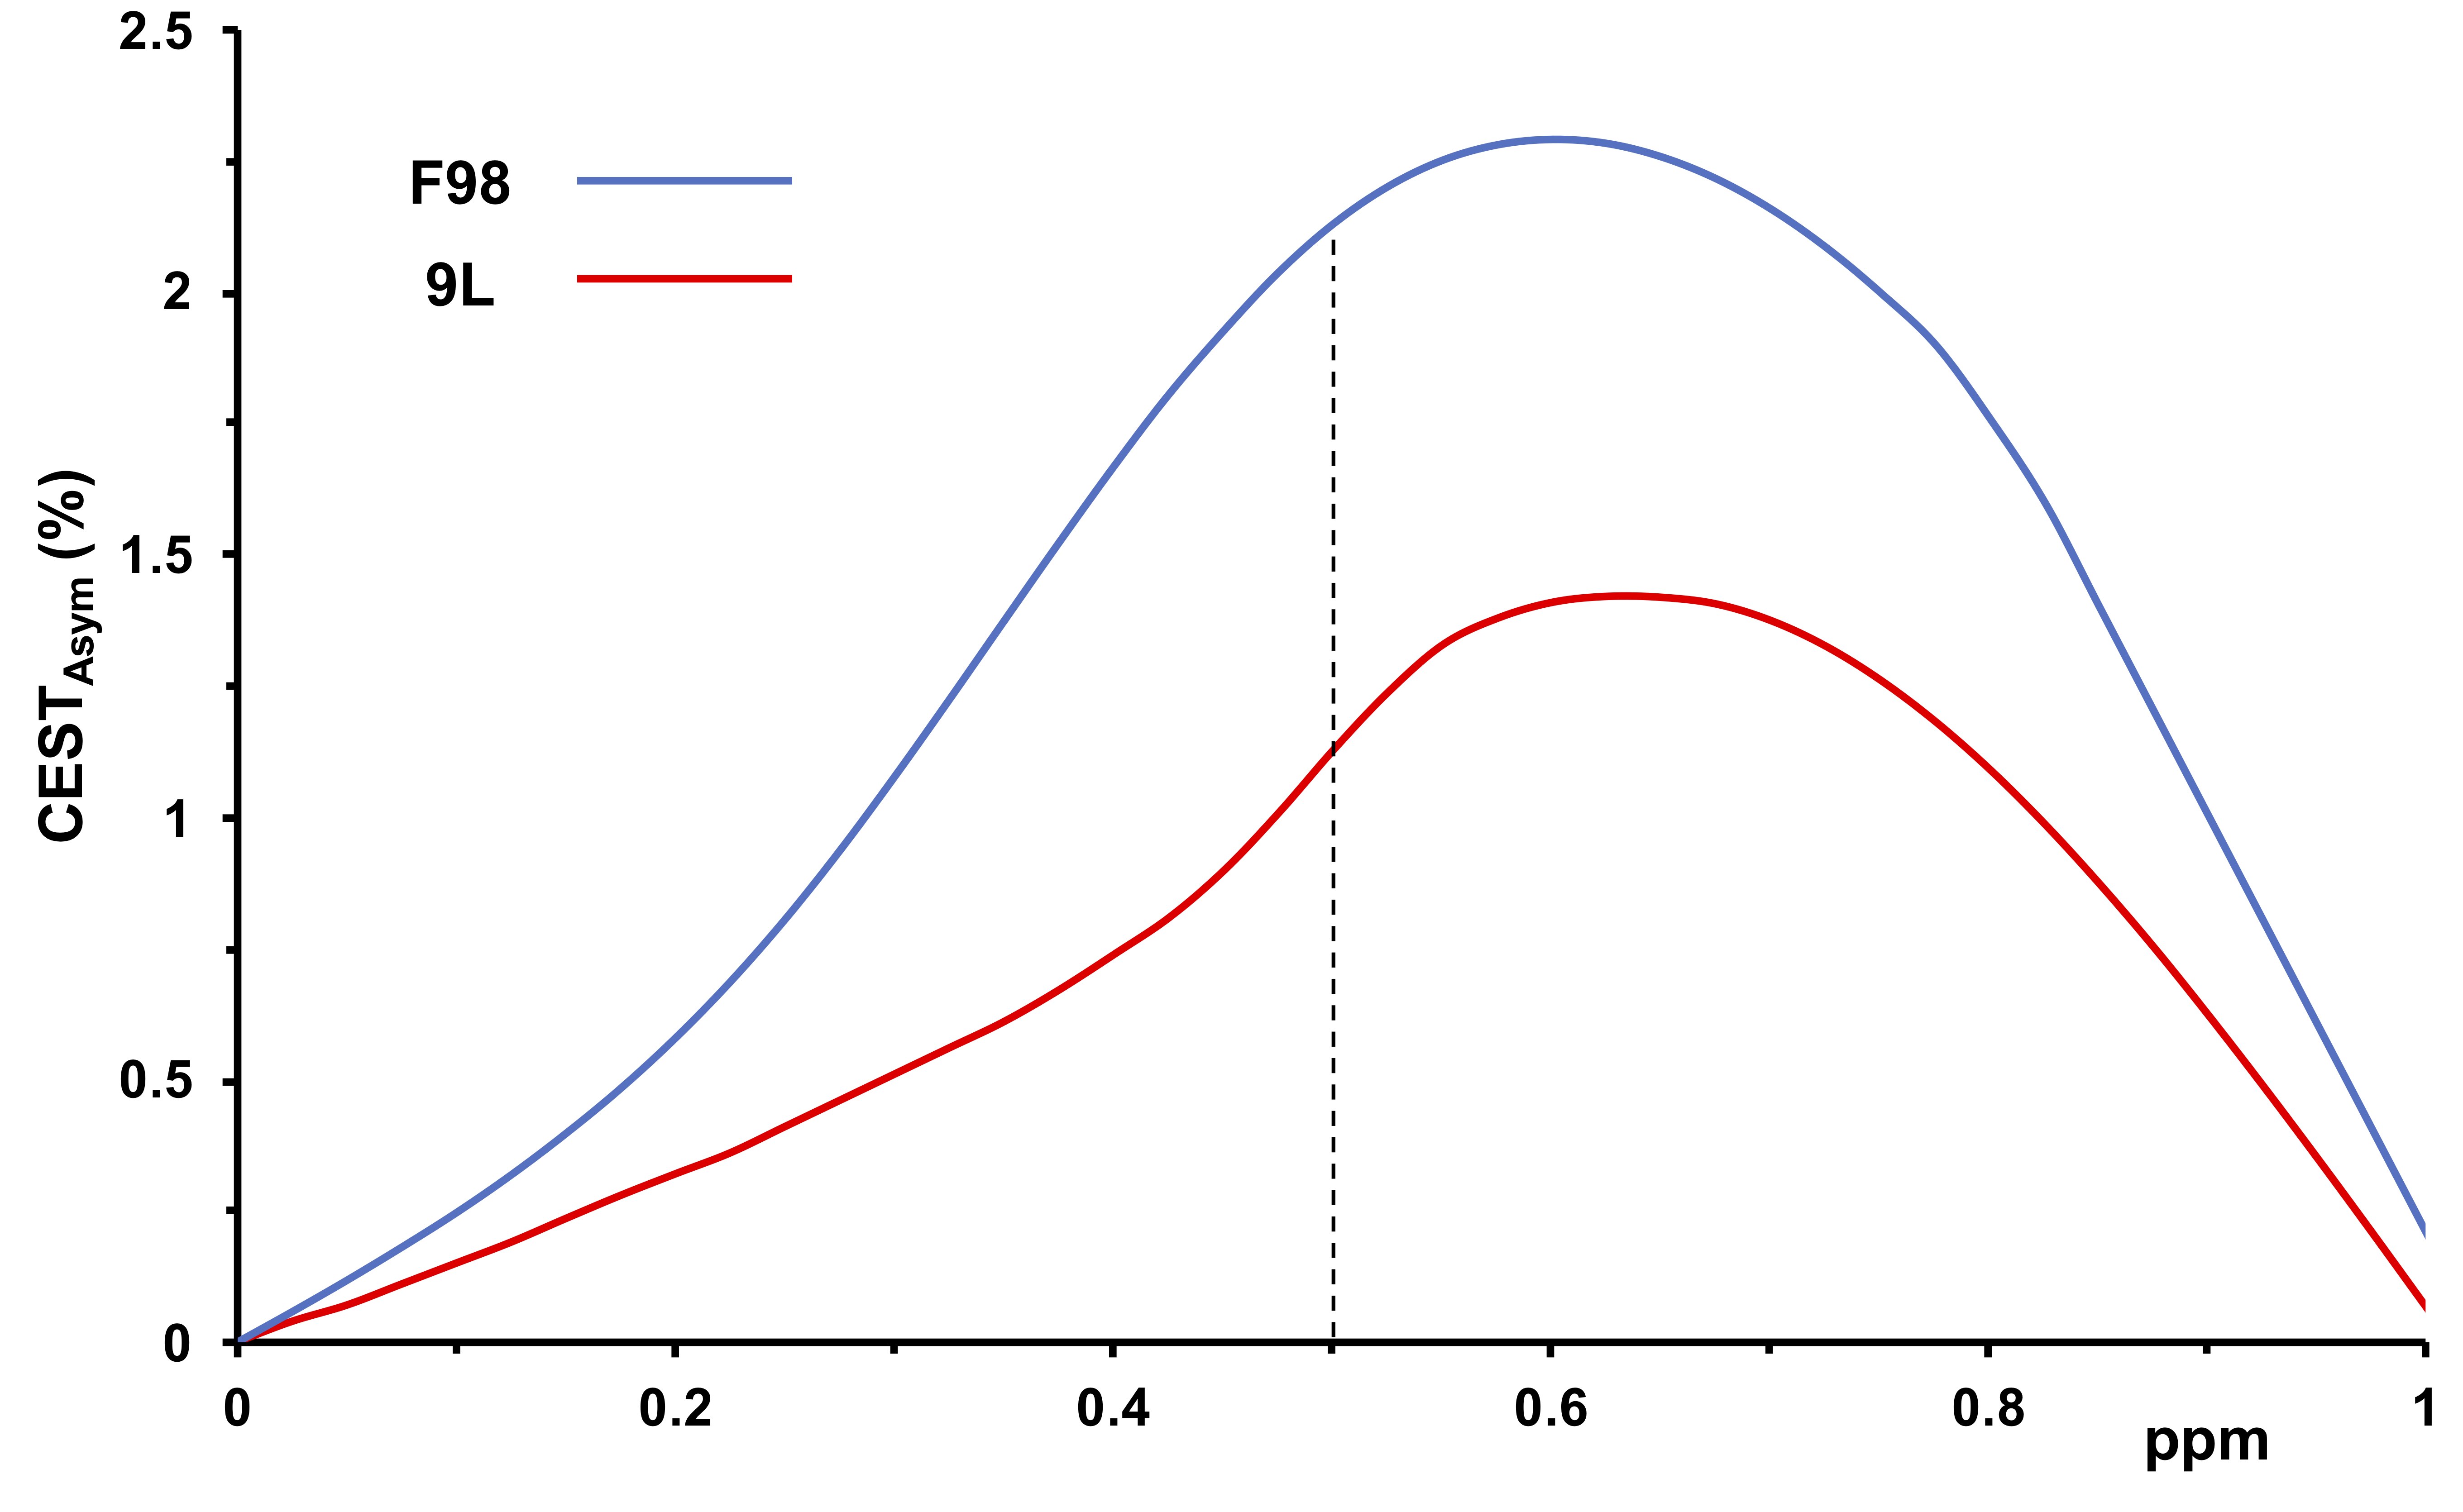
Figure 1 shows the representative anatomical image of the axial slices containing the 9L and F98 gliomas in rat brains. The LATEST map from the tumor region clearly depicts higher LATEST contrast (~2.5%) in the F98 glioma compared to the 9L glioma (~1.5%). The right panel shows a higher magnification image of the glioma depicting higher LDH-A activity in the F98 glioma compared to 9L. The LDH immunohistochemistry data clearly suggests higher LDH activity in the F98 glioma (Figure 1). Average asymmetry plots from the tumor region (Figure 2) also show higher asymmetry at 0.5 ppm downfield of water pointing toward higher lactate in the F98 glioma. In addition to lactate, m-inositol, glucose and several other metabolites containing hydroxyl protons also exhibit CEST effect close to water (0-1.5 ppm)7,8,9, the contribution of these metabolites to LATEST signal is being evaluated. The studies such as 1HMRS of the tumor including Hadamard voxel selected, selective multiple quantum coherence, chemical shift spectroscopy sequence is currently being performed to further confirm the presence of higher lactate and LDH activity in the F98 gliomas3,10. The findings suggest that the LDH activity in the gliomas can be mapped using the LATEST method. Since the LDH activity is associated with the tumor malignancy the LATEST method may be used as in vivo biomarker of tumor malignancy. The technique can be further explored to monitor the efficacy of various drugs that inhibit LDH enzyme activity.Acknowledgements
This project was supported by the National Institute of Biomedical Imaging and Bioengineering of the National Institutes of Health through Grant Number P41-EB015893 and the National Institute of Neurological Disorders and Stroke through Award Number R01NS087516.References
1. Warburg O Biochem Z (1920) 103:188-217
2. Heiden MGV et al Science (2009) 324:1029-33
2. Bai P and Canto C (2012) Cell Metab 16:290-95
3. DeBrosse C et al (2016) Sci Rep 6:19517
4. Barth RF and Kaur B (2009) J Neuro-Oncology 94:299-312
5. Kim S et al (2008) NMR Biomed 21:208-16
6. Kim M et al (2009) Magn Res Med 61:1441-50
7. Haris M et al (2011) Neuroimage 54:2079-85
8. Walker-Samuel S et al (2013) Nature Med 19:1067-72
9. Chan KW et al (2012) Magn Res Med 68:1764-73
10. Mellon EA et al (2009) Magn Res Med 62:1404-13
Figures