2317
Correlation of Multiparametric MRI with extracellular pH mapping in a Rabbit Model for Liver Cancer1Yale University, New London, CT, United States
Synopsis
Hepatocellular Carcinoma (HCC) was studied using multiparametric MRI in a rabbit liver tumor model, comparing native T1 and T2* mapping, ADC, and dynamic contrast enhanced parameters, with extracellular pH maps. Tumor heterogeneity was well characterized by parametric mapping.
Purpose
Hepatocellular Carcinoma (HCC) is currently detected using dynamic contrast enhanced (DCE) MRI to visualize tumors which are primarily supplied by the hepatic artery, in contrast to normal liver which is mainly perfused from the portal vein. Other MR features of liver tumors have been less well explored, and may indicate more about the tumor microenvironment. We studied multiparametric mapping of a rabbit liver tumor model, comparing T1, T2*, and DCE parameters, to a novel MRI assesment of extracellular pH (1), with low pH implicated in tumor aggression (2).Methods
Nine New Zealand white rabbits were surgically implanted with VX2 tumors in the liver as previously established by our co-investigators (3), with growth for two weeks after implantation. All imaging was performed on a 3.T Prisma scanner (Siemens, Erlangen, Germany) in a 16 channel Knee coil, prior to any therapeutic intervention. Extracellular acidity (pHe) was measured using the BIRDs technique, which calibrates pHe to chemical shifts of complexes between paramagnetic lanthanide ions (1). Respiratory gating was employed, if feasible, in each MRI sequence. DWI was performed (4) using 80 mT/m gradients, 3 b-values, 50 s/mm2, 400 s/mm2 and 800 s/mm2, in 3 orthogonal directions. The scan was a 2D EPI single shot sequence using SPAIR for fat sat, FOV of 200 x 160 mm, and partial Fourier factor 6/8, GRAPPA factor 2, and a matrix of 112, TR/TE/θ=2.6s/42ms/90°, 2.1 x 2.1 x 2.5 mm3 with 20 slices covering the liver, and averaging (N=5-8). 3D T1 mapping was performed prior to DCE, using 3D GRE, with a 5, 8, 12,15° flip angles, with B1-mapping for correction of flip angles, and offline fitting in Matlab (5). Scan parameters were: resolution: 0.5 x 0.5 x 2.5mm, 200mm x 120 mm FOV, 192 x 100 matrix. DCE was performed during an injection of 0.1mmol/kg of Gd-DTPA, using a 3D VIBE sequence with CAIPIRINHA parallel imaging factor of 2 in both ky and kz (6). Scan parameters were: TR/TE/θ= 3.4ms/1.3ms/9°, 0.5 x 0.5 x 2.5mm, 200mm x 120 mm FOV, 192 x 100 matrix, partial Fourier factor 6/8, 32 slices, fat suppression with SPAIR. The frame time was 2-3 s per volume. The DCE data was analyzed by estimating concentration curves for arterial blood, portal venous blood, and liver and tumor regions, and fitting to obtain Ktrans and Ve. T2* mapping was performed with 2D GRE multi-echo sequence with 12 TEs, with initial TE= 3.05ms, and ΔTE= 3ms, and θ/TR=25°/30ms, with 1 x 1 x 2.5mm3 resolution. T2* was measured by curve-fitting in Matlab.Results
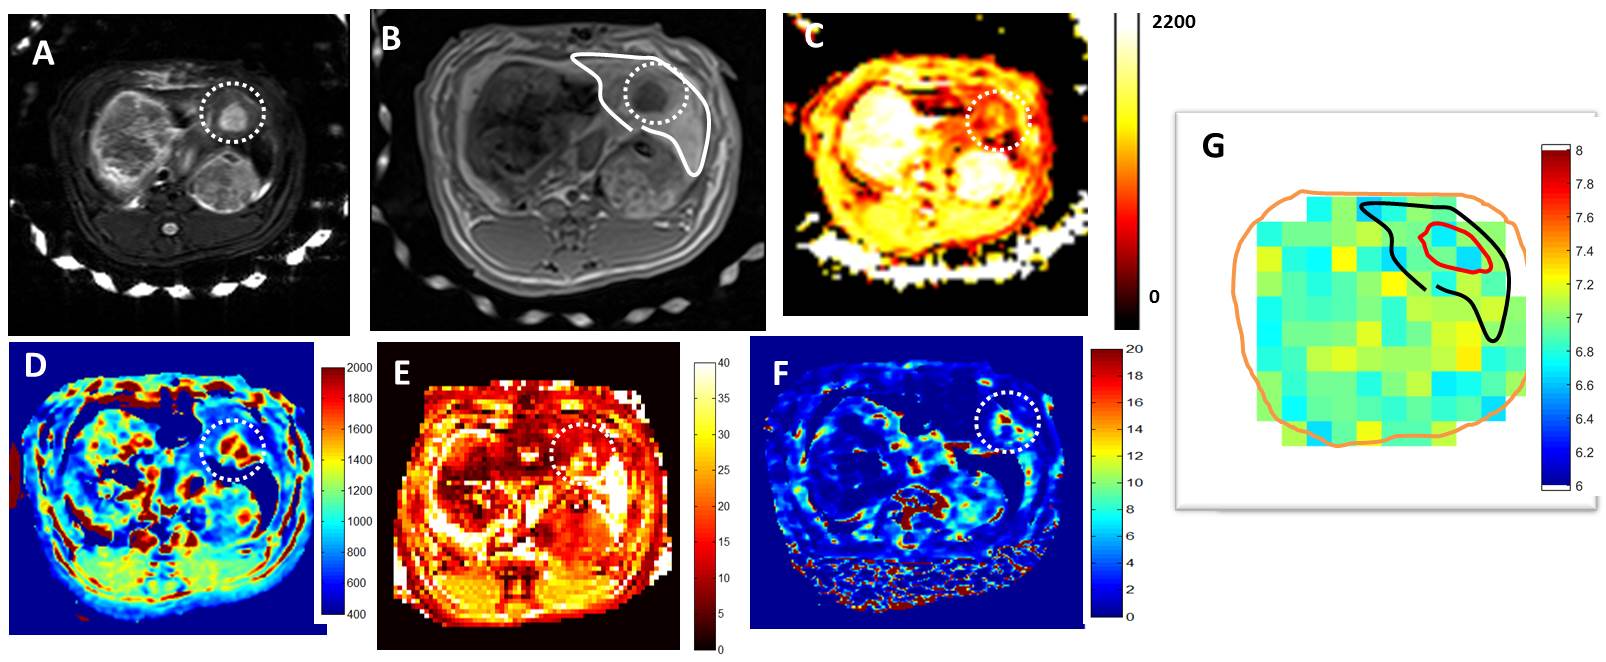
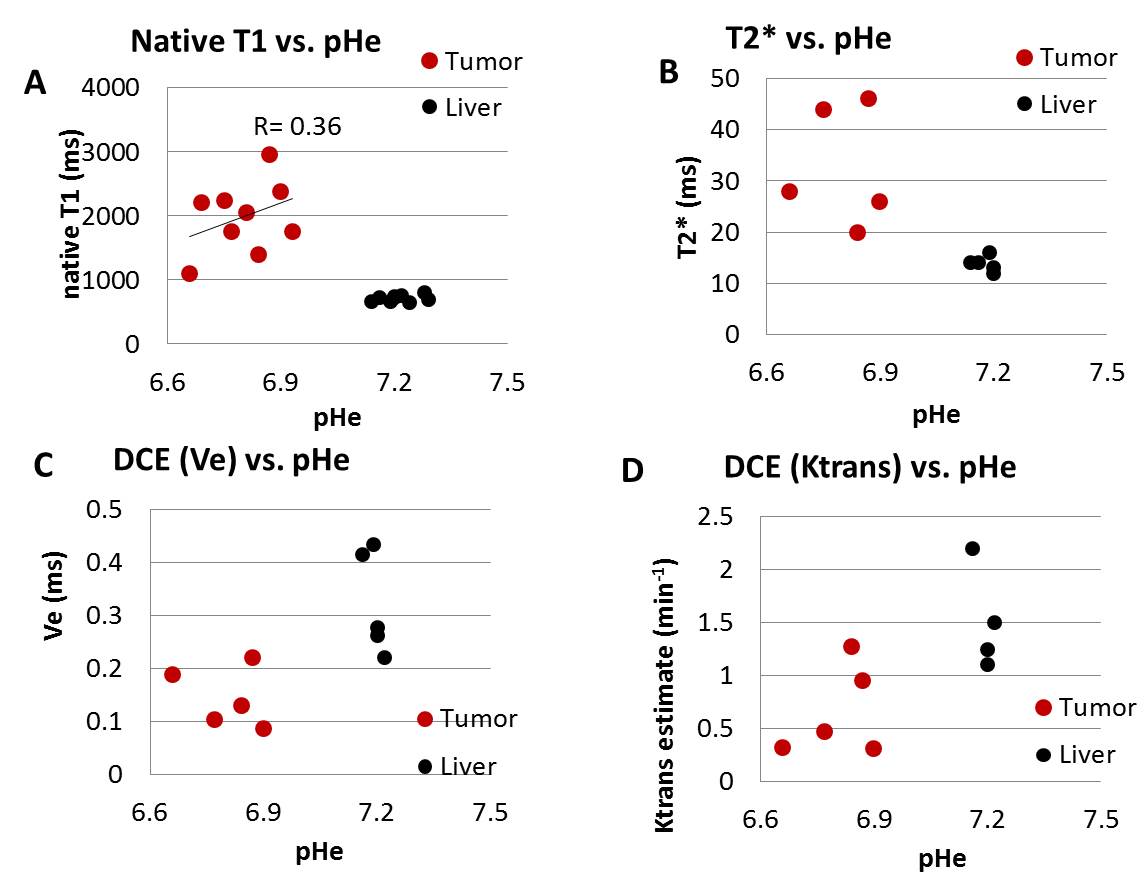
Figure 1 shows multiparametric mapping in a rabbit with a large untreated liver tumor. The tumor exhibits heterogeneity, which is reflected in each quantitative map. The pHe map also shows the tumor as a region of more acidity. Figure 2 shows correlations between T1, T2*, pHe, and DCE parameters (ktrans, and ve). The average T2* in the liver and necrotic tumor were 13 ±2 and 35 ±12ms, averaged over all rabbits. The average T1 was 708 ± 54ms, 1980 ± 600ms in the liver and the necrotic tumor core. The Ktrans was measured to be 1.5 ± 0.5 min-1 and 0.7 ± 0.4 min-1 for liver and tumor. The extravascular extracellular space ve was measured to be 35% ± 10% and 16 ± 6% for liver and tumor. ADC (10-6 mm2/s) was measured to be 1120 ± 87 in normal liver, 1160 ± 94 in tumors, with some tumors having regions of low ADC (882± 94). Native T1 correlated weakly with pHe values in tumors, with a shorter T1 found in more acidic tumors, potentially reflecting a more viable tumor. T2*, Ktrans, and ve were not correlated with acidity.Discussion and Conclusion
This preliminary study shows that parametric mapping can depict the highly heterogeneous tumor morphology, showing an elevated liver T1 in regions of tumor and necrosis, elevated T2*, and unique DCE parameters. These parameters were not correlated with tumor pHe, except for native T1.Acknowledgements
This work was supported by NIH (R01 CA206180, R01 EB-023366, P30 NS-052519), by the Society of Interventional Oncology Research Grant and Visage Imaging, Inc.References
1. Coman D, Trubel HK, Hyder F: Brain temperature by Biosensor Imaging of Redundant Deviation in Shifts (BIRDS): comparison between TmDOTP5- and TmDOTMA. NMR Biomed 2010, 23:277-285.
2. Hanahan D, Weinberg RA. Hallmarks of cancer: the next generation. Cell. 2011;144(5):646-74.
3. Tacher V et al. Multimodality Imaging of Ethiodized Oil-loaded Radiopaque Microspheres during Transarterial Embolization of Rabbits with VX2 Liver Tumors. Radiology. 2016;279(3):741-53.
4. Wu H et al. Diffusion weighted multiparametric MRI. JMRI, 44 (2016) p. 708f
5. Cheng HL, Wright GA. Rapid high-resolution T(1) mapping by variable flip angles: accurate and precise measurements in the presence of radiofrequency field inhomogeneity. Magn Reson Med. 2006 Mar;55(3):566-74.
6. Budjan J et al. CAIPIRINHA-Dixon-TWIST (CDT)-volume interpolated breath hold examination (VIBE) for dynamic liver imaging. Eur J. Radiology, 83 (2014) p. 2007ff
Figures