2315
Quantification of Cerebral Blood Flow using arterial spin labeling in glioblastoma multiforme; challenges of calibration in the presence of oedema.1Institute of Biomedical Engineering, University of Oxford, Oxford, United Kingdom, 2Wellcome Centre for Integrative Neuroscience, University of Oxford, Oxford, United Kingdom, 3Department of Oncology, University of Oxford, Oxford, United Kingdom, 4Oxford University Hospitals NHS Trust, Oxford, United Kingdom, 5Nuffield Department of Clinical Neuroscience, University of Oxford, Oxford, United Kingdom, 6Oxford Institute for Radiation Oncology, University of Oxford, Oxford, United Kingdom
Synopsis
Arterial spin labeling (ASL) offers a non-invasive and repeatable method for quantifying CBF, a promising biomarker in cancer imaging. However, the consensus for voxelwise calibration may not be appropriate for application in tumours. We hypothesise that voxelwise calibration in the presence of oedema will decrease sensitivity to alterations in CBF, and test this by measuring CBF with pseudocontinurous ASL in seven patients with glioblastoma multiforme, comparing the impact of voxelwise, white matter, and CSF calibration on tumour CBF. Calibration choice significantly affects absolute CBF; with a loss of CBF contrast in tumours when using voxelwise calibration, which may have clinical implication.
Introduction
A recognised barrier to the clinical uptake of arterial spin labeling (ASL) MRI is the myriad of acquisition and analysis techniques available. The ‘ASL white paper’ has been instrumental in reaching a consensus for both acquisition and analysis in the clinical setting1. However, as ASL continues to gain clinical traction, particularly within cancer imaging2-4, it is important to question whether the current recommended analysis pipeline is appropriate in patients with gross pathology. Here we assess the impact of calibration method in patients with glioblastoma multiforme (GBM); hypothesising that voxelwise calibration, as proposed in the white paper1, may confound results in the presence of oedema.Methods
Seven patients (4M/3F, 59.7±12.6 years) with primary occurrence of GBM were imaged at 3T (Siemens TimTrio) prior to surgical resection, as part of the ongoing IMAGO trial, with approval from South Central Oxford A Research Ethics Committee (REC: 17/SC/0304).
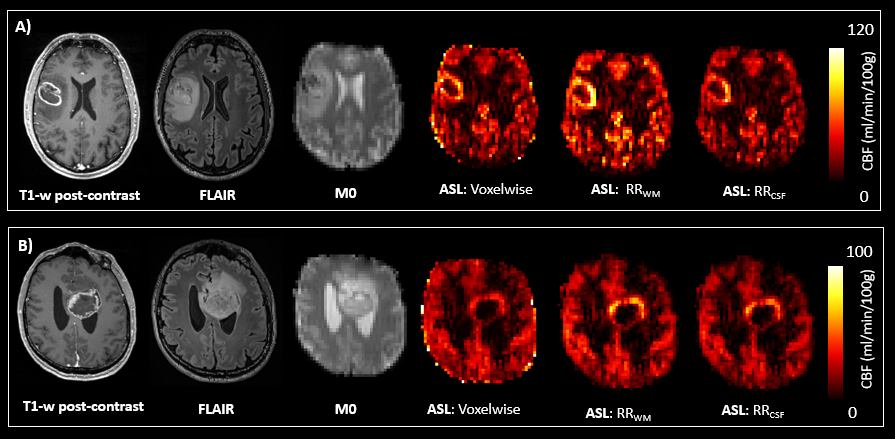
Acquisition: Whole-head T1-weighted MPRAGE with/without Gadolinium (Gd-HP-DO3A, ProhanceTM) (TR/TE=1900/3.17ms, 0.7×0.7×1mm), and T2-weighted FLAIR (TR/TE=5000/495ms, 1.0×1.0×1.0mm) were acquired for tumour visualisation, and PCASL MRI (5 PLD:400-2000ms, TR/TE=5484/14ms, 26 slices, 3.4×3.4×5mm) for CBF imaging, including a calibration (M0) image with matched parameters, minus background suppression and labelling.
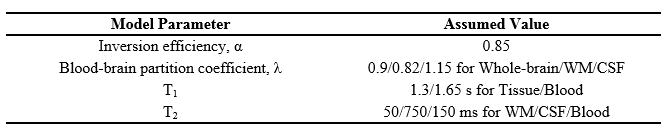
Analysis: Raw ASL data were motion corrected (MCFLIRT5), and pairwise label-control subtraction performed to create perfusion-weighted images, which were subsequently averaged across each PLD. A Bayesian non-linear fit to the general kinetic model6 was performed to calculate CBF in relative units on a voxelwise basis7, with model parameters outlined in Table 1. Signal calibration, to convert CBF to absolute physiological units, was subsequently performed, either by voxelwise division of M0a (M0 of arterial blood, defined as M0/λ), or using a reference M0a value. Here we compared three calibration approaches: (1) voxelwise (VW) calibration using a smoothed M0a image (6mm kernel) in line with the White paper1, (2) mean M0a from a white matter reference region (RRWM), and (3) mean M0a from a CSF reference region (RRCSF). T2 differences between reference-region tissue (T2r)and perfused tissue voxel were accounted for according to Equation 1:
$$ M_{0a}=\frac{M_{0}}{\lambda}\cdot e^{TE\left ( \frac{1}{T_{2r}}-\frac{1}{T_{2Blood}} \right )} $$
Tumour regions of interest (ROIs), were manually defined8 on enhancing post-gadolinium MPRAGE, with enhancing regions included only. Contralateral normal appearing grey and white matter (NAGM, NAWM) ROIs were extracted using automated FAST segmentation of the non-enhanced MPRAGE9 (partial-volume thresholded above 0.8 and 0.9 respectively) ROIs were linearly registered to M0 and FLAIR images5, and mean CBF, M0, and FLAIR signal intensity calculated within each ROI. CSF ROIs were manually defined from the ventricles on the M0 image to ensure pure CSF voxels.
Statistics: Within-subject comparisons were made using a paired t-test with an alpha value of 0.05, and correlation analysis performed using Pearson’s product moment correlation. Bonferroni correction was used to control for multiple comparisons.
Results
Signal intensity in both FLAIR and M0 images were significantly elevated in the tumour ROI in comparison to NAWM (p=0.004 and p=0.002 respectively, Fig.1), with tumour contrast correlated between the two sequences (r=0.78, p=0.039).
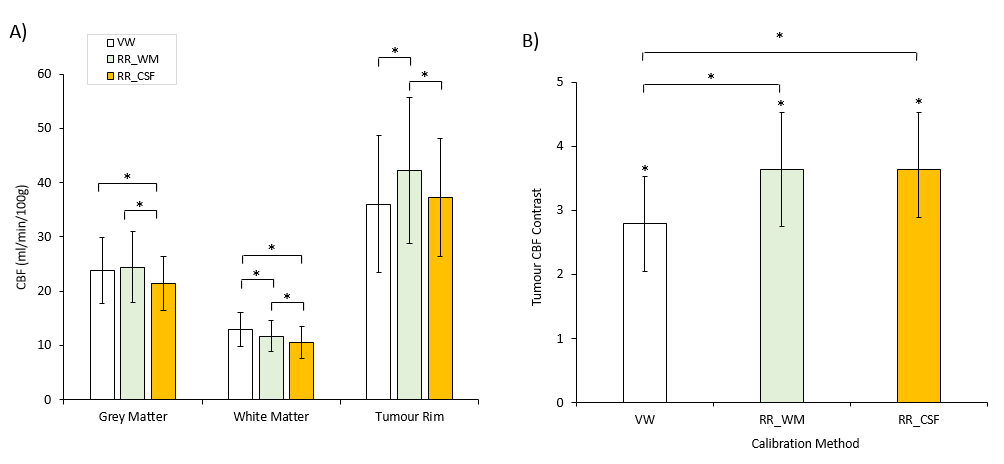
Significant tumour CBF contrast (Tumour/NAWM) was observed for all calibration methods (Fig.1, 2), with contrast significantly greater for reference-region calibrations (p=0.0039). Absolute CBFtumour was significantly higher with RRWM calibration in comparison to both VW (32.29±20.8%, p=0.03) and RRCSF (13.1±8.7%, p=0.049) calibration (Fig.2).
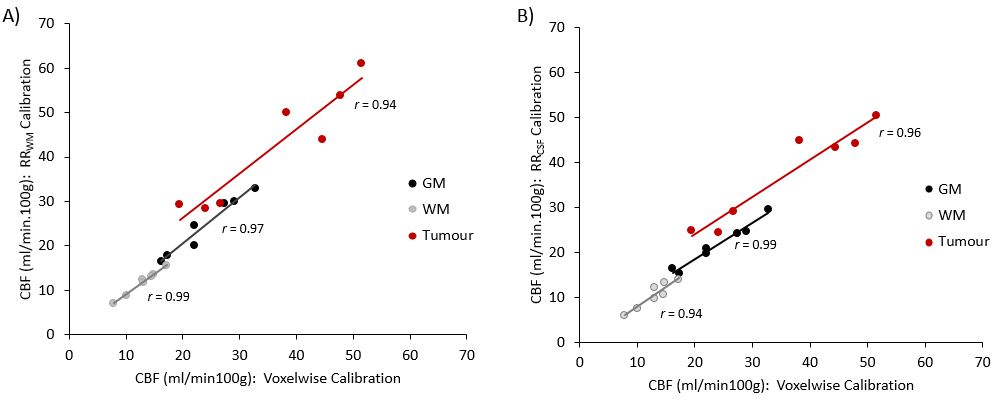
CBFNAWM was significantly lower with RRWM in comparison to VW calibration (9.1±2.5 %, p<0.001), while CBFNAGM did not differ (Fig.1B). Both CBFNAGM and CBFNAWM were significantly lower with RRCSF in comparison to VW calibration (9.0±5.3 %, p=0.02, and 19.1±8.2%, p=0.004, respectively; Fig.1B). A strong positive correlation was observed between CBF quantified with voxelwise and both RRWM and RRCSF calibration methods for all tissue types (Fig.3).
Discussion
Calibration method significantly affected absolute CBF; a significant loss of CBF contrast in tumours was evident when using voxelwise calibration, whilst the impact on absolute CBF was more variable. Results suggest that voxelwise calibration is sub-optimal due to reduced tumour contrast. However, it is less apparent whether CSF or WM calibration is the optimal alternative. Whilst CSF calibration is likely more susceptible to coil sensitivity errors, recent findings suggest that NAWM may not be truly ‘normal’, with observed alterations in T210. Future work will investigate the impact of pathological alterations in T1 and T2 on absolute CBF, both in tumour and NAWM.
From a clinical perspective, decreased sensitivity to tumour CBF in the presence of oedema may negatively impact both grading, and assessment of peritumoural pathophysiology associated with tumour invasion and recurrence11-13. From a technical perspective, reference region calibration involves additional processing steps in comparison to voxelwise. However, these steps can be automated as part of existing pipelines14-15.
Acknowledgements
This research was sponsored by the University of Oxford and overseen by the Oncology Clinical Trials Office (OCTO) and Oxford Clinical Trials Research Unit, with funding from Cancer Research UK and EPSRC as part of the Oxford Cancer Imaging Centre. We would like to thank all study participants for taking part.References
[1] Alsop D, et al. Recommended implementation of arterial spin‐labeled perfusion MRI for clinical applications: A consensus of the ISMRM perfusion study group and the European consortium for ASL in dementia. MRM, 2016; 73:102-116
[2] Kim C, et al. Recurrent Glioblastoma: combination of high cerebral blood flow with MGMT promoter methylation is associated with benefit from low-dose temozolomide rechallenge at first recurrence. Neuroadiology, 2017;
[3] Dangouloff-Ros V, et al. Arterial spin labeling to predict brain tumour grading in children: correlations between histopathologic vascular density and perfusion MR Imaging. Radiology, 2016; 281(2):553-566
[4] Brendle C, et al. Glioma Grading and Determination of IDH Mutation Status and ATRX loss by DCE and ASL Perfusion. Clin. Neuroradiology, 2018; 28(3):421-428
[5] Jenkinson M, et al. Improved optimisation for the robust and accurate linear registration and motion correction of brain images. NeuroImage, 2002;17(2):825-841
[6] Buxton R, et al. A general kinetic model for quantitative perfusion imaging with arterial spin labeling. MRM, 1998; 40(3):383-396
[7] Chappell MA, et al. Variational Bayesian Inference for a NonlinearForward Model. IEEE Trans Signal Process, 2009; 57(1):223-236
[8] Yushkevich PA, et al. User-guided 3d active contour segmentation of anatomical structures: significantly improved efficiency and reliability. Neuroimage, 2006; 31(3):1116-1128
[9] Zhang Y, et al. Segmentation of brain MR images through a hidden Markov random field model and the expectation-maximization algorithm. IEEE Trans Med Imag. 2001; 20(1):45-57
[10] Mehrabian H, et al. Glioblastoma (GBM) effects on quantitative MRI of contralateral normal appearing white matter. J Neuro-Oncology, 2018; 139(1):97-106
[11] Jarnum H, et al., Neuroradiology, Perfusion MRI of brain tumours: a comparative study of pseudo-continuous arterial spin labelling and dynamic susceptibility contrast imaging. 2010; 52(4):307-317
[12] Delgado AF & Delgado AF., Discrimination between Glioma Grades II and III Using Dynamic Susceptibility Perfusion MRI: A Meta-Analysis. Neuro-Oncology, 38(7):1348-1355
[13] Lu Y, et al. The role of three-dimensional pseudo-continuous arterial spin labelling in grading and differentiating histological subgroups of meningiomas. Clin. Radiology, 2018; 73(2):176-184
[14] www.quantiphyse.org
[15] https://fsl.fmrib.ox.ac.uk/fsl/fslwiki/BASIL
Figures