2314
Weekly T2’ and rOEF-mapping monitoring tumor oxygenation in patients with recurrent glioblastoma undergoing antiangiogenetic therapy1Institute of Neuroradiology, University Hospital Frankfurt, Frankfurt am Main, Germany, 2Dr. Senckenberg Institute of Neurooncology, University Hospital Frankfurt, Frankfurt am Main, Germany, 3Brain Imaging Center, University Hospital Frankfurt, Frankfurt am Main, Germany
Synopsis
For tumor treatment with bevacizumab (BEV), a VEGF-specific antibody, some preclinical reports describe a partial normalization of vessels resulting in a transient improvement in tumor oxygenation, while others observed a decrease in neovascularization, with induction of intratumoral hypoxia. By weekly monitoring rOEF with MRI in six glioblastoma patients until tumor progression according to RANO, we were able to discriminate between two tumor phenotypes with different biological behavior.
Introduction
Some clinical reports as well as a number of experiments using mouse tumor models have demonstrated, that antiangiogenic therapy can lead to transient improvement in tumor oxygenation 1. For bevacizumab (BEV), a VEGF-specific antibody with a half-life of 2–3 weeks, the underlying partial normalization of vessels seems to be an early treatment effect 2. On the other hand, numerous studies reported a decrease in neovascularization, resulting in an induction of intratumoral hypoxia 3. Investigating this apparent discrepancy, we report a weekly monitoring in high grade glioma patients starting antiangiogenic treatment using MR relaxometry and perfusion to measure altered oxygen extraction. Relative oxygen extraction fraction (rOEF) was calculated from R2’ and CBV measurements 4 5.Methods
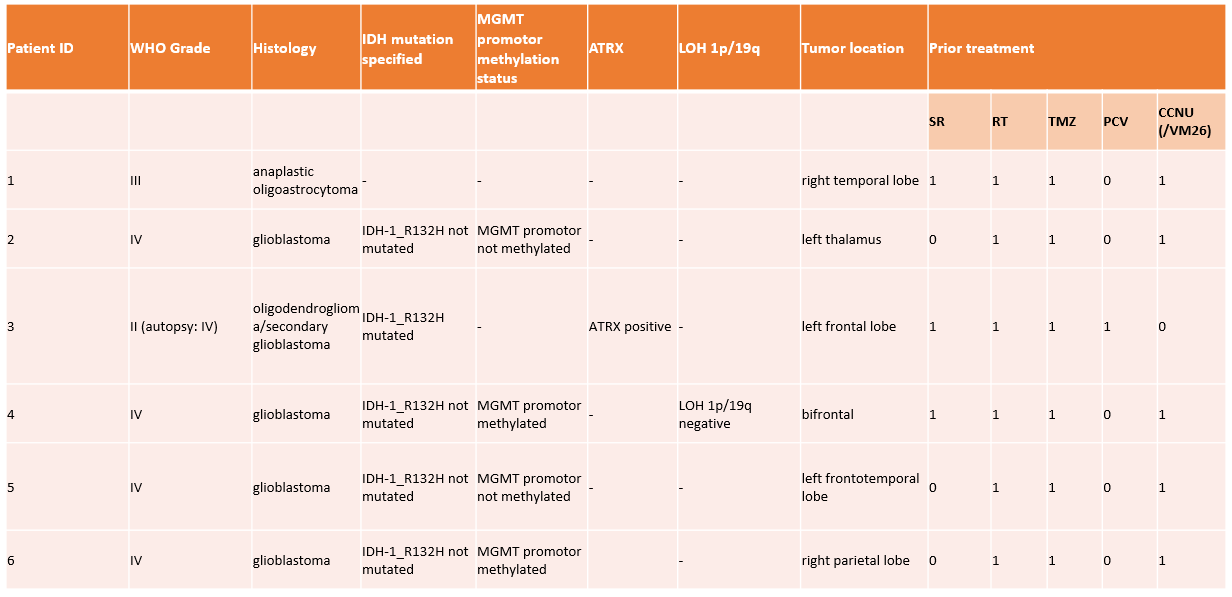
We prospectively enrolled six patients with histopathological diagnosis of glioblastoma or lower grade glioma with secondary malignisation. All patients had previously received standard treatment and showed further progression according to RANO criteria (Fig.1). BEV was administered intravenously (10 mg/kg body weight) every other week. A weekly MRI follow-up scan at a 3T MR Scanner was performed in all patients before and undergoing BEV treatment until progressive disease (PD) was confirmed according to RANO criteria (mean 8.2 scans, range 7-10). rOEF was calculated from quantitative transverse relaxation rates (T2, T2*) and cerebral blood volume (CBV; DSC contrast MRI) using a quantitative BOLD approach 5. T2* data were acquired according to Nöth et al 6. VOIs for contrast-enhancing tumor (CET) were defined on T1w Gd-subtraction maps at each timepoint. Quantitative T2 data were calculated over five echo times by monoexponential fitting (minimum requirement two echo times for evaluation) 7. Data were linearly coregistered with FSL into T2* space 5.Results
Excluding measurements with significant motion artifacts and scans prematurely aborted by patients, five patients with a mean of 6.2 scans (range 4-7) were evaluated with regard to oxygen extraction. 5/6 Patients showed a maximum visual regression of CET after only one shot of BEV was administered. The time point of maximum regression of total tumor like T2 hyperintense tissue (T2w images) was at 4.2 weeks (mean; range 2-6) in 5/6 patients. One patient showed no relevant CET/T2 regression.
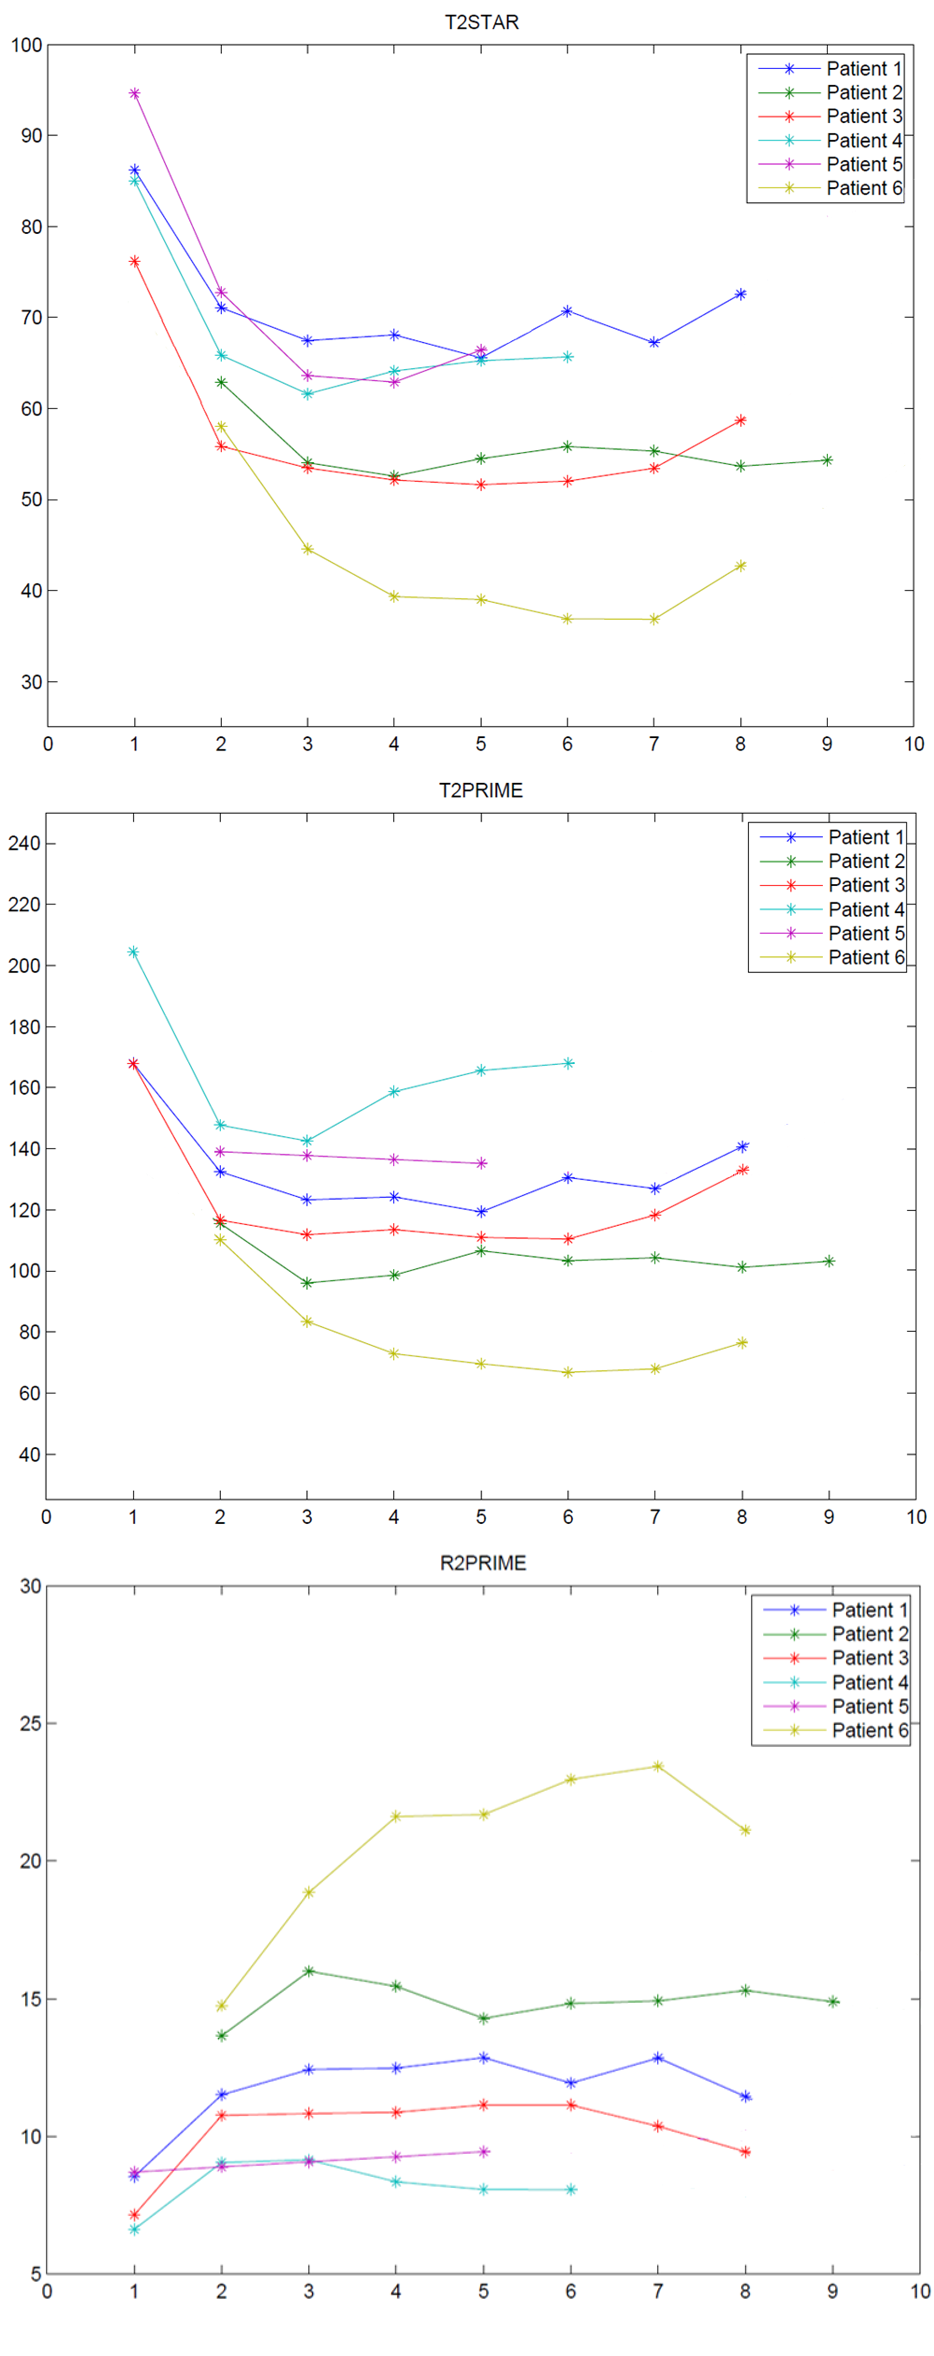
T2* and T2’ values within contrast enhancing tumor tissue showed a decline at start of BEV treatment with an increase towards further progression according to RANO. Consecutively R2’ time course was inversely correlated as shown in Fig.2.
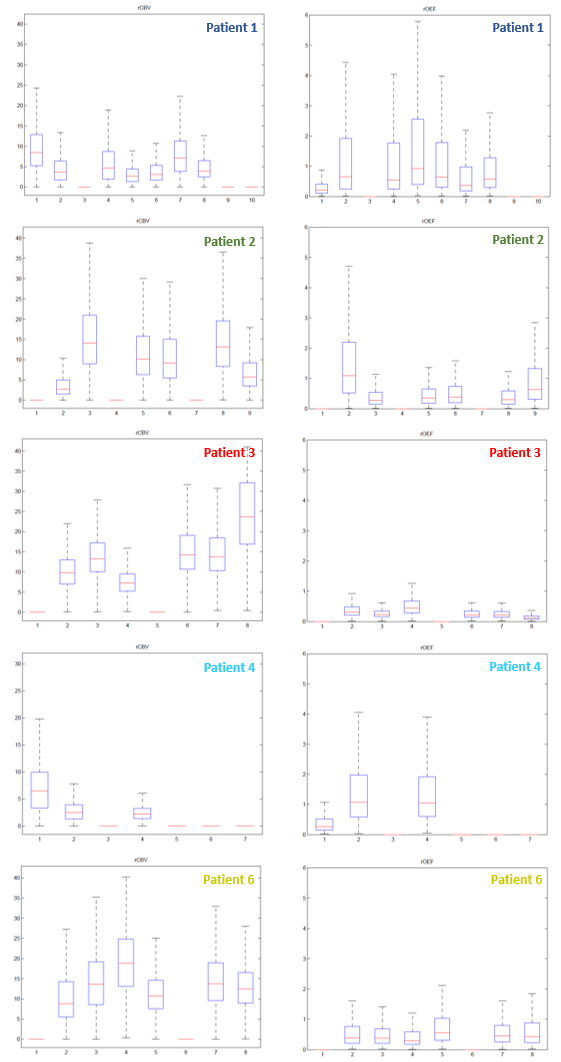
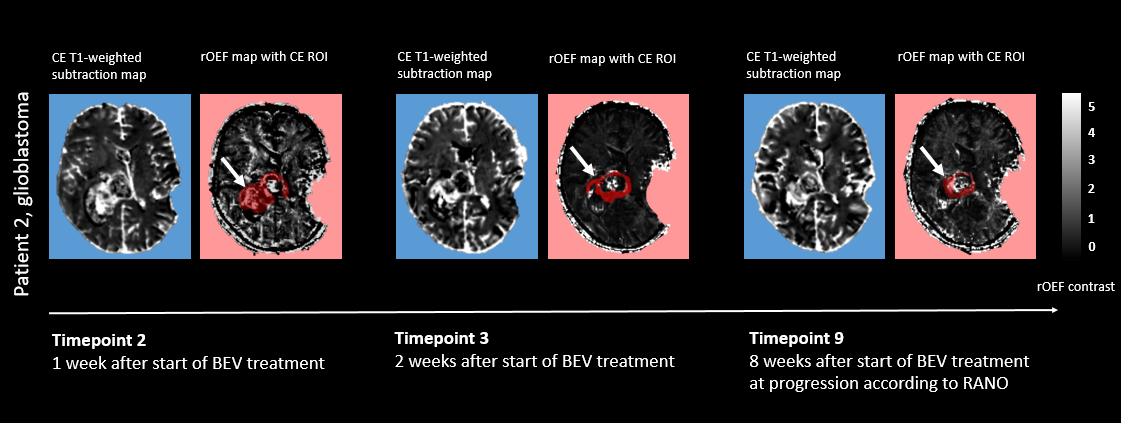
rOEF-values obtained within the same VOIs of CET revealed an increase over the course of treatment with a slight decrease at further progression for 4/5 patients. Patient 2 showed a decrease over the course of treatment with an increase progression according to RANO.
Discussion
rOEF-values of patient 2 suggest a less hypoxic tumor environment over the course of treatment, possibly due to vascular restructuring induced by bevacizumab which corresponds to a progression toward normal vascular structures. This, according to animal models and compatible with our results, can happen between 8 and 12 days of therapy 8. This patient showed the longest overall survival with 2 years and 6 months.
For all other patients, an increase in hypoxic tumor tissue within contrast enhancing tumor might indicate a decrease in neovascularization with a tumor escape towards further progression. Experimental investigations suggest that the induction of intratumoral hypoxia could play a key role in the escape from antiangiogenic therapy, e.g. through enhanced invasion and migration, shifts in cellular metabolism and vasoformative responses 3.
Conclusion
With very limited data in this pilot study, monitoring rOEF with MRI seems to enable discrimination between two tumor phenotypes with different biological behavior.Acknowledgements
No acknowledgement found.References
1. Kuznetsov MB, Kolobov AV. Transient alleviation of tumor hypoxia during first days of antiangiogenic therapy as a result of therapy-induced alterations in nutrient supply and tumor metabolism - Analysis by mathematical modeling. J Theor Biol. 2018;451:86-100. doi:10.1016/j.jtbi.2018.04.035.
2. Willett CG, Boucher Y, Di Tomaso E, et al. Direct evidence that the VEGF-specific antibody bevacizumab has antivascular effects in human rectal cancer. Nat Med. 2004;10(2):145-147. doi:10.1038/nm988.
3. Mahase S, Rattenni RN, Wesseling P, et al. Hypoxia-Mediated Mechanisms Associated with Antiangiogenic Treatment Resistance in Glioblastomas. Am J Pathol. 2017;187(5):940-953. doi:10.1016/j.ajpath.2017.01.010.
4. Hattingen E, Jurcoane A, Bähr O, et al. Bevacizumab impairs oxidative energy metabolism and shows antitumoral effects in recurrent glioblastomas: a 31P/1H MRSI and quantitative magnetic resonance imaging study. Neuro-oncology. 2011;13(12):1349-1363. doi:10.1093/neuonc/nor132.
5. Tóth V, Förschler A, Hirsch NM, et al. MR-based hypoxia measures in human glioma. J Neurooncol. 2013;115(2):197-207. doi:10.1007/s11060-013-1210-7.
6. Nöth U, Volz S, Hattingen E, Deichmann R. An improved method for retrospective motion correction in quantitative T2* mapping. Neuroimage. 2014;92:106-119. doi:10.1016/j.neuroimage.2014.01.050.
7. Lescher S, Jurcoane A, Veit A, Bähr O, Deichmann R, Hattingen E. Quantitative T1 and T2 mapping in recurrent glioblastomas under bevacizumab: earlier detection of tumor progression compared to conventional MRI. Neuroradiology. 2015;57(1):11-20. doi:10.1007/s00234-014-1445-9.
8. El Alaoui-Lasmaili K, Djermoune E-H, Tylcz J-B, et al. A new algorithm for a better characterization and timing of the anti-VEGF vascular effect named "normalization". Angiogenesis. 2017;20(1):149-162. doi:10.1007/s10456-016-9536-3.
Figures