2313
Association between Metabolism Measured by PET/CT and Vascular Parameters Measured by Dynamic Contrast Enhanced MRI in Spinal LesionsJiahui Zhang1, Enlong Zhang1, Yanyan Zhang2, Yongye Chen1, Ning Lang1, Hon J Yu3, Huishu Yuan1, and Min-Ying Lydia Su3
1Department of Radiology, Peking University Third Hospital, Beijing, China, 2Department of Nuclear Medicine, Peking University Third Hospital, Beijing, China, 3Department of Radiological Sciences, University of California, Irvine, CA, United States
Synopsis
A total of 49 patients with spinal lesions receiving DCE-MRI and 18F-FDG PET/CT were analyzed. The ROI was manually placed on strongly enhanced area on MRI to measure DCE enhancement kinetics, and from which the wash-in and maximum enhancement ratio, wash-out slope, Ktrans and kep were extracted. SUVmax was measured from the corresponding lesion on FDG uptake map. The results showed that vascular parameters measured from DCE-MRI were not correlated with glucose metabolism measured by PET/CT; therefore, they represent different aspects of lesion, and may be combined for better staging or predicting prognosis rather than being used for diagnosis.
Introduction
MRI is often recommended for patients presenting with pain in the spine, who are suspected to have lesions compressing the spinal cord. The most likely malignancy is metastatic cancer and primary bone cancer. Other borderline malignant (or aggressive benign) tumors and benign lesions are also found in the spine, and each lesion needs to be correctly diagnosed to decide the most appropriate treatment plan. Although MRI can provide detailed morphological information about the deformation of the bone and the presence of soft tissue lesion, there are no specific imaging features that can be used to diagnose different types of lesions. Several studies have shown that the vascular parameters measured by dynamic-contrast-enhanced MRI can provide additional information to help differentiation of lesions in the spine, e.g. primary bone cancers such as myeloma, lymphoma, chordoma [1-4]; benign lesions such as tuberculosis, giant cell tumor of the bone [4-5]; metastatic cancers of different origins [6-8]. PET/CT provides another important imaging modality to measure metabolism for diagnosis of lesions, or for staging of cancer that has been confirmed for therapy planning. Glucose metabolism measured by 18F-FDG and vascular parameters measured by DCE-MRI may provide complementary information representing different aspects of the lesion. Their associations in the lung cancer [9] and the head and neck cancer [10] have been studied before. The purpose of this study is to investigate the association between quantitative imaging parameters measured by DCE-MRI and 18F-FDG PET/CT.Methods
In a retrospective review of patients receiving spinal MRI that included a DCE sequence, and 18F-FDG PET/CT, a total of 49 patients were identified. They received PET/CT after MRI, either for diagnosis or staging. The histological types are listed in Table 1. MR scans were performed on a 3T Siemens system. After the abnormal region was identified, DCE-MRI was performed using the 3D VIBE sequence, with TR=4.1ms, TE=1.5 ms, flip angle=10°, matrix=256×192 and FOV=250×250 mm. Approximately 30 slices with 3-mm thickness were prescribed to cover the abnormal vertebrae. The contrast agents, 0.1 [mmol/kg] Gd-DTPA, was injected after one set of pre-contrast images was acquired. A total of 12 frames were acquired, and the total DCE-MRI time period was about 160 seconds. For each case, an ROI was manually placed on the area showing the strongest enhancement to measure signal intensity time course. Three heuristic parameters were calculated: the steepest wash-in signal enhancement ratio [(S2-S1)/S0]; The maximum signal enhancement ratio [(Smax-S0)/S0]; and the wash-out slope [(Speak-Slast)/Speak], or if no peak [(S67s-Slast)/S67s]. The DCE time course was also analyzed with a 2-compartmental pharmacokinetic model to obtain Ktrans (1/min) and kep (1/min), following the previously reported method [3]. PET/CT was done using the Siemens Biograph 64 PET/CT scanner, covering from head to thigh. The subject received an intravenous bolus of approximately 370 MBq (10 mCi) 18F-FDG. Attenuation correction CT was performed using a 64-slice multidetector helical scanner prior to PET acquisition. The CT parameters were kVp=140, mA=100, and reconstructed slice thickness of 3 mm. The analysis on PET was done according to the lesions analyzed on MRI. The radiologist outlined the lesion ROI on the FDG uptake map, and the SUVmax was measured. The results in three groups: malignant, borderline malignant/aggressive benign, and benign were analyzed and compared.Results
The mean and standard deviation of analyzed parameters in three groups, as well as in each histological subtype, are summarized in Table 1. The highest number of histological subtype is 19 metastatic cancer and 8 plasmacytoma. The MRI and PET images of one renal metastasis and one plasmacytoma are shown in Figures 1 and 2. The images from two benign lesions, Schwannoma and Hemangioma, are shown in Figure 3. The DCE pharmacokinetic parameters, Ktrans and kep, were not significantly correlated with SUVmax, in either the entire group of 49 cases, or in each of the three malignant/benign groups. The parameters between the two largest subtypes: 19 metastatic cancer and 8 plasmacytoma, were compared. The mean kep was 0.78±0.17 in plasmacytoma, significantly higher than 0.61±0.18 in mets (p=0.019). In contrast, SUVmax was 5.58±2.16 in plasmacytoma, significantly lower than 9.37±4.26 in mets (p=0.025). The sensitivity and specificity to differentiate between them were 87.5% and 73.7% based on kep, and 78.9% and 62.5% based on SUVmax. To evaluate whether different DCE-MRI analysis methods yielded consistent results, we performed correlation analysis between heuristic and pharmacokinetic parameters. It was found that kep was highly correlated with wash-out slope, and Ktrans was highly correlated with max SE ratio and steepest wash-in SE ratio, as shown in Figure 4. Therefore, both heuristic and pharmacokinetic analysis methods can be used.Discussion
The results showed that vascular parameters measured by DCE-MRI were not correlated with metabolic information measured by 18F-FDG PET, suggesting that they reveal different aspects of lesions and may provide complementary information for lesion diagnosis, staging, or prediction of aggressiveness or prognosis. The variation in SUVmax was high, and it might not provide reliable information for diagnosis of different spinal lesions. The differentiation accuracy between metastases and plasmacytoma was better based on kep than SUVmax. The main clinical role of FDG PET is for detection and staging of metastases in the whole body. In addition, glucose metabolism is related to tumor aggressiveness, and that may provide important information for prediction of prognosis. For example, different plasmacytomas may have different risks progressing to multiple myeloma, and it will be interesting to use combined DCE-MRI and PET parameters measured in this study to predict their conversion risk by monitoring the long-term prognosis of these patients.Acknowledgements
This study is supported in part by NIH R01 CA127927, the National Natural Science Foundation of China (81701648, 81471634, 81871326).References
[1]. Lang P, Honda G, Roberts T et al. Musculoskeletal neoplasm: perineoplastic edema versus tumor on dynamic postcontrast MR imaging with spatial mapping of instantaneous enhancement rates. Radiology 1995;197:831-839. [2]. Moulopoulos L A, Maris T G, Papanikolaou N et al. Detection of malignant bone marrow involvement with dynamic contrast-enhanced magnetic resonance imaging. Ann Oncol 2003;14(1):152-158. [3]. Lang N, Yuan H, Yu HJ, Su MY. Diagnosis of Spinal Lesions Using Heuristic and Pharmacokinetic Parameters Measured by Dynamic Contrast-Enhanced MRI. Acad Radiol 2017;24(7):867-875. [4]. Lang N, Su MY, Xing X, Yu HJ, Yuan H. Morphological and dynamic contrast enhanced MR imaging features for the differentiation of chordoma and giant cell tumors in the Axial Skeleton. J Magn Reson Imaging 2017;45(4):1068-1075. [5]. Lang N, Su MY, Yu HJ et al. Differentiation of tuberculosis and metastatic cancer in the spine using dynamic contrast-enhanced MRI. Eur Spine J 2015;24:1729–1737. [6]. Saha A, Peck KK, Lis E et al. Magnetic resonance perfusion characteristics of hypervascular renal and hypovascular prostate spinal metastases: clinical utilities and implications. Spine 2014;39:E1433–E1440. [7]. Khadem NR, Karimi S, Peck KK et al. Characterizing hypervascular and hypovascular metastases and normal bone marrow of the spine using dynamic contrast-enhanced MR imaging. AJNR Am J Neuroradiol 2012;33:2178–2185. [8]. Lang N, Su MY, Yu HJ et al. Differentiation of myeloma and metastatic cancer in the spine using dynamic contrast-enhanced MRI. Magn Reson Imaging 2013;31:1285–1291. [9]. Lee SH, Rimner A, Gelb E et al. Correlation Between Tumor Metabolism and Semiquantitative Perfusion Magnetic Resonance Imaging Metrics in Non-Small Cell Lung Cancer. Int J Radiat Oncol Biol Phys. 2018 Mar 2. doi: 10.1016/j.ijrobp.2018.02.031. [Epub ahead of print]. [10]. Surov A, Leifels L, Meyer HJ et al. Associations Between Histogram Analysis DCE MRI Parameters and Complex 18F-FDG-PET Values in Head and Neck Squamous Cell Carcinoma. Anticancer Res. 2018;38(3):1637-1642.Figures
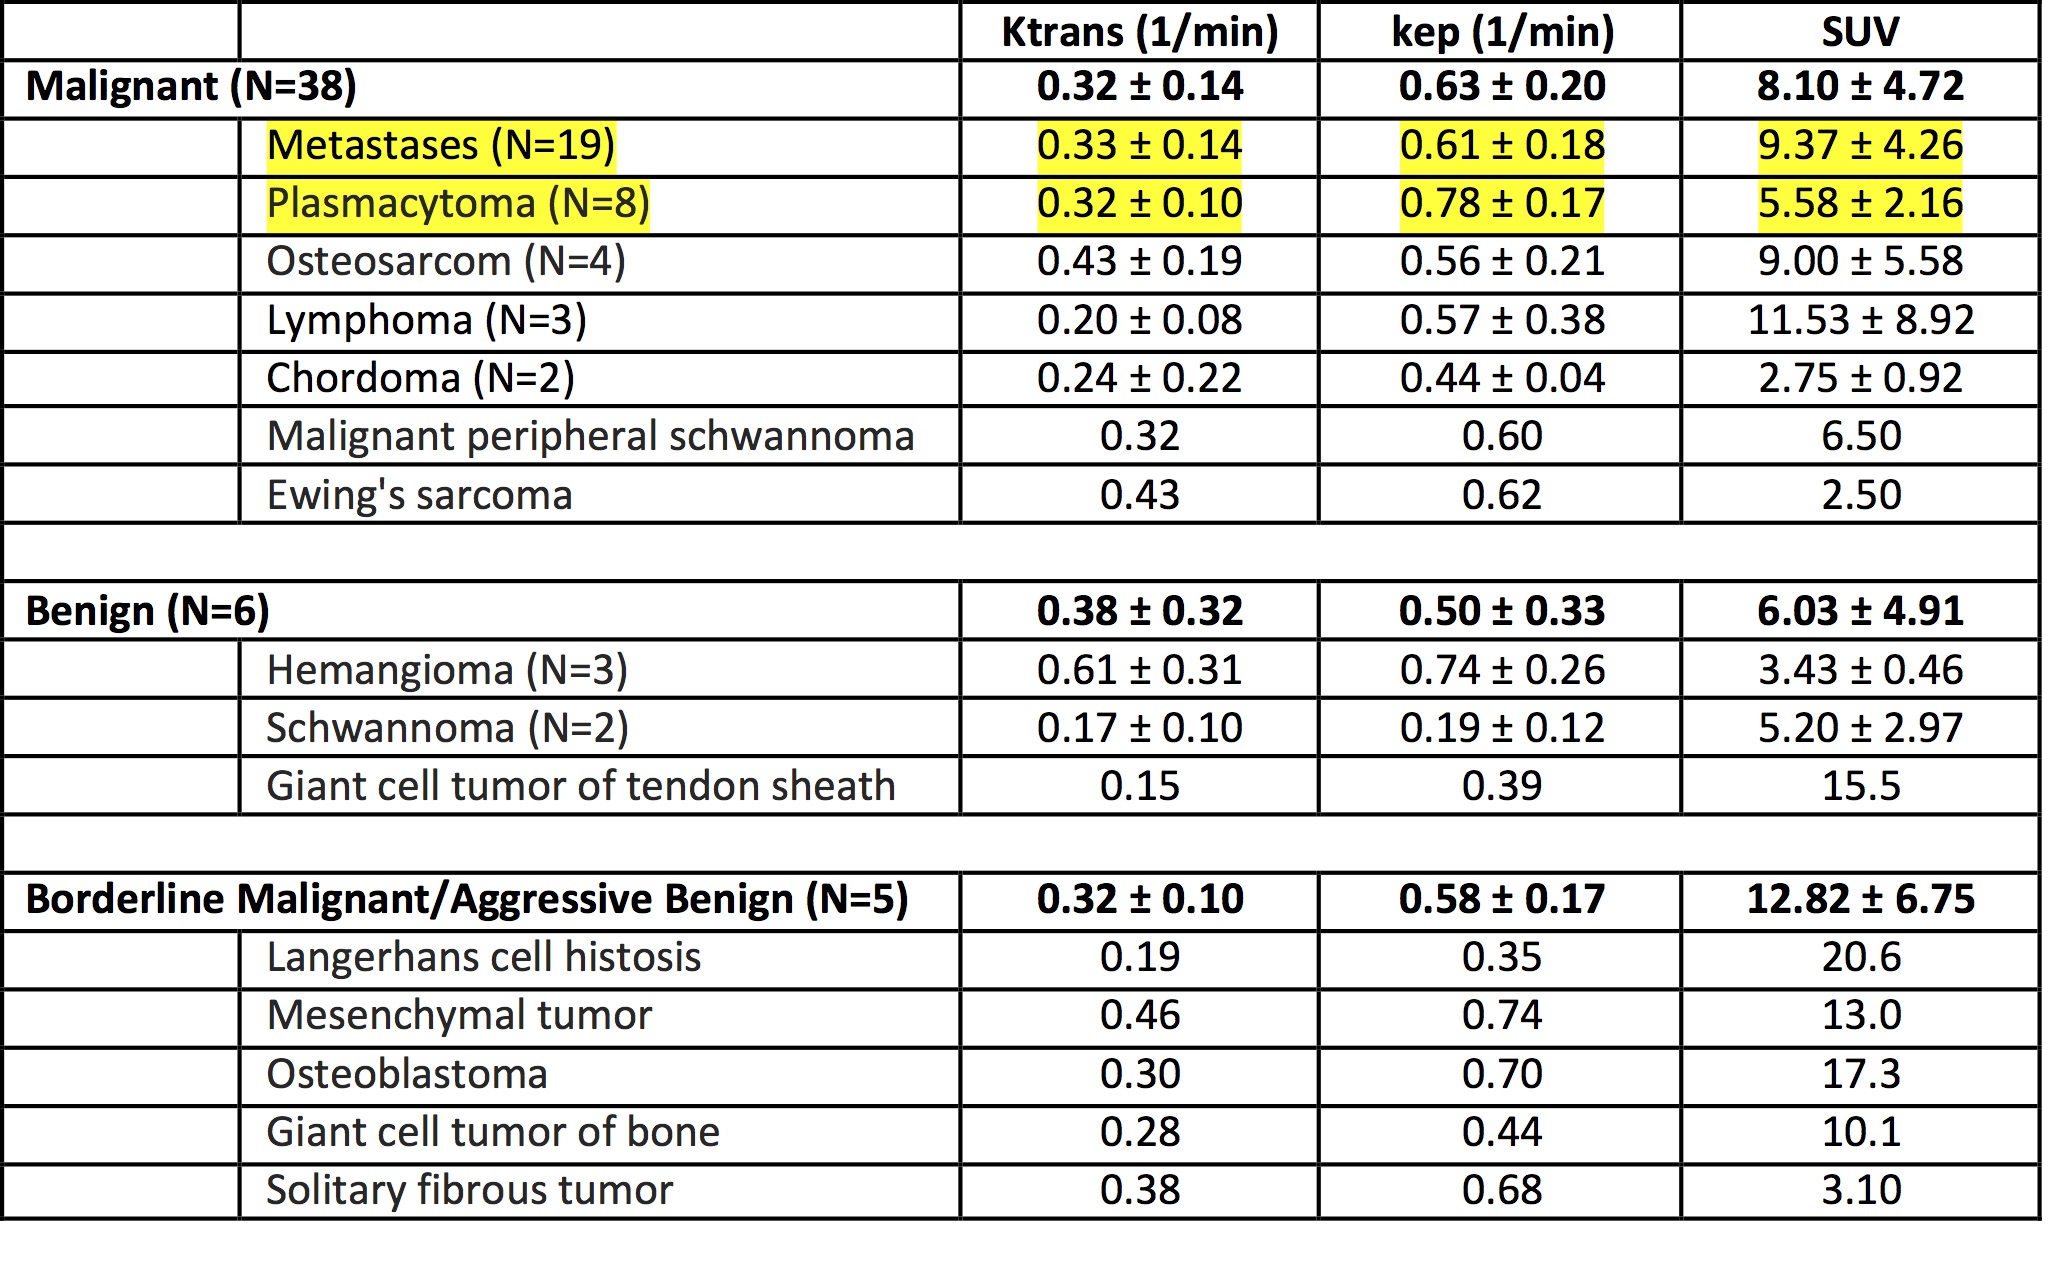
Table 1. The
mean +/- standard deviation of DCE pharmacological parameters and SUVmax in
different histological types
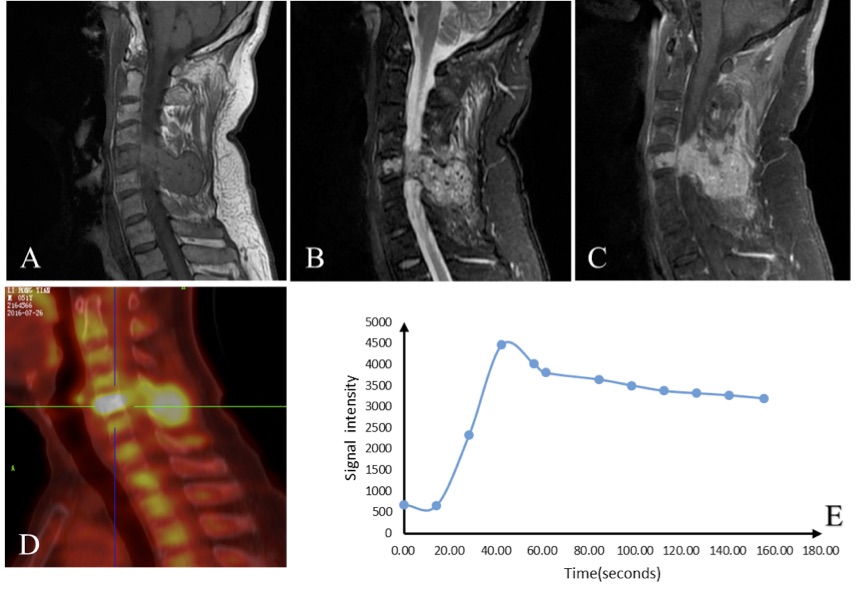
Figure 1. A 52-year-old male patient
with metastatic renal cancer on C5. (A) T1-weighted image; (B) T2-weighted
fat-suppressed image; (C) T1-weighted contrast-enhanced image; (D) FDG uptake
map; (E) DCE signal intensity time course. A strong FDG uptake is seen,
SUVmax=13.3, and the DCE kinetic shows the wash-out pattern with Ktrans=0.552
(1/min) and kep =0.802 (1/min).
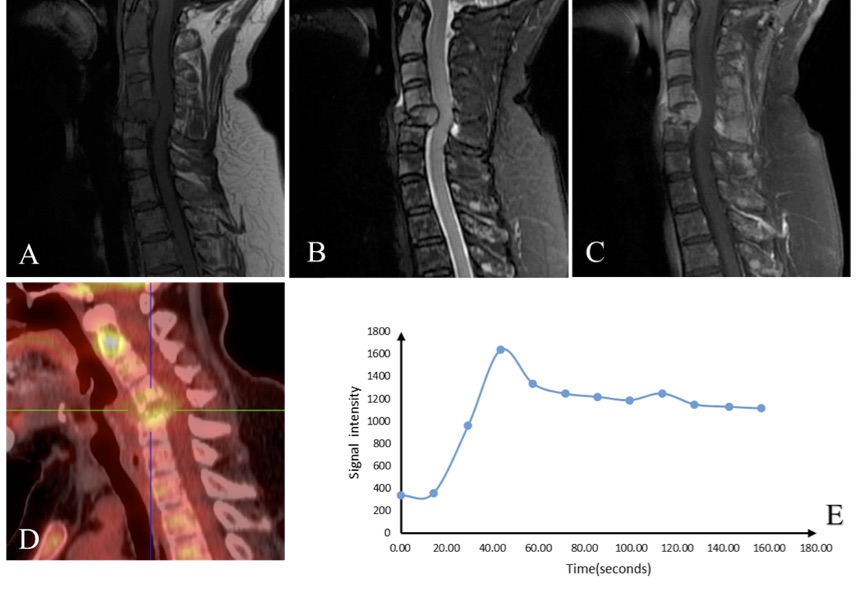
Figure 2. A 64-year-old female
patient with multiple plasmacytoma,
showing obvious deformation on
C5. (A) T1-weighted image; (B) T2-weighted fat-suppressed image; (C)
T1-weighted contrast-enhanced image; (D) FDG uptake map; (E) DCE signal
intensity time course. A high FDG uptake is seen on C2 and C5, with SUVmax=6.1 measured
on C5. The measured DCE time course from the enhanced lesion on C5 shows the
wash-out pattern with Ktrans=0.344 (1/min) and kep =0.821 (1/min).
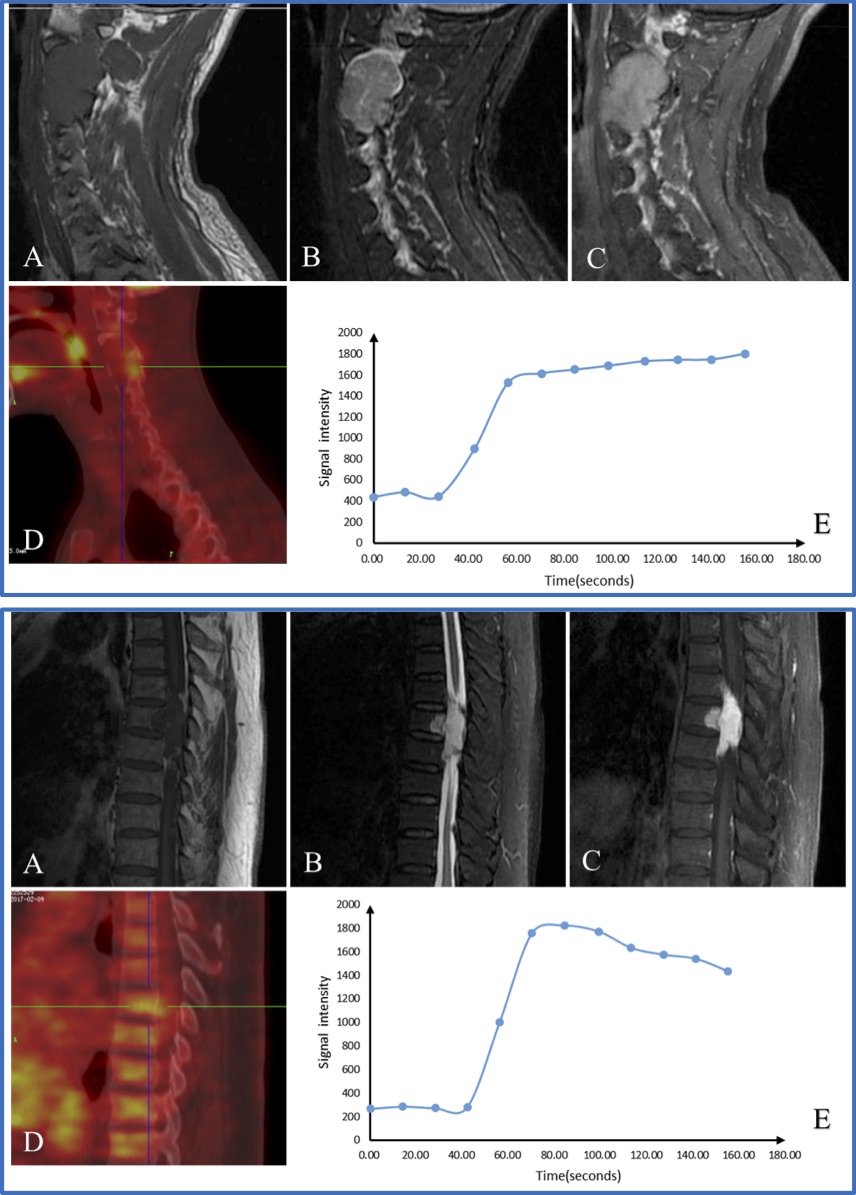
Figure 3. Two benign lesions. (A)
T1-weighted image; (B) T2-weighted fat-suppressed image; (C) T1-weighted
contrast-enhanced image; (D) FDG uptake map; (E) DCE signal intensity time
course.
Top Panel: A 32-year-old
male patient with Schwannoma on C1-3. DCE-MRI enhancement kinetics shows the persistent
enhancement pattern, and SUVmax is low, 3.1. Bottom Panel: A 68-year-old male
patient with Hemangioma on T7-9. DCE-MRI
enhancement kinetics shows the wash-out pattern, indicating a high perfusion, and
the SUVmax is also low, 3.7.
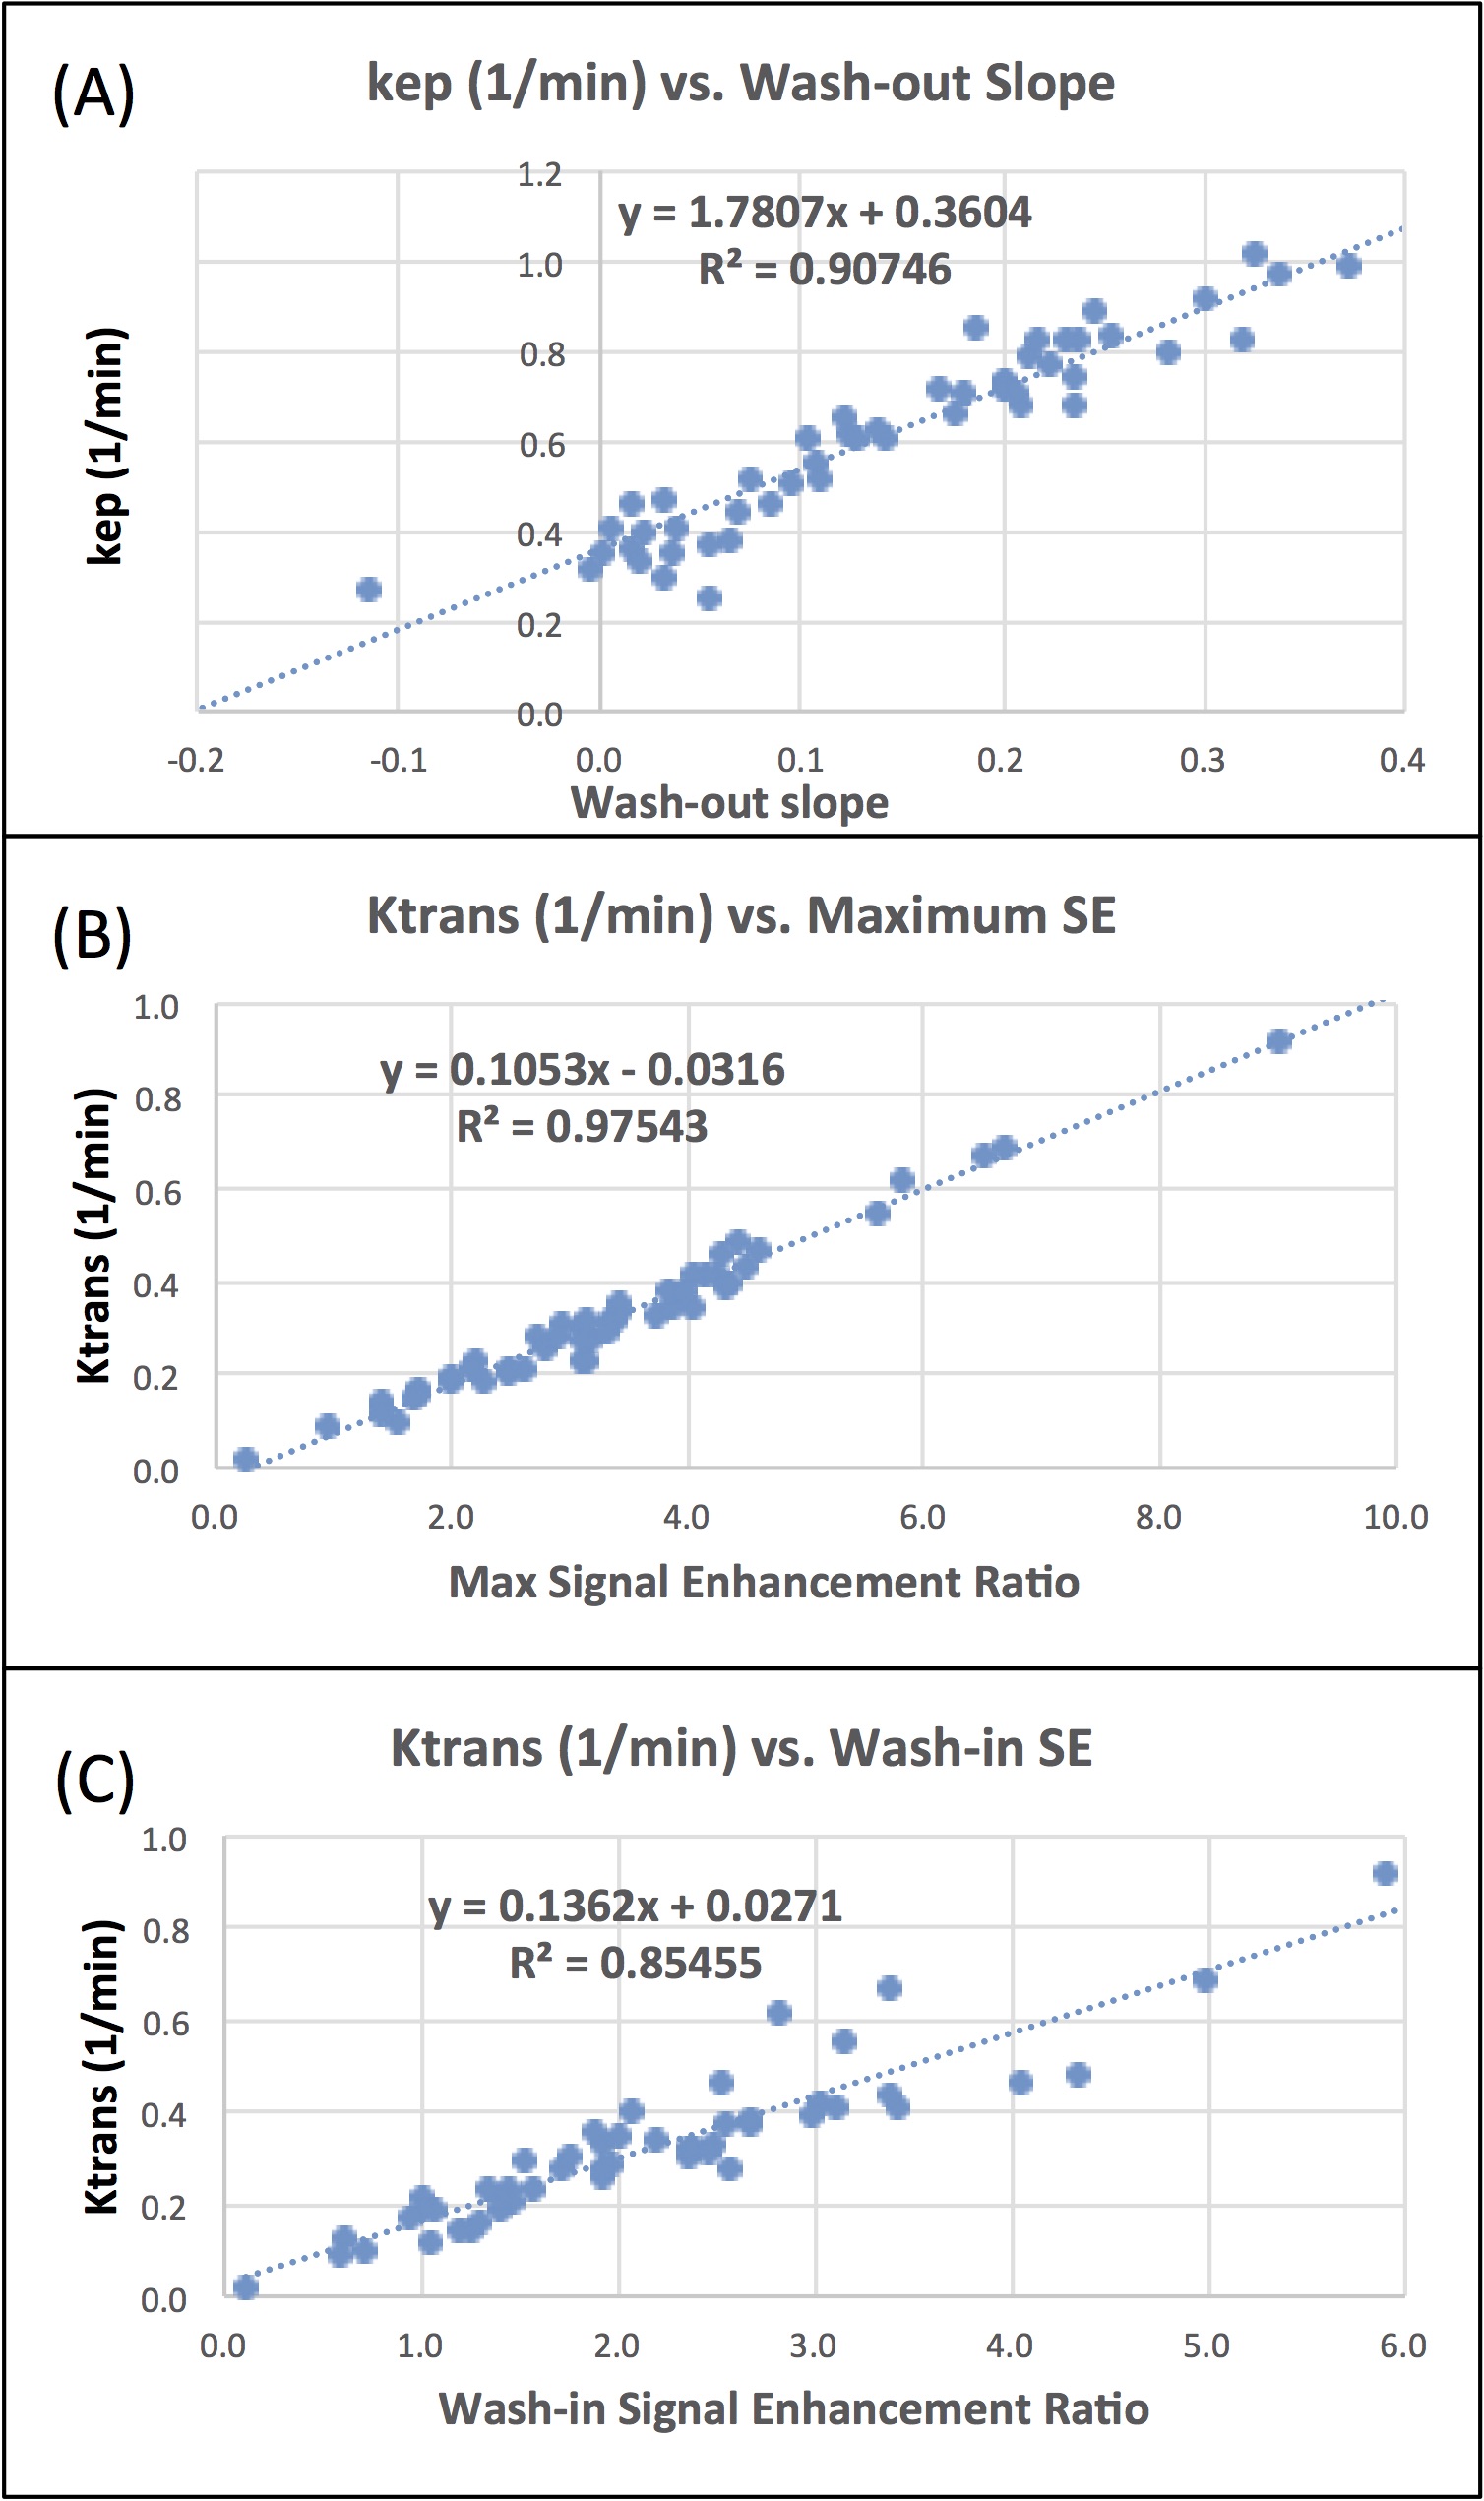
Figure 4. The correlation plot of (A)
kep (1/min) with wash-out slope calculated as [(Speak-Slast)/Speak]; (B) Ktrans
(1/min) with maximum signal enhancement ratio [(Smax-S0)/S0], and (C) Ktrans
(1/min) with steepest wash-in signal enhancement ratio [(S2-S1)/S0]. The
correlation is very high, indicating that different analysis methods can yield consistent
quantitative parameters to characterize DCE time course.