2312
OE-MRI, DCE-MRI and DWI provide complementary response evaluation in patients with rectal cancer treated with chemoradiotherapy1Quantitative Biomedical Imaging Laboratory, University of Manchester, Manchester, United Kingdom, 2Department of Radiology, Christie Hospital, Manchester, United Kingdom, 3Department of Clinical Oncology, Christie Hospital, Manchester, United Kingdom, 4Bioxydyn Ltd, Manchester, United Kingdom, 5Division of Cancer Sciences, University of Manchester, Manchester, United Kingdom
Synopsis
Biomarkers derived from functional MRI have potential to monitor response to therapy and stratify patient care. In this study of 22 patients with rectal cancer we evaluated the relative merits of using OE-MRI, DCE-MRI and DWI biomarkers to assess response to chemoradiotherapy. We show that OE-MRI is feasible in rectal cancer tumours and provides complementary information to that measured by DWI and DCE-MRI. Data suggests that OE-MRI may be useful as a pharmacodynamic tool to identify hypoxia modification as this was present by day 14, but not at day 7 into therapy.
Introduction
Biomarkers derived from dynamic contrast-enhanced MRI (DCE-MRI) and diffusion weighted imaging (DWI) can track change in the tumour microenvironment of solid tumours, induced by various therapies. Over the last 20 years, many studies have evaluated the role of DCE-MRI and DWI in monitoring the effects of (chemo)-radiotherapy in patients with rectal cancer 1, 2. Recent advances in image analysis have suggested that oxygen-enhanced MRI (OE-MRI) may have value in identifying, mapping and tracking tumour hypoxia 3, but to date no study has compared all three techniques within one patient study. The aims of the study were to:
- Demonstrate feasibility of performing OE-MRI alongside DCE-MRI and DWI in a multiparametric protocol in patients with rectal cancer
- To compare the changes in OE-MRI biomarkers with those observed in DCE-MRI and DWI biomarkers
- To investigate the temporal evolution of these effects
Methods
Research ethics approval and written informed consent were obtained. We recruited 22 patients with T3-4 N0-2 M0 rectal cancer receiving neoadjuvant capecitabine along with 45Gy in 25 fractions (#) of radiotherapy (RT). Multiparametric MRI was performed on a Philips 1.5 T Achieva immediately prior to treatment (day 0) and either day 7 (>5# RT) or day 14 (>10# RT).
Sequences: The MRI protocol consisted of initial sagittal and anatomical T2W imaging followed by (1) OE-MRI: volumetric 3D variable flip angle (VFA) sequences to map T1 (TR: 12ms; TE: 0.74ms; α: 3°, 13°, 18°) during breathing medical air (21% oxygen) followed by 13° dynamic, with switch gas from air to 100% oxygen after the 14th time point; gases were delivered using a tight-sealed, non-rebreathing Intersurgical EcoLite™ Hudson facemask; (2) DWI: switch back to air breathing, during which multi-slice 2D DWI was acquired using axial single shot echo planar imaging (TR: 6000 ms; TE: 65 ms; α: 90°) with b values of 0, 50, 150, 300, 500, 800 s/mm2; and (3) DCE-MRI: volumetric 3D VFA sequences to map T1 (TR: 2.4ms; TE: 0.74ms; α: 2°, 10°, 20°) followed by 20° dynamic, with bolus of 0.05 mmol/kg gadoterate meglumine injected at 1.5 ml/s after the 5th time point. All sequences had FOV 375mm x 375mm with in plane resolution 2.34mm and covered 10cm through plane with a 4mm spatial resolution. The OE-MRI temporal resolution was 13.9s and the DCE-MRI temporal resolution was 1.5s.
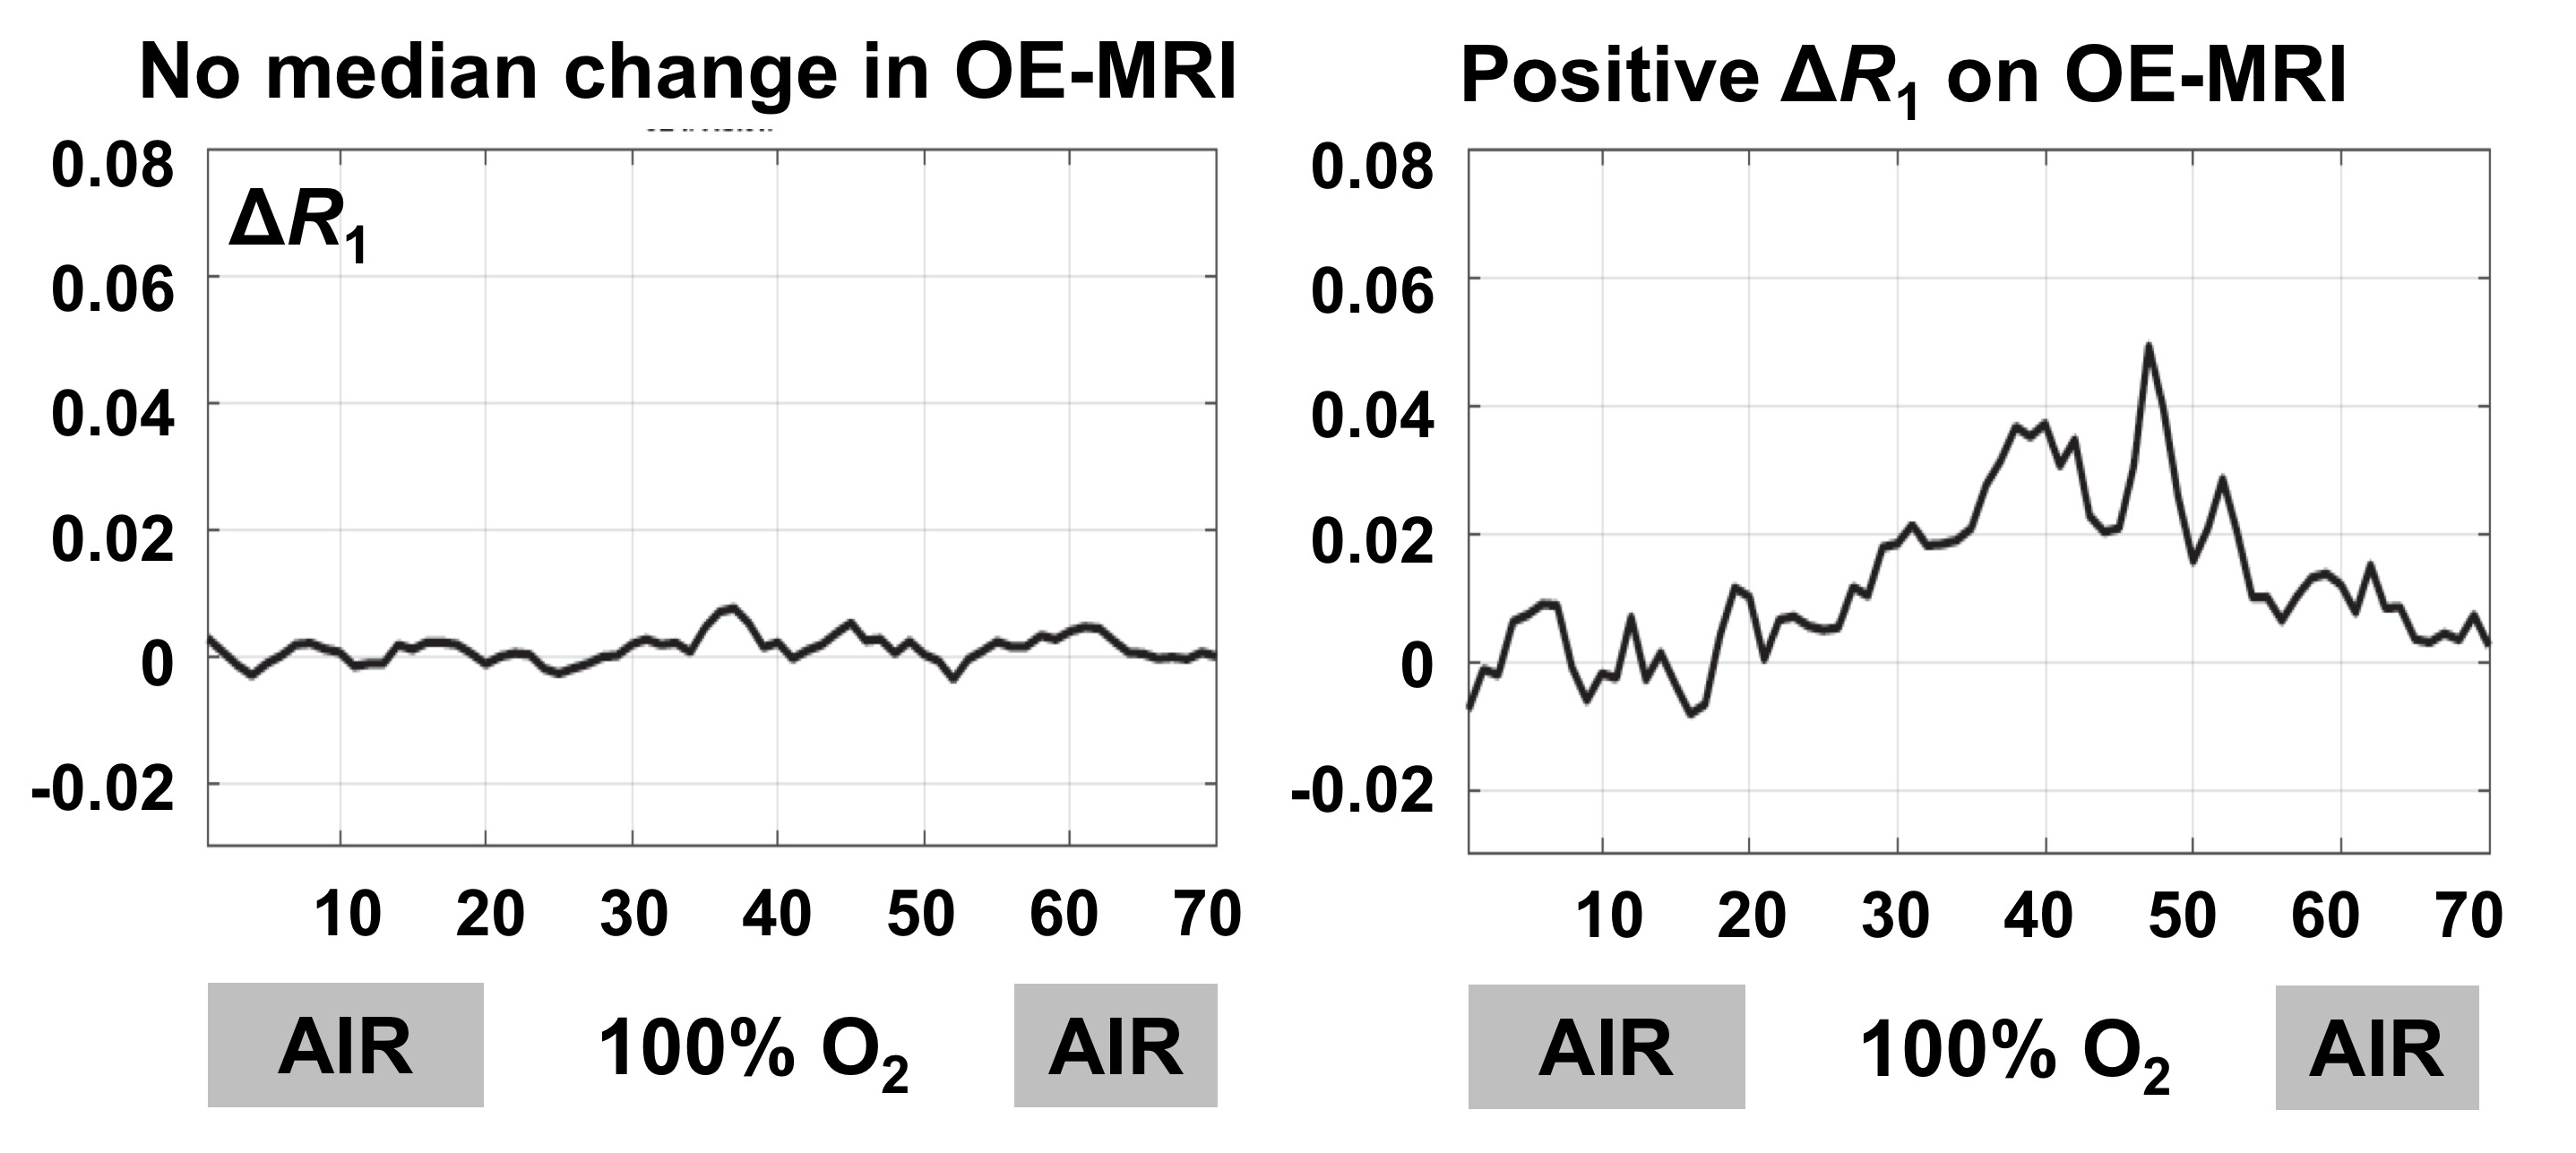
Analysis: For OE-MRI, whole tumor and voxel-wise ΔR1 were calculated, where ΔR1 = R1 while breathing oxygen (mean of last 18 time points on 100% oxygen) minus R1 on breathing air (mean of time points on medical air). For DCE-MRI, tumor median IAUC60 was calculated. Voxels were classified as hypoxic (termed pOxy-R) 3,4 when IAUC60 was >0 (one sided paired sample t-test, p<0.005) and ΔR1 was refractory to change. Voxel-wise exponential fitting defined voxel-wise apparent diffusion coefficient (ADC). b values of 150 s/mm2 or greater avoided perfusion effects.
Results
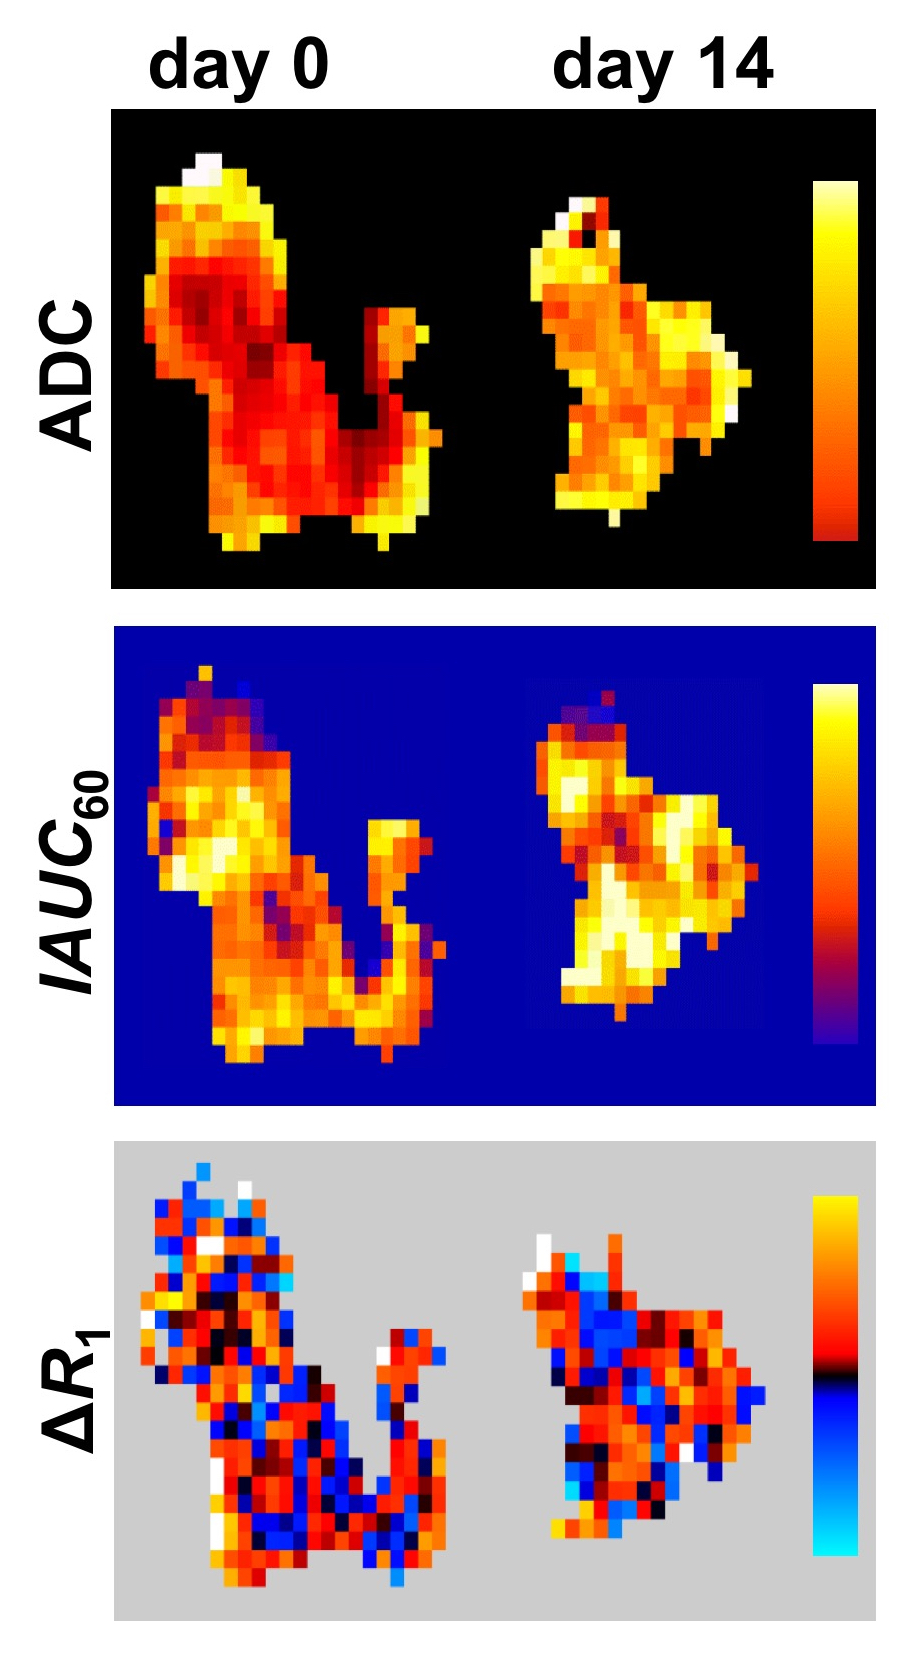
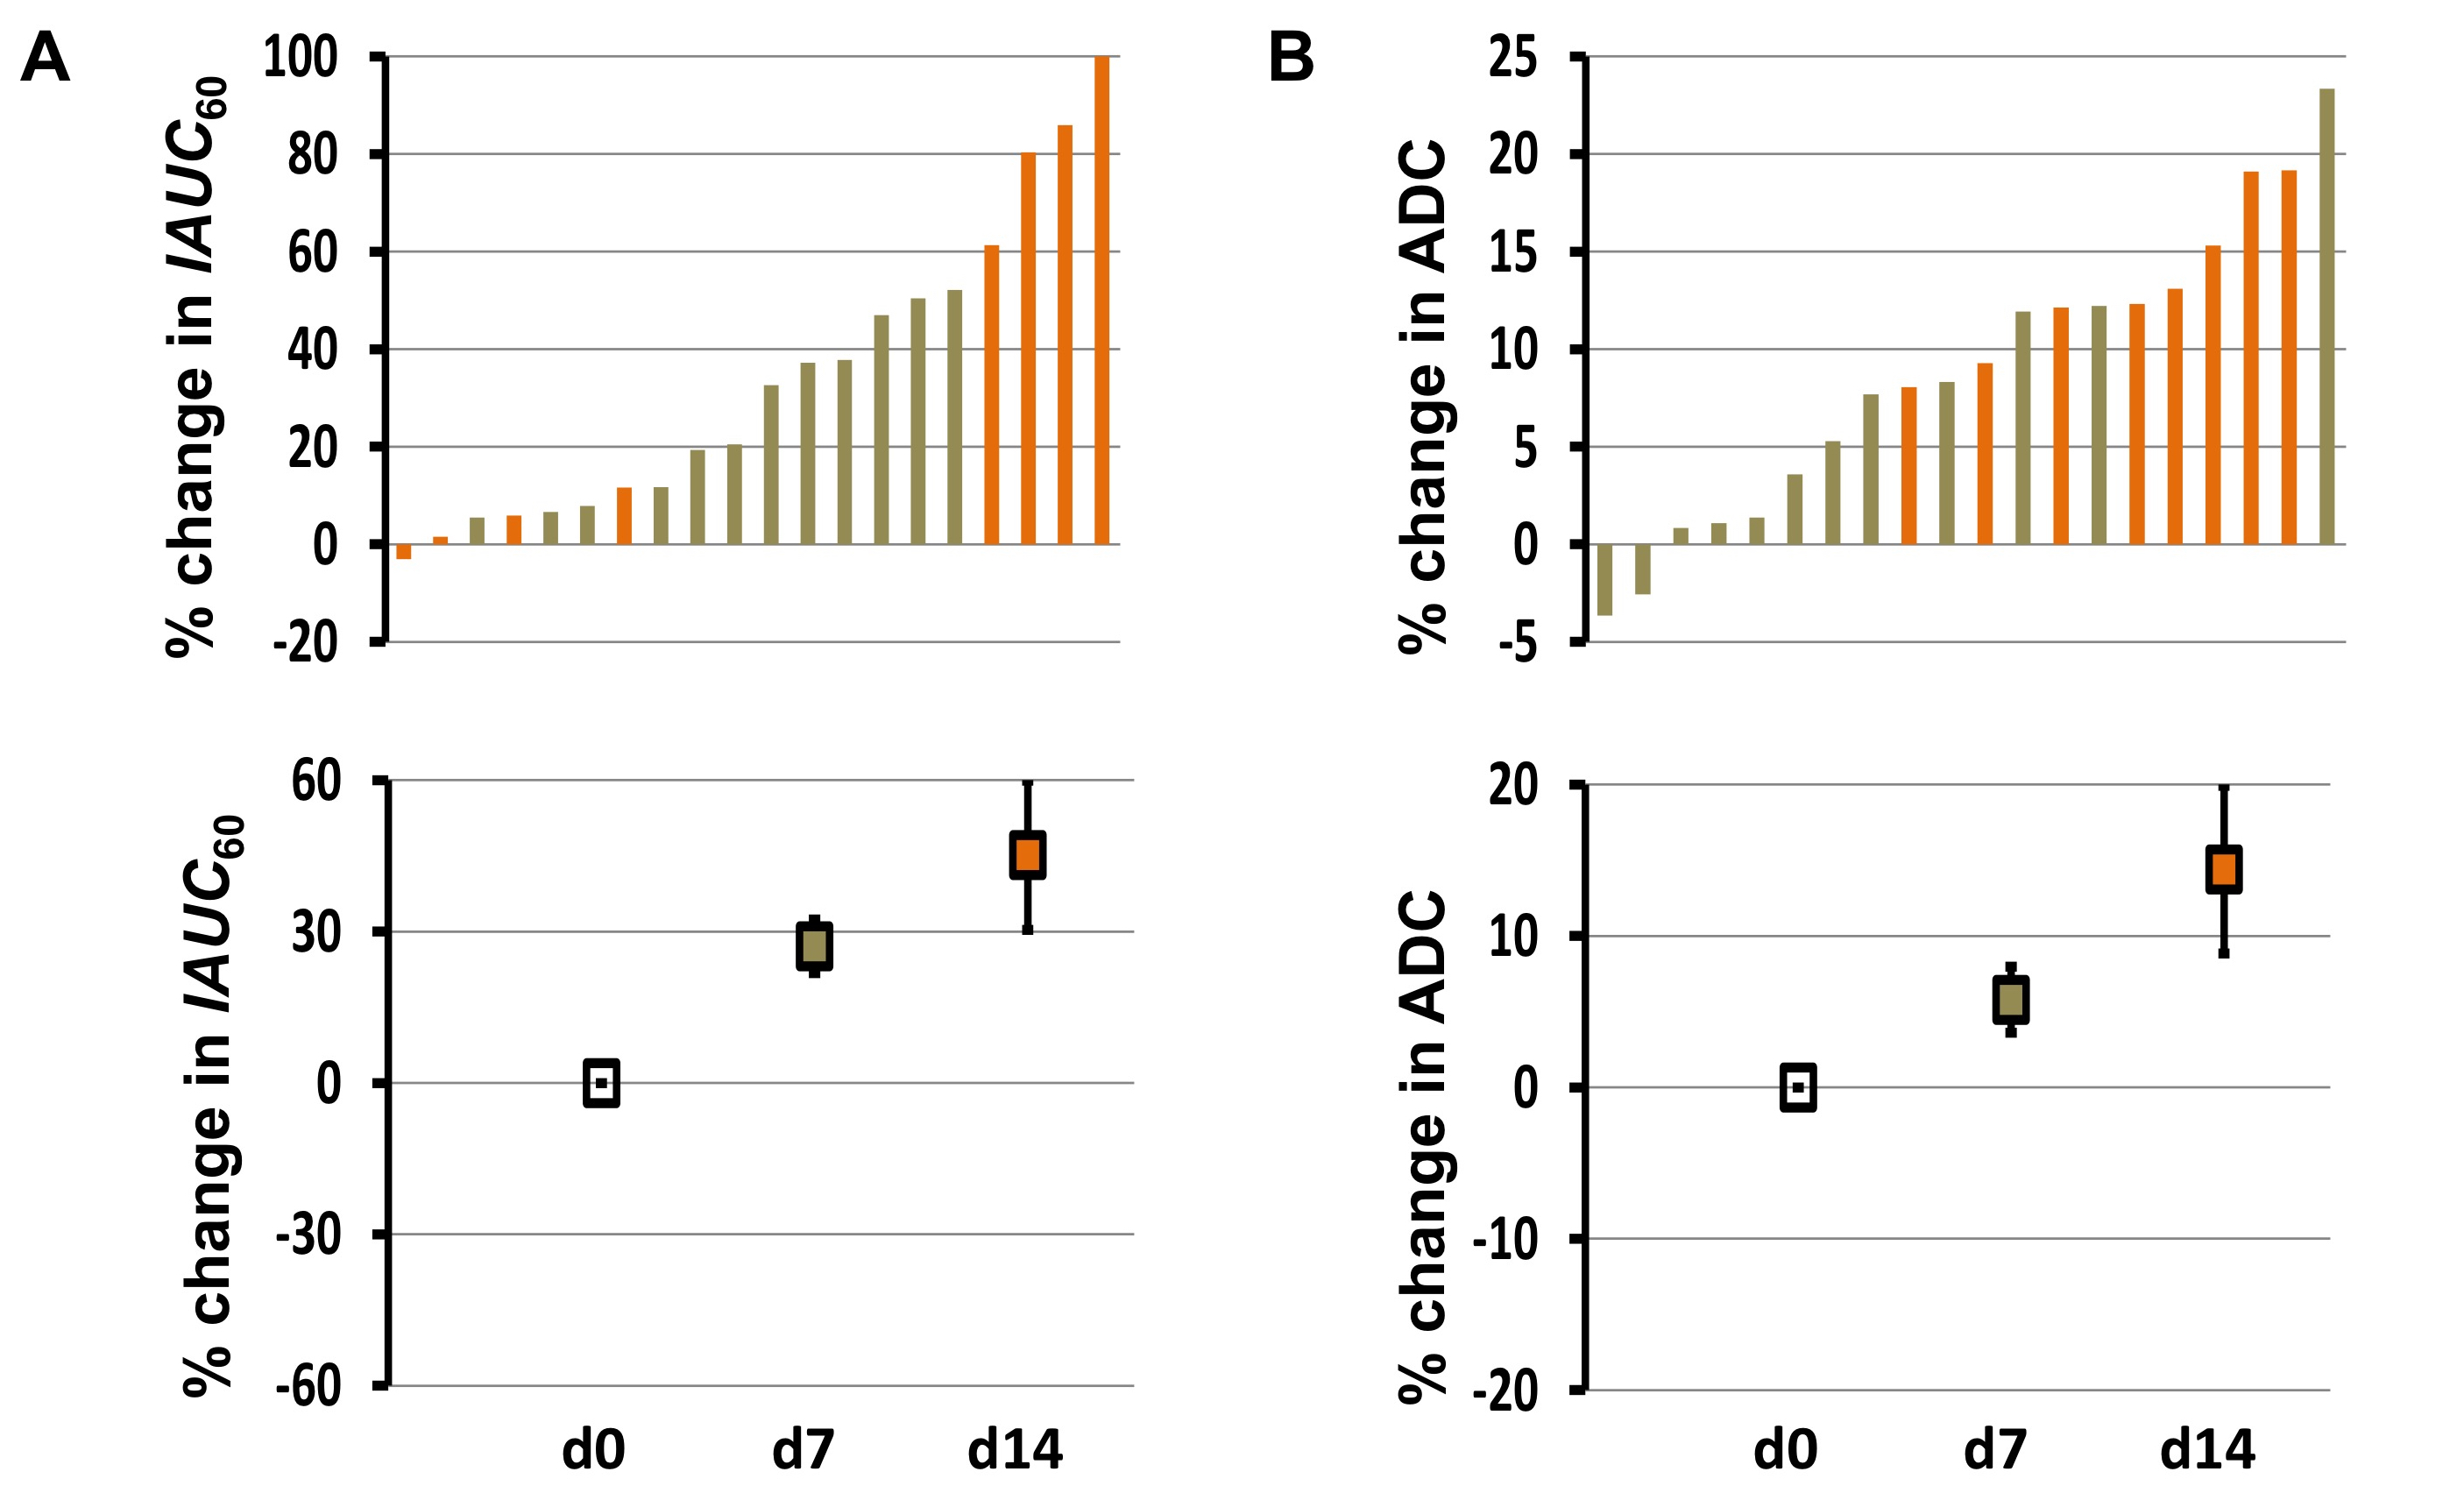
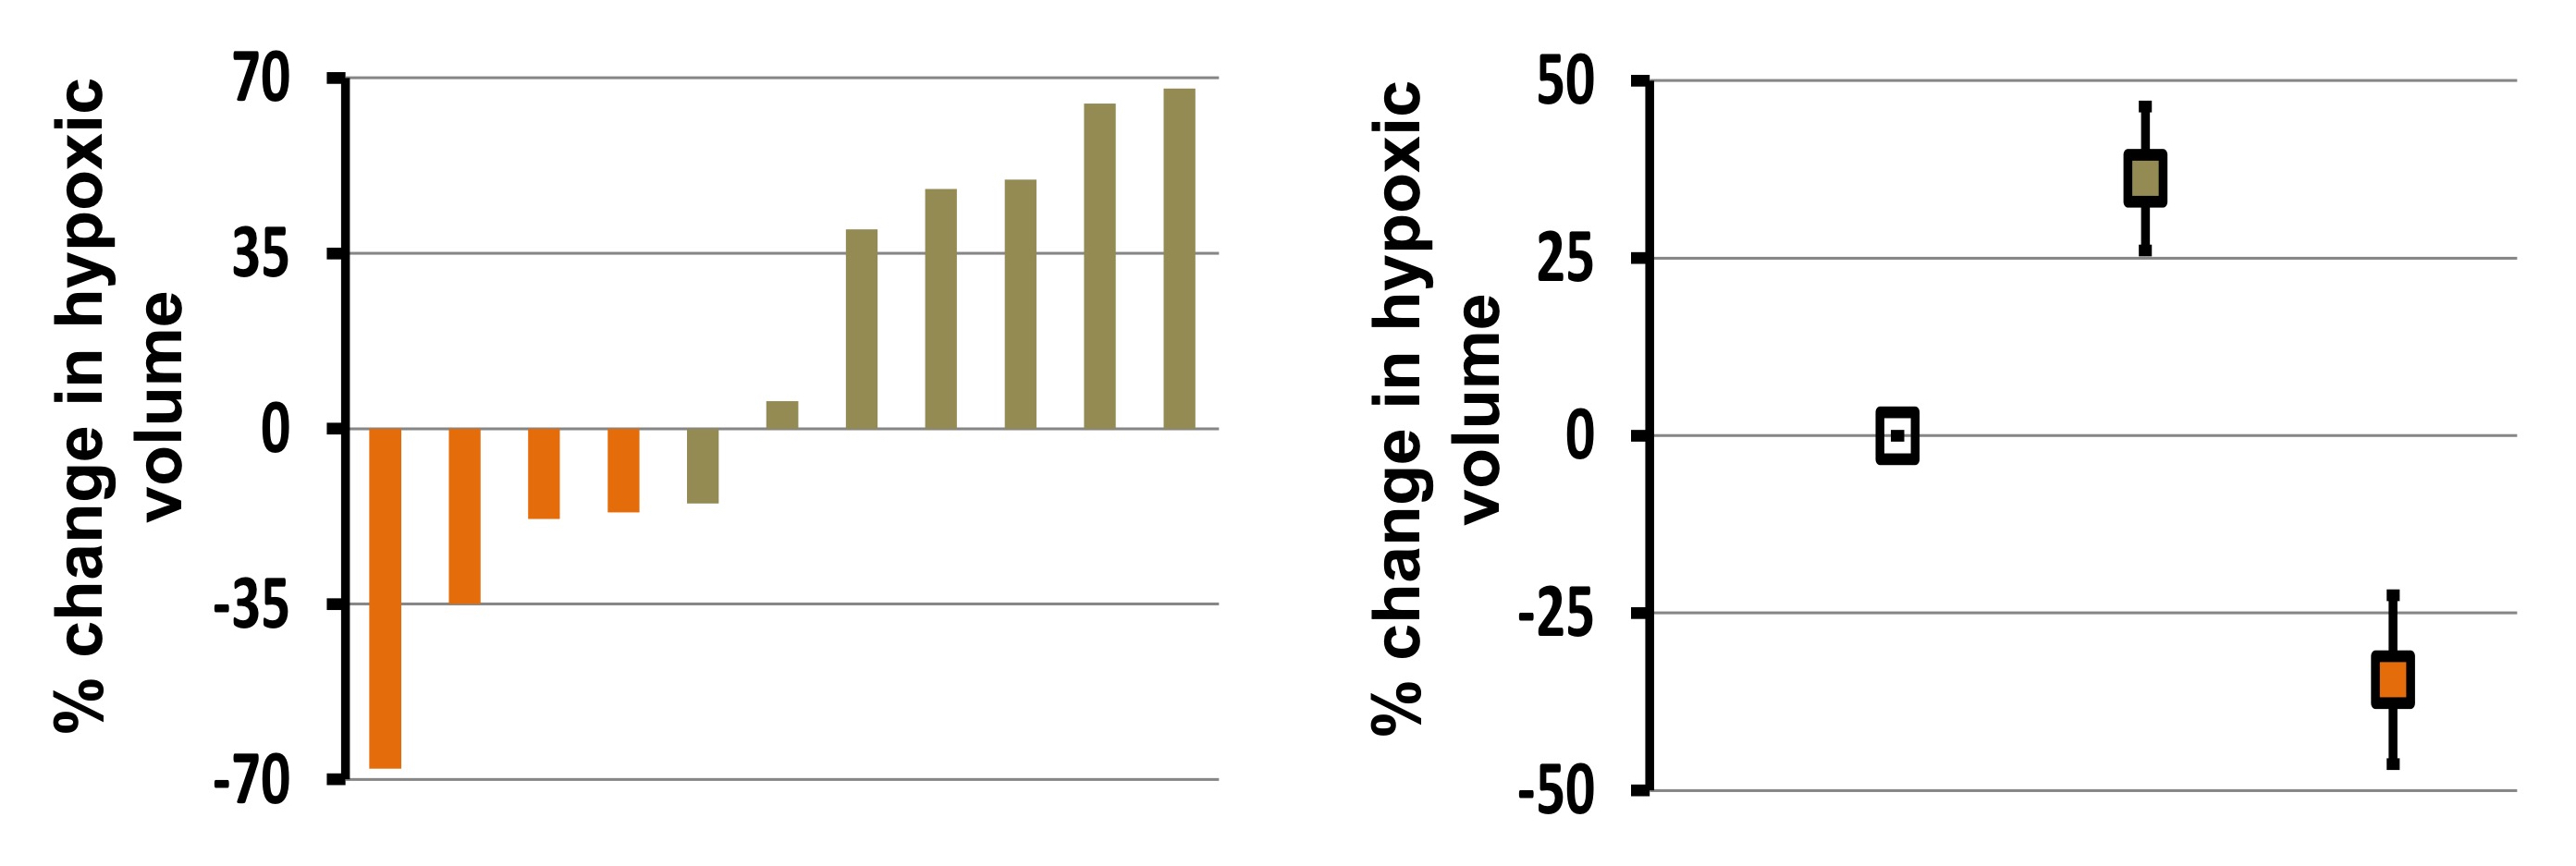
Sample OE-MRI traces (Figure 1) and representative images are shown (Figure 2). 14 patients had MRI at days 0 and 7, while 8 patients had MRI at days 0 and 14. The median IAUC60 was significantly increased by 27.4% at day 7 and by 45.1% at day 14, but there was no significant difference between the increases detected at these two times (p=0.327; unpaired t-test; Figure 3A). The median ADC was significantly increased by 5.8% at day 7 and by 13.6% at day 14 with the incremental increase being significant (p=0.008; unpaired t-test; Figure 3B). In distinction, the hypoxia biomarker pOxy-R showed opposing effects between day 7 (37.2% increase in hypoxia) and day 14 (34.4% reduction in hypoxia; p=0.003; Figure 4).Discussion
Rectal tumours had an increase in ADC and perfusion/permeability (indicated by IAUC60) following chemoradiotherapy, consistent with an acute flare effect. While the effect increased at day 14 compared to day 7, biomarker changes were on a continuous spectrum. This implies DCE-MRI and DWI could have a role in patient stratification (a hypothesis that requires testing in subsequent well powered studies).
In distinction, reduction in tumour hypoxia measured by OE-MRI was only apparent in tumors by day 14. Indeed, hypoxia was increased in 5/7 patients at day 7. This highlights the critical nature of measurement timing for biomarker evaluation of hypoxia and suggests a possible role for OE-MRI in monitoring pharmacodynamic change following chemoradiotherapy.
Conclusion
OE-MRI is feasible in rectal cancer tumours and provides complementary information to that measured by DWI and DCE-MRI. This pilot work suggests that hypoxia modification is detected in this patient group by day 14.Acknowledgements
Study supported by researchers at the NIHR Manchester Biomedical Research Centre. J.P.B.O. supported by Cancer Research UK personal awards (C19221/A15267, C19221/A22746). G.J.M.P. and J.P.B.O. supported by Cancer Research UK and Engineering and Physical Sciences Research Council Cancer Imaging Centre grant (C1060/10334, C8742/A18097). We thank David Higgins of Philips Healthcare for assistance in protocol development and for access to research protocols.References
1 de Lussanet QG et al., (2005) Int J Radiat Oncol Biol Phys; 63:1309-1315.
2 Nie K. (2016) Clin Cancer Res 22:5256-5264.
3 O’Connor JPB et al., (2016) Cancer Res 76:787-795.
4 Little RA et al., (2018) Radiology 288(3):739-747.
Figures