2311
Toward Quantitative MRI Parameter Mapping of Triple Negative Breast Cancer Patient-Derived Xenographs: The Challenge of Tumor HeterogeneityXia Ge1, John A Engelbach1, James D Quirk1, Larry G Bretthorst1, Joel R Garbow1,2, and Joseph JH Ackerman1,2,3
1Departments of Radiology, Washington University, St Louis, MO, United States, 2Alvin J. Siteman Cancer Center, Washington University, St Louis, MO, United States, 3Department of Chemistry, Washington University, St Louis, MO, United States
Synopsis
Triple negative breast cancer patient-derived xenographs were implanted in the 4th abdominal mammary fat pads of mice enrolled in a ~60 minute, multi-contrast, same-day (morning vs. afternoon), test-retest MRI protocol. Quantitative T1, T2, and ADC maps were acquired. Parameter distributions were characterized by standard statistical measures (mean, median, standard deviation, skewness, and kurtosis) and a Bayesian implementation of the maximum-entropy method-of-moments density function. TNBC PDX T2 maps were found to be markedly more robust to test-retest assessment compared to T1 and ADC maps. These results will inform studies employing MRI assessment of TNBC PDX response to docetaxel/carboplatin therapy.
INTRODUCTION
Within the context of the NCI co-clinical trial initiative, triple negative breast cancer (TNBC) patient-derived xenographs (PDX’s) are being characterized by preclinical MRI. A ~60-minute data acquisition pipeline has been developed that includes T1- and T2-weighted scans, quantitative T1, T2, and apparent diffusion coefficient (ADC) parameter maps, and dynamic contrast enhanced (DCE) time-course images. The goal of the project is to determine which of these MRI contrasts are most sensitive and selective in reporting/predicting response to docetaxel/carboplatin therapy and, thus, to inform an ongoing clinical trial. Because this project involves serial longitudinal monitoring of individual subjects (mice), two related questions arise: (i) how best to quantify, thus compare, parameter distribution histograms that result from PDX’s with likely heterogeneous MRI properties and (ii) how reproducible are repeated MRI observations with these TNBC PDX’s, which are implanted in the 4th (abdominal) mammary fat pad and, thus, are susceptible to respiratory motion-related imaging artifacts.METHODS
(a) MRI scanning was performed on a 4.7-T Agilent/Varian DirectDrive1 system employing a surface coil placed over the PDX for high sensitivity localized signal reception and a volume coil for homogeneous RF transmission. All images were acquired in 2D multi-slice (15 slices) mode. High-resolution T2W images were employed for PDX volume determinations: slice FOV 25.6 x 25.6 x 1 mm3, in-plane matrix 128 x 128. Multi-echo (16 echoes) T2-maps, variable flip angle (5 angles) T1-maps, and respiratory-gated ADC-maps (DTI trace) employed the same slice FOV with a reduced 64 x 64 in-plane matrix. (b) Test-retest comparisons on the same subject were employed on consecutive same-day morning vs. afternoon scanning sessions. Characterization of distribution histograms included standard statistical parameters, mean, median, variance, skewness, and kurtosis. An alternative approach employed Bayesian probability theory (https://bayesiananalysis.wustl.edu/index.html) to estimate the maximum-entropy method-of-moments density function (1) that best represented a given parameter distribution, yielding the number and value of the Lagrange multipliers (moment coefficients).RESULTS
Representative same-day, test-retest results for T2 and ADC parameter distributions (entire PDX volume) are shown in Figures 1 and 2. For small volume PDX’s the parameter distributions are rather symmetrical, characterized by essentially equivalent mean and median values and requiring only a small number of Lagrange multipliers (small number of moments) to assign the density function. (Large, highly heterogeneous PDX’s require a larger number of Lagrange multipliers; data not shown). As is evident from these representative data, the PDX T2 and ADC test-retest parameter distributions are quite similar, demonstrating good measurement reproducibility. (Parameter maps obtained with ground-truth phantoms demonstrated good accuracy; data not shown.) A more quantitative assessment of test-retest robustness is provided by Bland Altman (BA) analysis (3). Multiple (seven or eight) mice bearing TNBC PDX were examined by same-day (morning and afternoon) test-retest spaced over a ~3-month period. PDX volume determinations via manual segmentation of the high-resolution T2W images showed high precision with < 10% uncertainty in volume estimation for PDX’s with volumes ranging from ~50 to 300 microliters (data not shown). Figures 3-5 show BA analysis for same-day test-retest ADC, T2, and T1 distributions: precision of distribution means, as quantified by the +/- repeat measurement 95% confidence intervals is best with T2-maps (~7%) and substantially lower with ADC- and T1-maps (~30% and ~37%, respectively). BA analysis of other statistical parameters characterizing T2, ADC, and T1 same-day test-retest distributions is provided in Figures 3-5.DISCUSSION
Serial longitudinal monitoring of quantitative MRI parameter distributions as indices for predicting and assessing tumor therapeutic response requires assessment of test-retest precision of the parameters characterizing the parameter distributions. This work is the first step in such assessment with TNBC PDX’s implanted in abdominal mammary fat pads. The measurement is challenged by the signal-to-noise achievable in a ~60 minute multi-contrast scanning protocol and residual subject respiratory motion. At the current stage as quantified by distribution means, a T2 map is ~3 to 5 times more robust in a test-retest sense (percentage-wise difference in means) than are ADC and T1 maps.CONCLUSION
A test-retest assessment of MRI (T1, T2, ADC) precision has been accomplished for TNBC PDX’s implanted in mouse abdominal mammary fat pads. T2 maps were found to be markedly more test-retest robust compared to T1 and ADC maps. Ongoing work will establish the degree to which this is due to signal-to-noise limitations of a multi-contrast ~60 minute scanning protocol and/or the effects of residual respiratory motion.Acknowledgements
U24 CA209837, Washington University Co-Clinical Imaging Research Resource, KI Shoghi, PI; Siteman Cancer Center Small-Animal Cancer Imaging Shared Resource (Cancer Center Support Grant P30 CA91842, TJ Eberlein, PI).References
(1) Shannon CE. A mathematical theory of communication. Bell System Tech J. 1948;27:379-423 & 623-656. (2) G. Larry Bretthorst GL. The maximum entropy method of moments and Bayesian probability theory. AIP Conf Proc. 2013;1553:3-15. (3) D. Giavarina D. Understanding Bland Altman analysis. Biochemia Medica. 2015;25(2):141-51.Figures
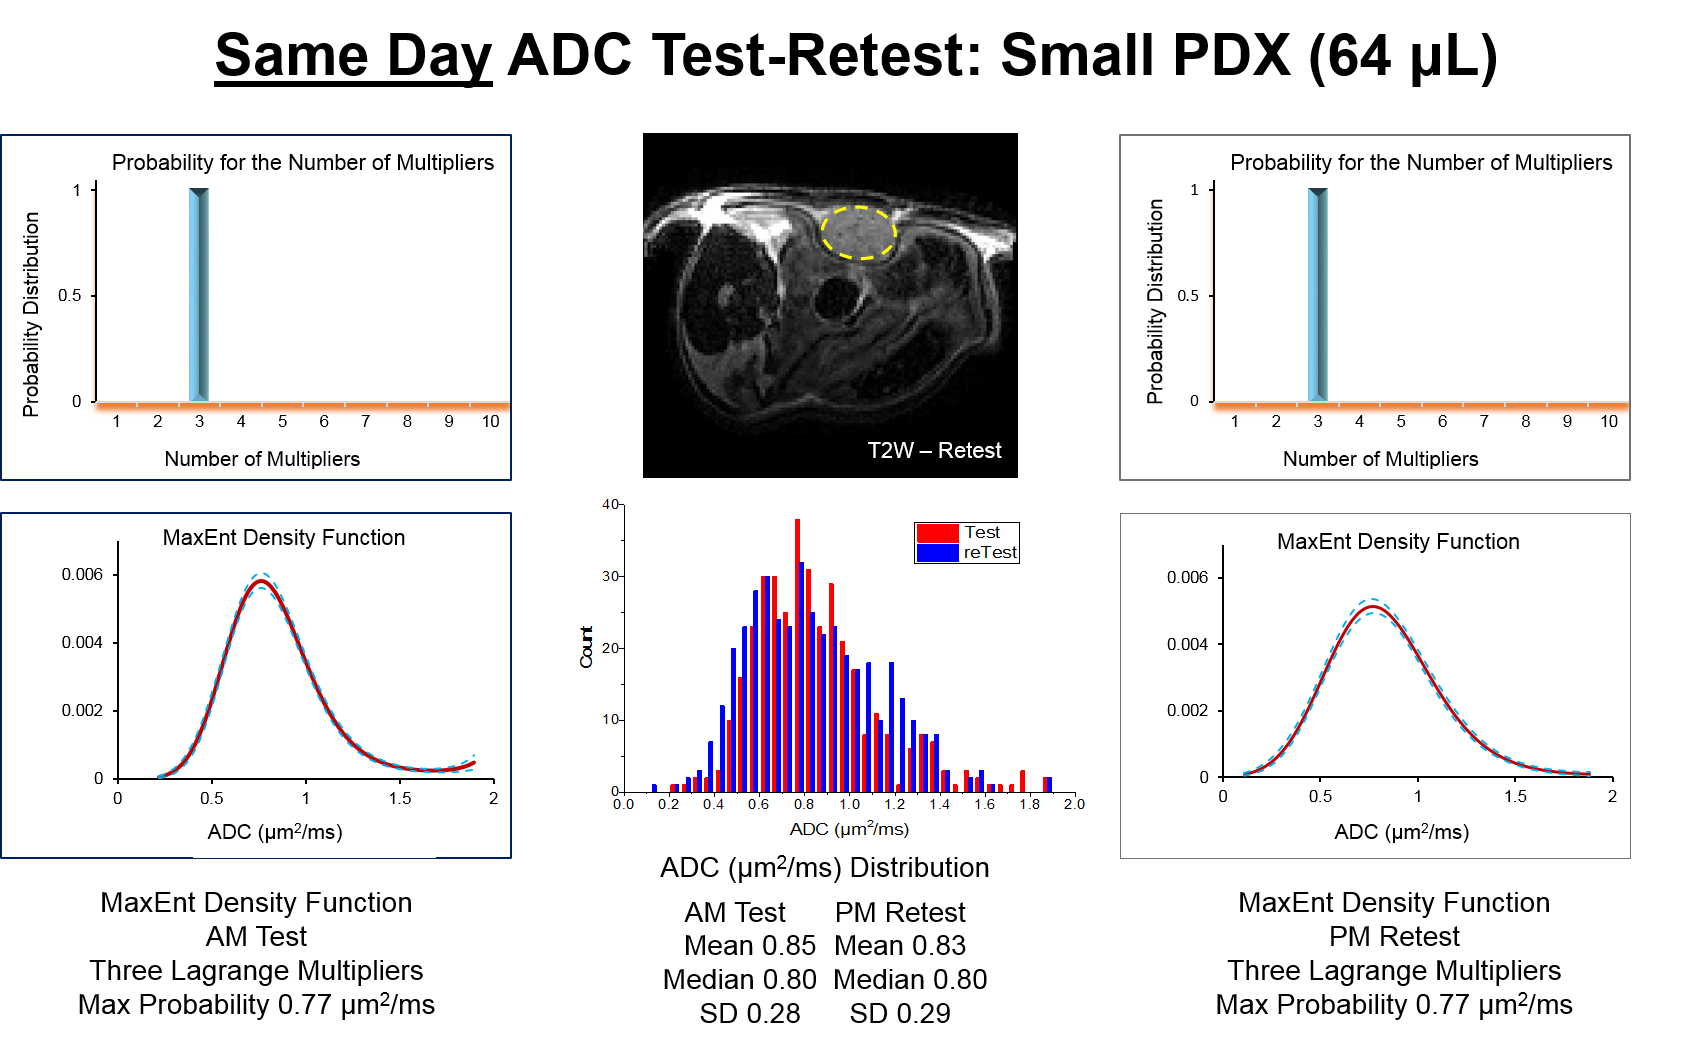
Figure 1. Same-day (morning and afternoon) ADC test-retest
example for a small (64 µL) TNBC PDX tumor (dashed yellow region of interest).
The middle panel shows a single T2W transverse slice through the tumor (top)
and overlaid binned test-retest ADC histograms (middle) for the entire tumor
volume. The distribution mean, median, and standard deviation are shown below
the histogram. The left and right panels show the results for the maximum
entropy density function analysis.
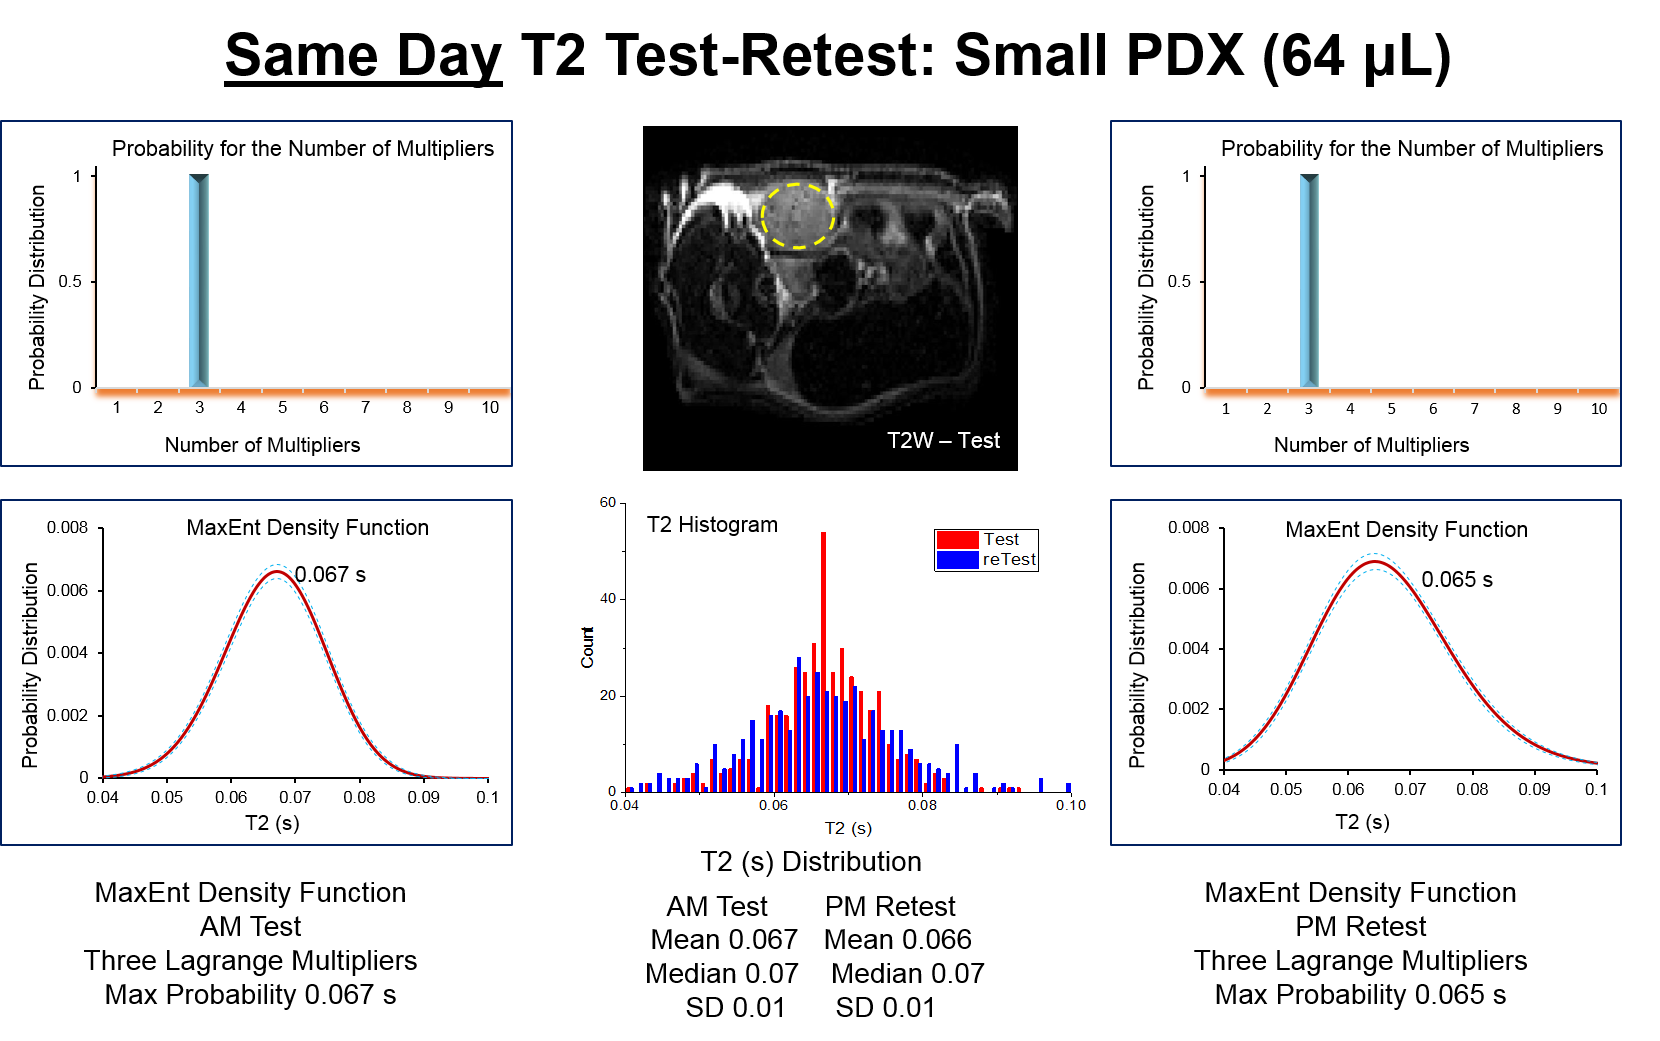
Figure 2. Same-day (morning and afternoon) T2 test-retest
example for the same TNBC PDX tumor as in Figure 1. The middle panel shows a
single T2W transverse slice through the tumor (top) and overlaid binned test-retest
T2 histograms (middle) for the entire tumor volume. The distribution mean, median,
and standard deviation are shown below the histogram. The left and right panels
show the results for the maximum entropy density function analysis.
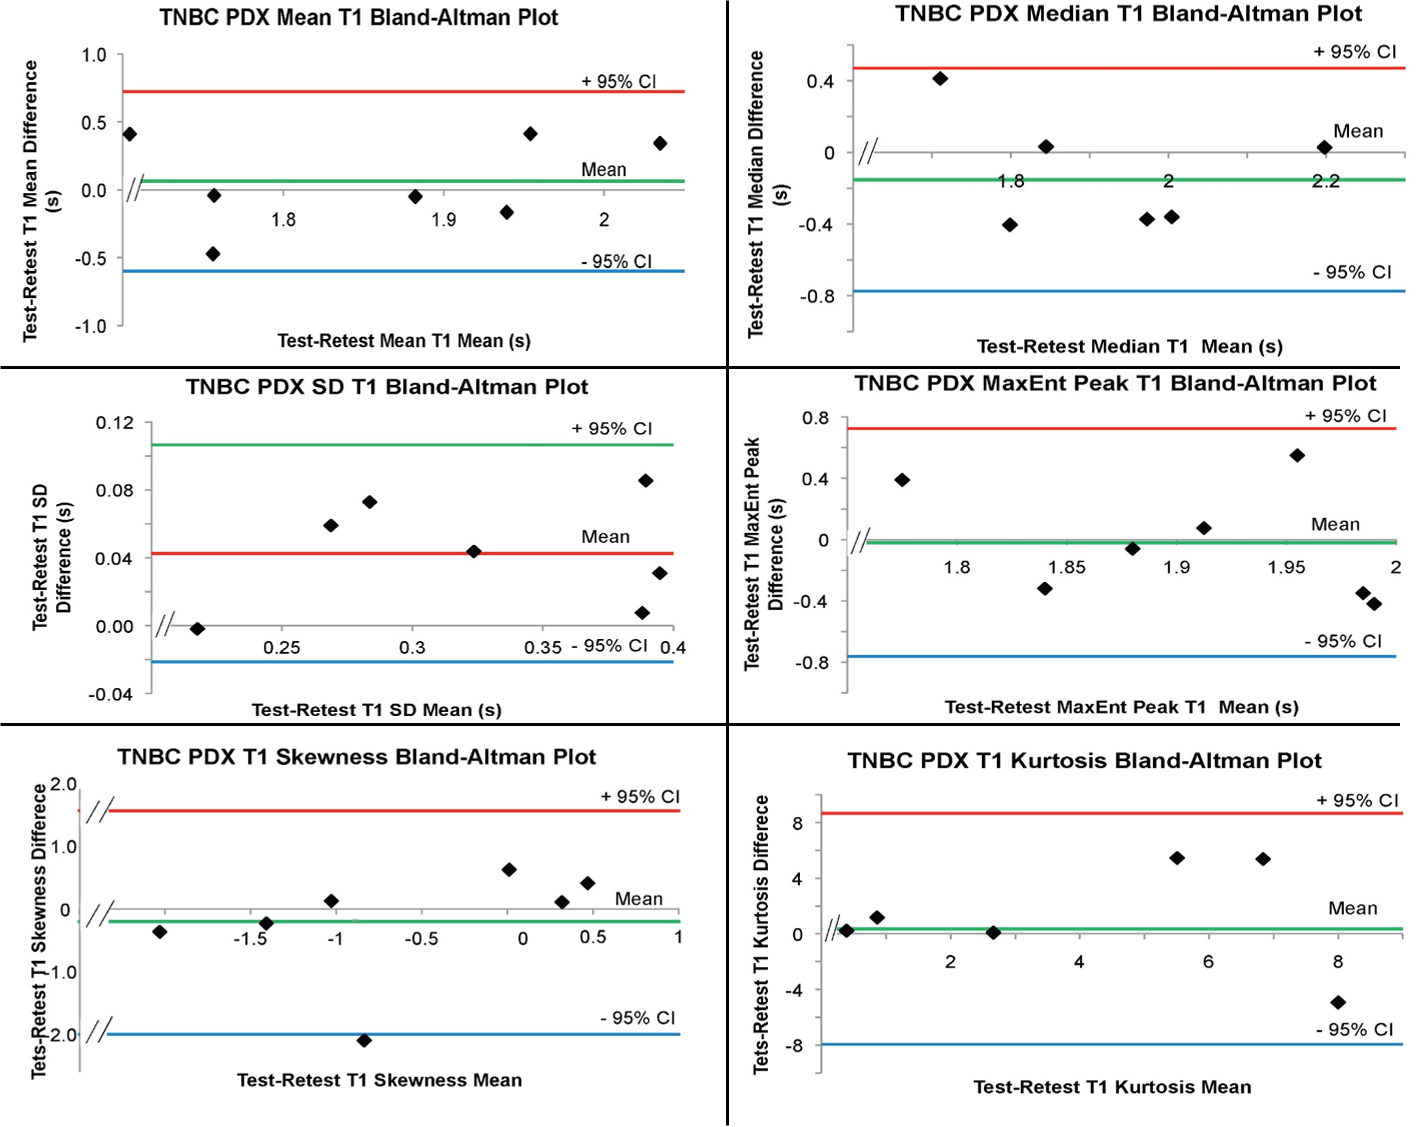
Figure 3. Bland Altman analysis of various
parameters characterizing TNBC PDX T1 distributions obtained from same-day
(morning and afternoon) test-retest scanning.
Shown are Bland Altman plots for the following test-retest T1
distribution parameters: mean, median, standard deviation, peak value of the
maximum entropy method of moments density function, skewness, and kurtosis.
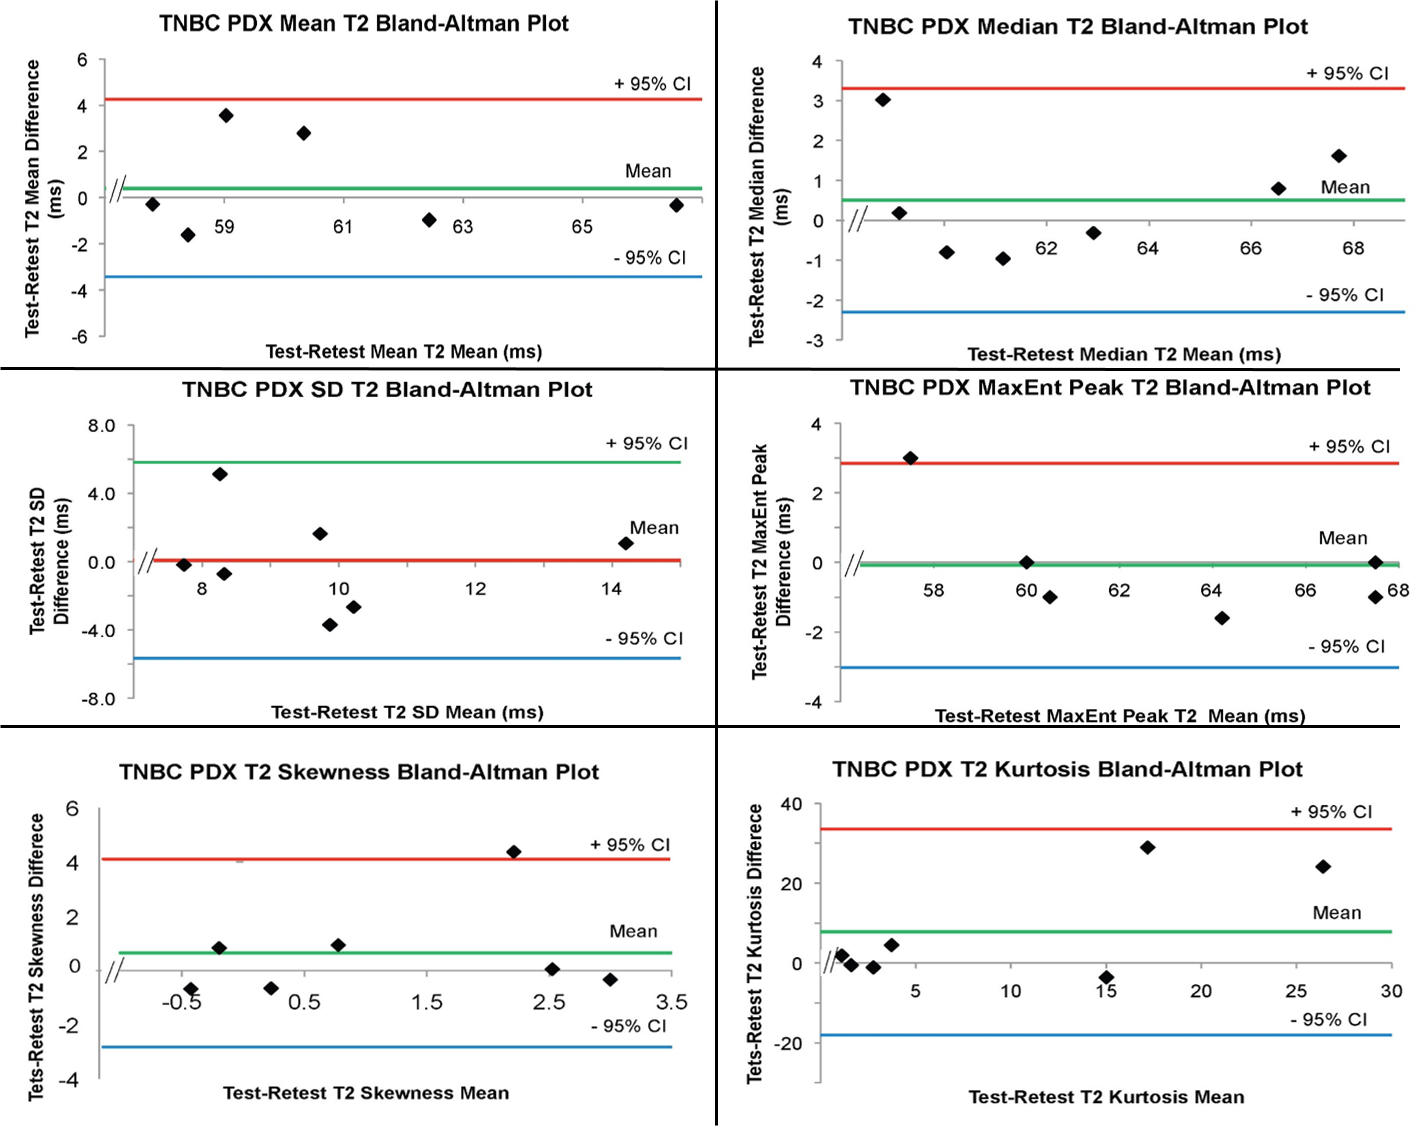
Figure 4. Bland Altman analysis of various
parameters characterizing TNBC PDX T2 distributions obtained from same-day
(morning and afternoon) test-retest scanning.
Shown are Bland Altman plots for the following test-retest T2
distribution parameters: mean, median, standard deviation, peak value of the
maximum entropy method of moments density function, skewness, and kurtosis.
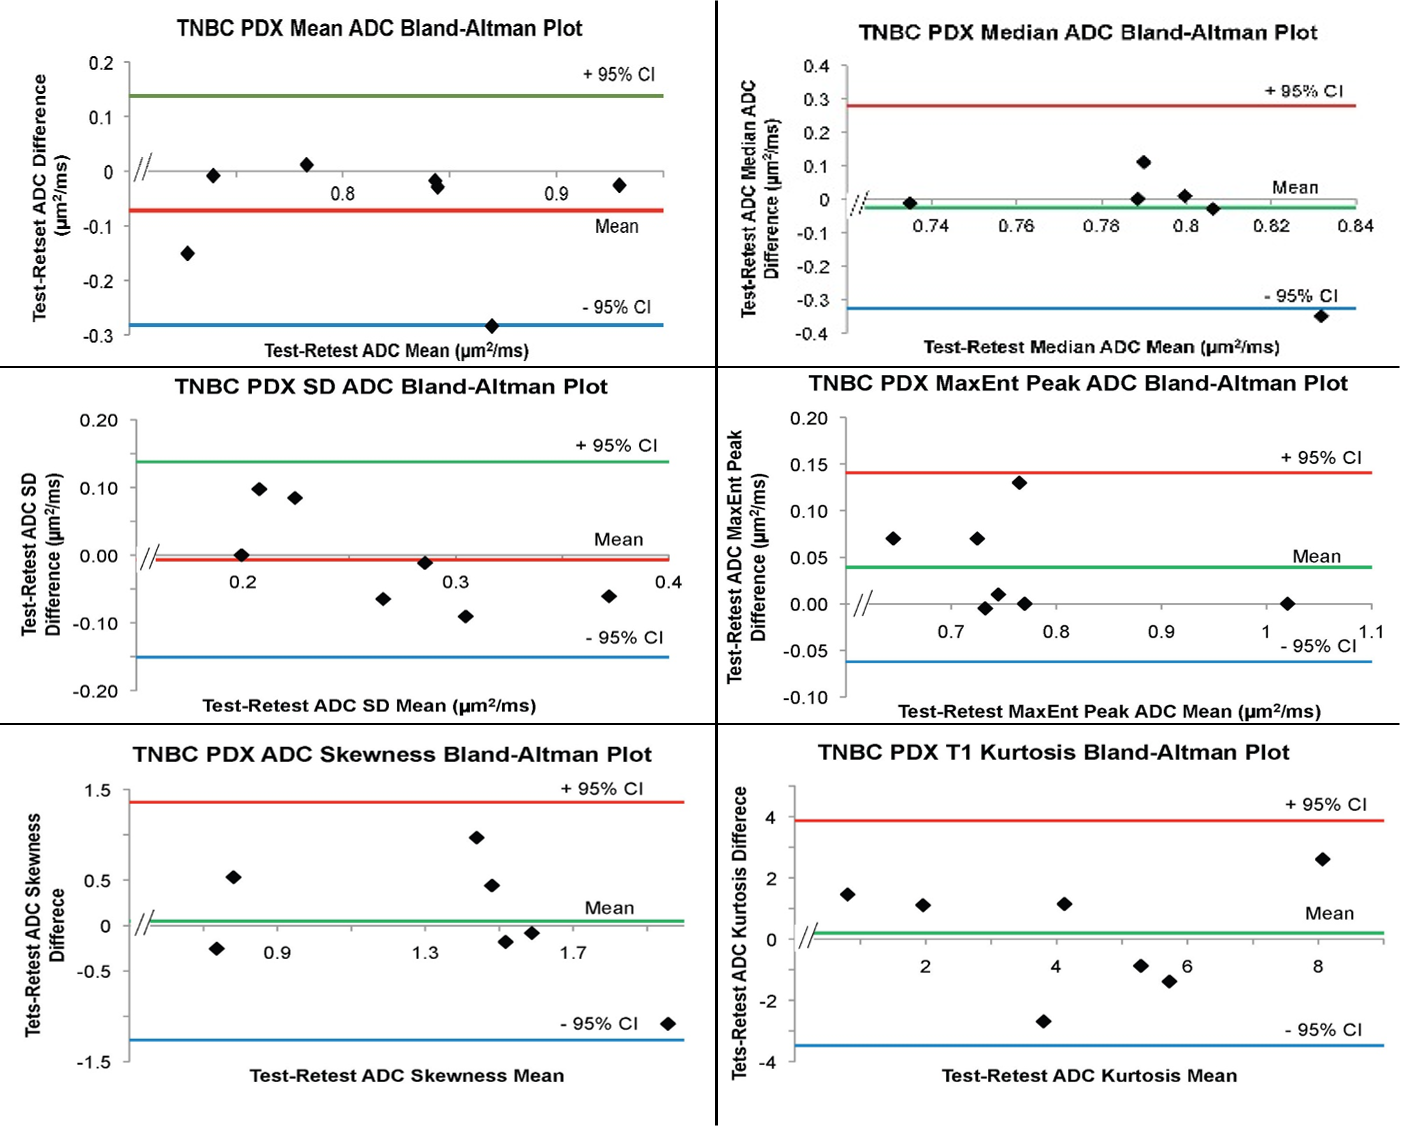
Figure 5. Bland Altman analysis of various
parameters characterizing TNBC PDX ADC distributions obtained from same-day
(morning and afternoon) test-retest scanning.
Shown are Bland Altman plots for the following test-retest ADC
distribution parameters: mean, median, standard deviation, peak value of the
maximum entropy method of moments density function, skewness, and kurtosis.