2310
Time evolution of extracellular pH with BIRDS in a rabbit model of human liver cancer1Radiology & Biomedical Imaging, Yale University, New Haven, CT, United States, 2Biomedical Engineering, Yale University, New Haven, CT, United States, 3Visage Imaging, Inc., San Diego, CA, United States, 4Cardiovascular Medicine, Yale University, New Haven, CT, United States
Synopsis
Here we report extracellular pH (pHe) mapping with BIRDS using TmDOTP5- in normal and VX2 tumors in rabbit liver tissue. Transarterial chemoembolization (TACE) was performed and the rabbits were scanned without TACE, or at 1 day and 2 weeks post TACE. The pHe maps show lower pHe in tumor and tumor edge compared to normal liver. Tumor acidity prior to TACE remain at 1 day post TACE, but it is almost normalized at 2 weeks post TACE. The ability to measure pHe in a translational model and compare it with “normal” tissue improves tumor detection and monitoring of tumor treatment.
Introduction
Hepatocellular carcinoma is the second leading cause of cancer-related deaths worldwide and incidence and mortality rates continue to rise yearly.1,2 The efficacy of non-surgical therapies remains limited because the treated lesions and their microenvironment demonstrate unpredictable biochemical and physiological characteristics that promote tumorigenesis and reflect the aggressiveness of the tumor.3 Maps of extracellular pH (pHe) can be measured in vivo using Biosensor Imaging of Redundant Deviation in Shifts (BIRDS). BIRDS uses the macrocyclic chelate DOTP8- (1,4,7,10-tetraazacyclododecane-1,4,7,10-tetrakis(methylenephosphonate)) complexed with paramagnetic thulium (Tm3+) ion, and has been studied in tumor models in rat brain, on preclinical scanners.4-6 In this work we report pHe mapping with BIRDS on a 3T clinical scanner in rabbit liver. We measured pHe in normal and tumor liver tissues in a model of human liver cancer (VX2), which are highly vascularized and hyper-glycolytic. This tumor model has been previously used for translational studies involving intra-arterial therapies for liver cancer treatment.7,8Methods
Seventeen New Zealand white rabbits were surgically implanted with VX2 tumors9, which were allowed to grow for two weeks to 10-15 mm diameter. Transarterial chemoembolization (TACE) was performed using an emulsion of ethiodized oil (Lipiodol, Guerbet) and doxorubicin delivered to tumor by intra-arterial super-selective injection via the tumor-supplying branch of the hepatic artery. The rabbits were scanned either without TACE (n=6), 1 day post TACE (n=3), or 2 weeks post TACE (n=8). A dose of 0.5mmol/kg TmDOTP5- was used to obtain pHe maps. 15ml of TmDOTP5- was infused at a rate of 0.5ml/min for 30 min. The MR data was obtained on a 3T Prisma scanner (Siemens, Erlangen, Germany) using a 15 channel RF coil. The T1 VIBE images were obtained using a FOV of 20x20cm2, 384x384 matrix, 60 slices of 2.5mm thickness, TR=5.2ms and TE=2.5ms. The BIRDS data was acquired using a 3D GRE chemical shift imaging (CSI) sequence. Because paramagnetic probes like TmDOTP5- possess extremely short T1 and T2 relaxation times (0.1-10ms) and wide bandwidths (±200ppm), a GRE CSI sequence was used (instead of spin-echo), modified to obtain short TE and TR. Water suppression was achieved using a dual-band 640µs Shinnar-Le Roux (SLR) RF pulse which selectively excited the peaks of interest (10kHz bandwidth) on either side of water. The CSI was acquired with a FOV of 20x20x25cm3, 2197 rectangular encoding steps, TR=8ms (limited by SAR), 6min acquisition, and reconstructed to 25x25x25 with a voxel resolution of 8x8x10mm3. The pHe was calculated from the H2, H3 and H6 chemical shifts of TmDOTP5-.4Results
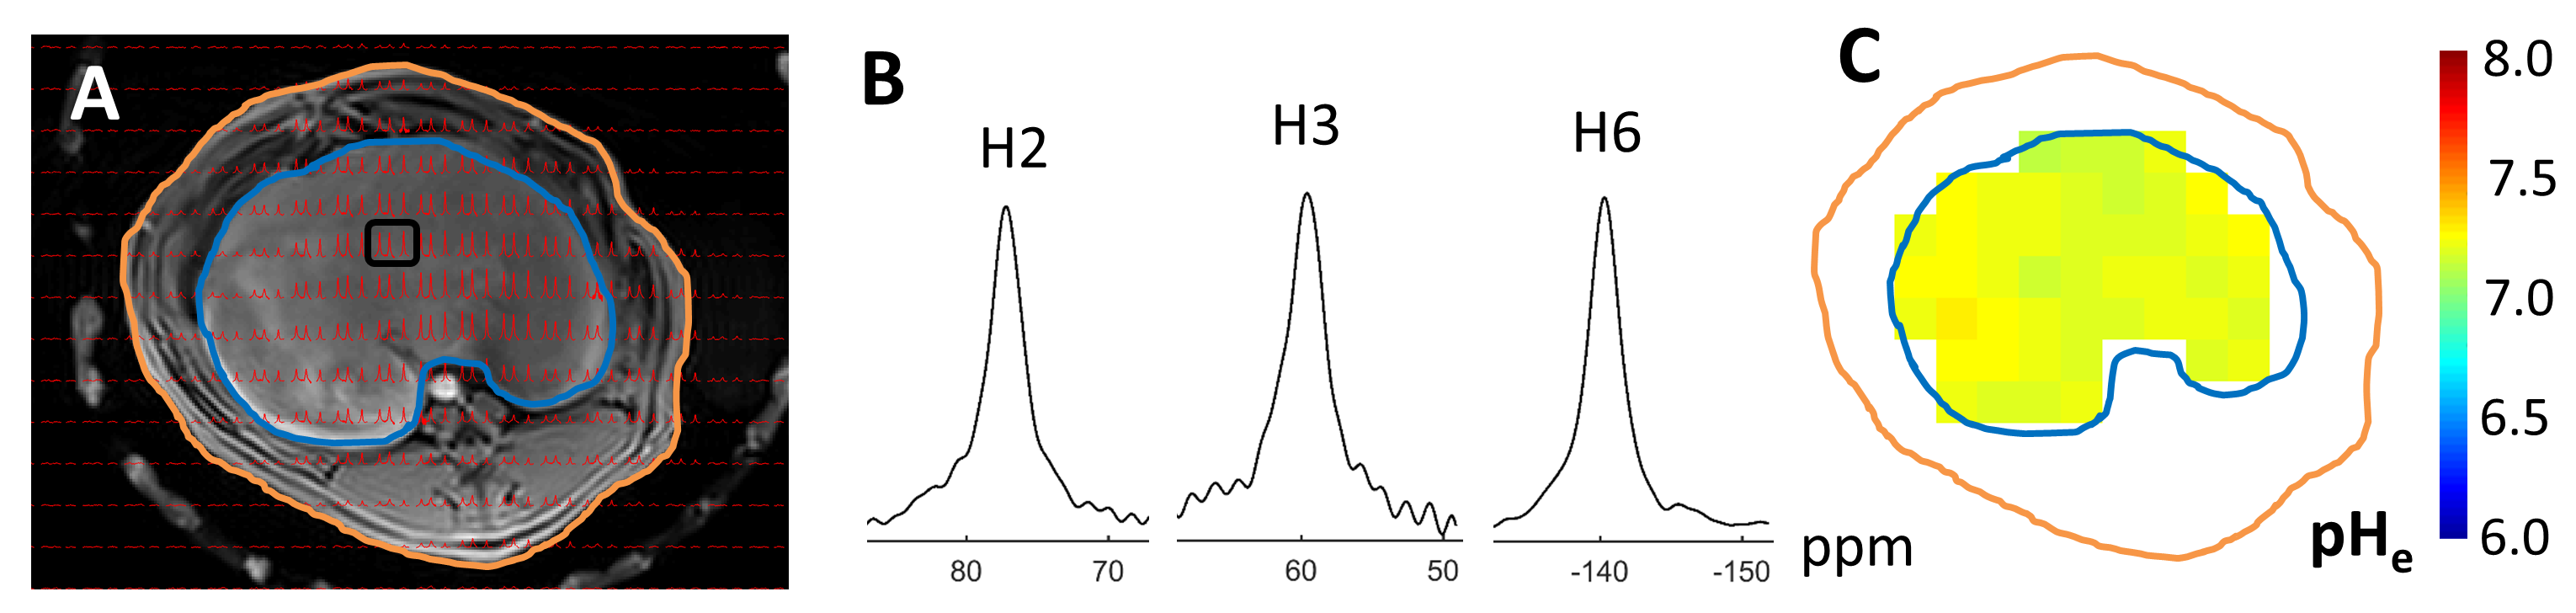
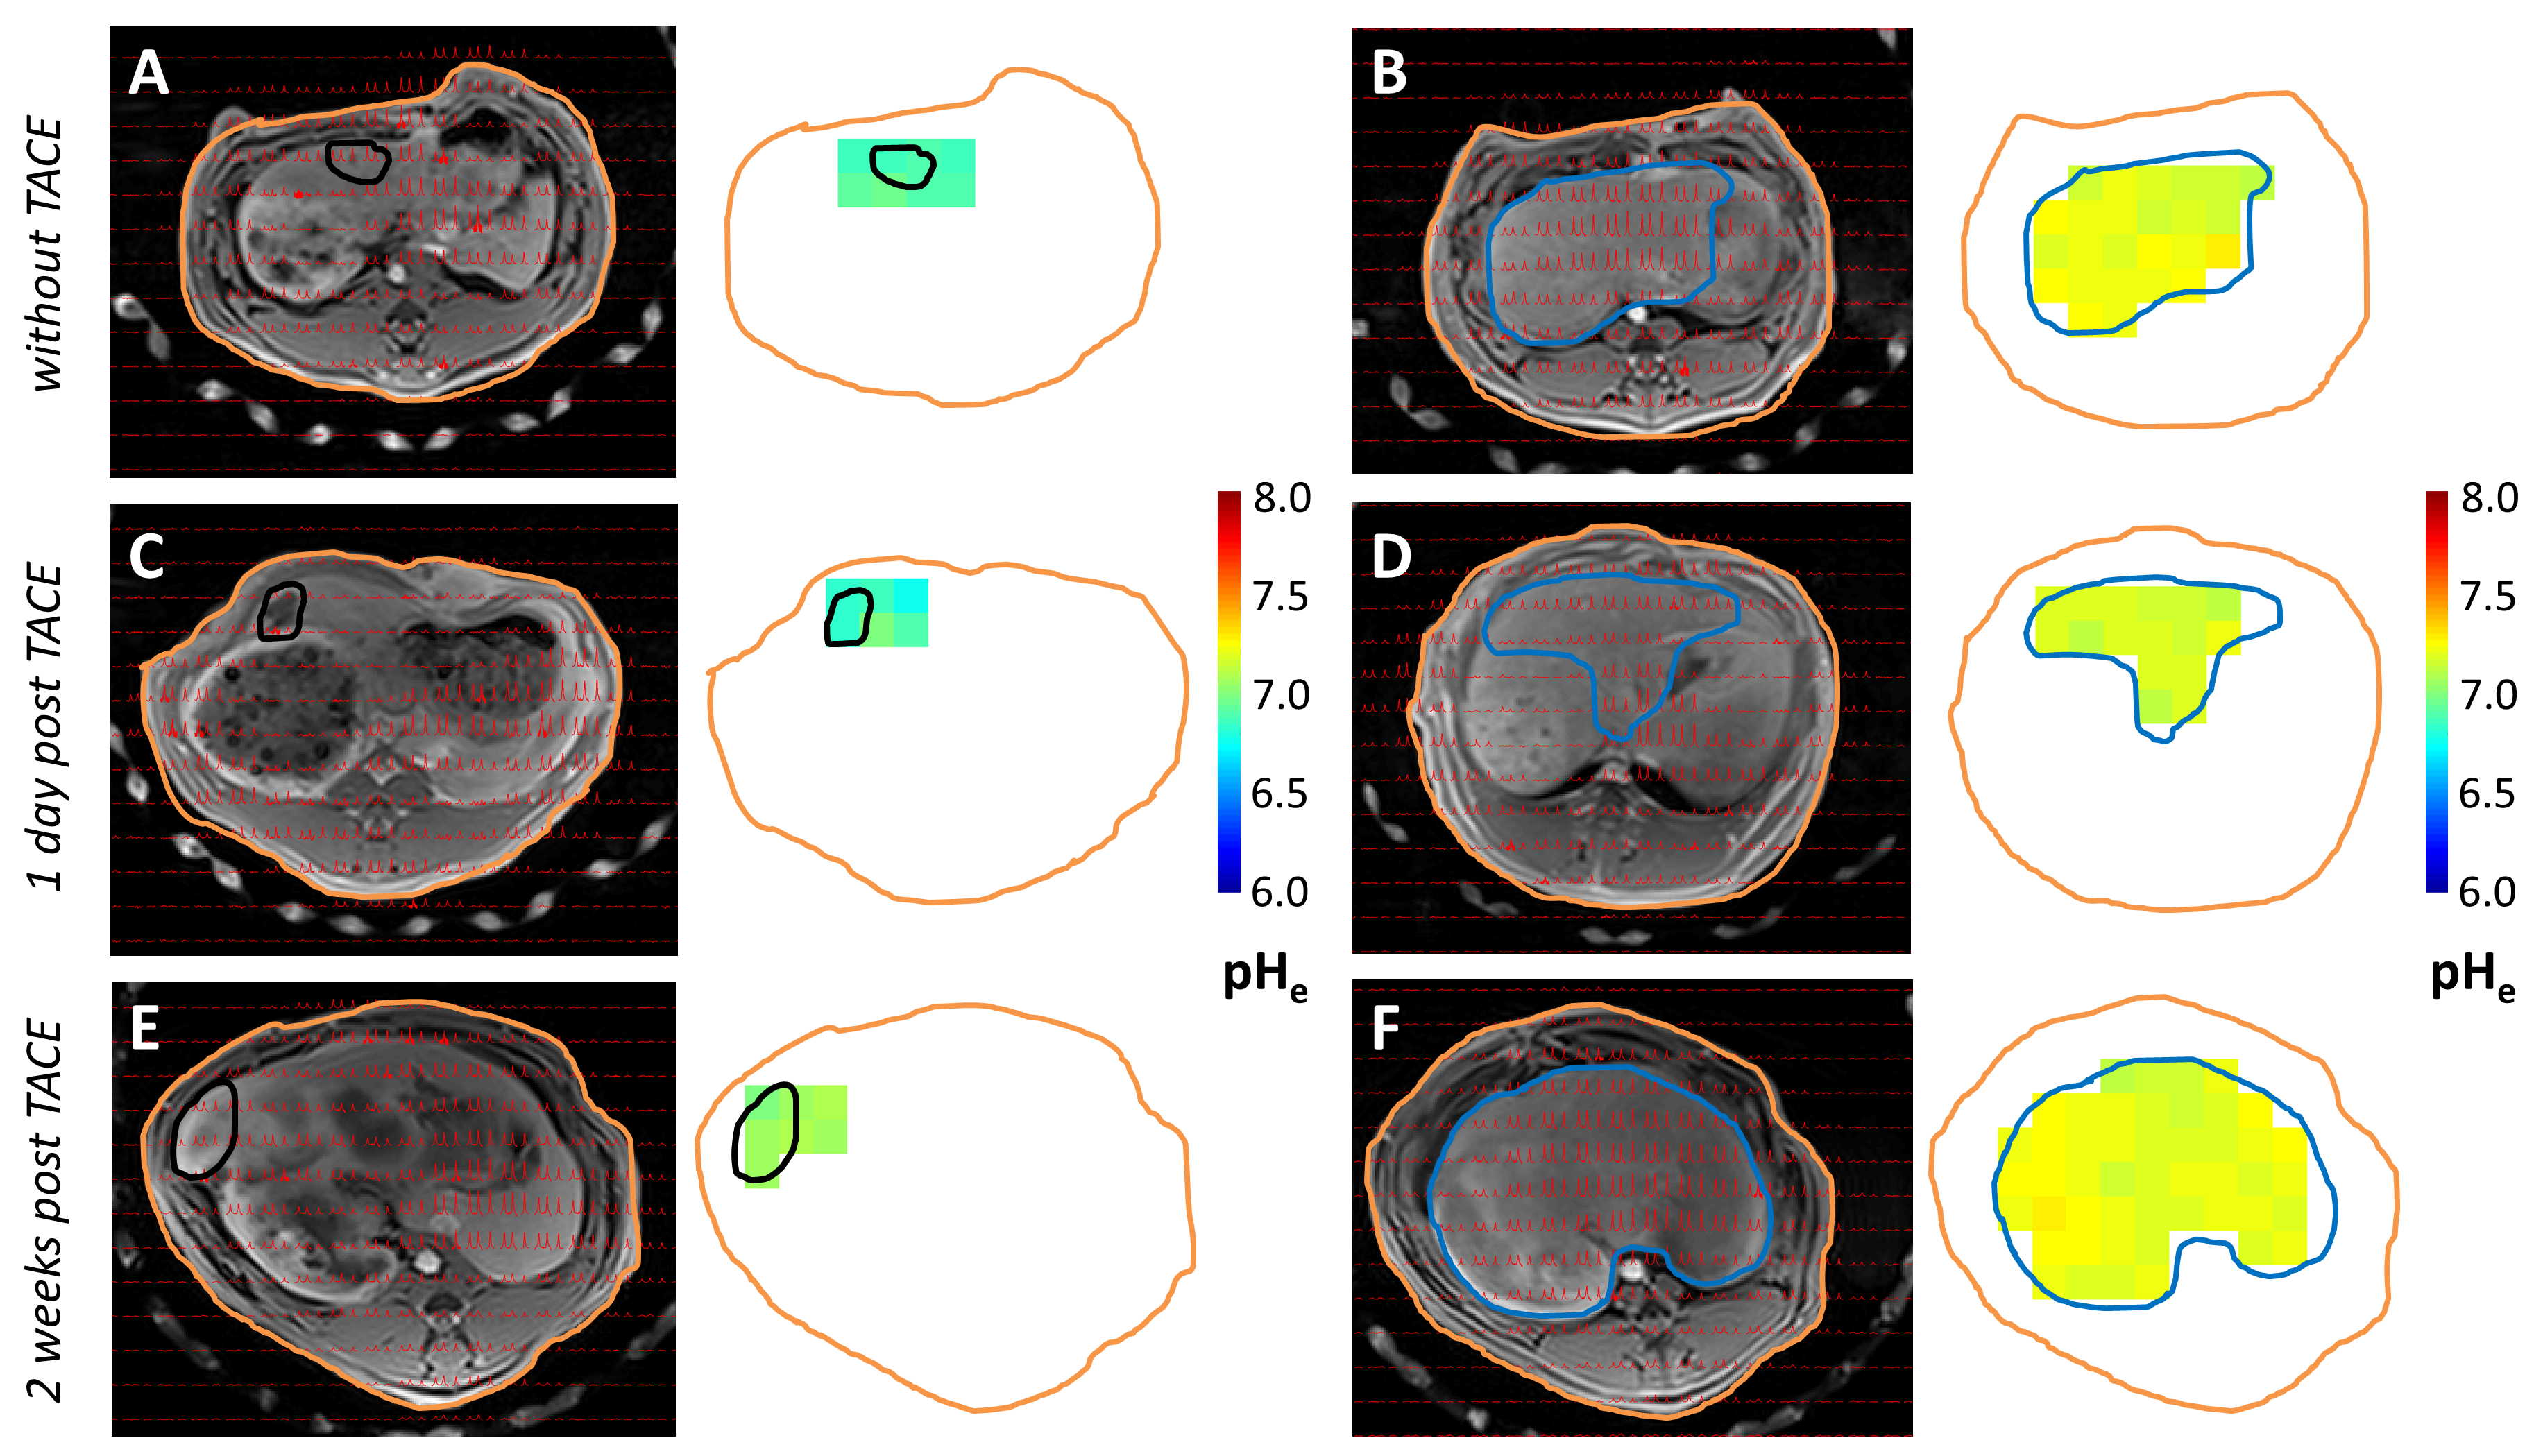
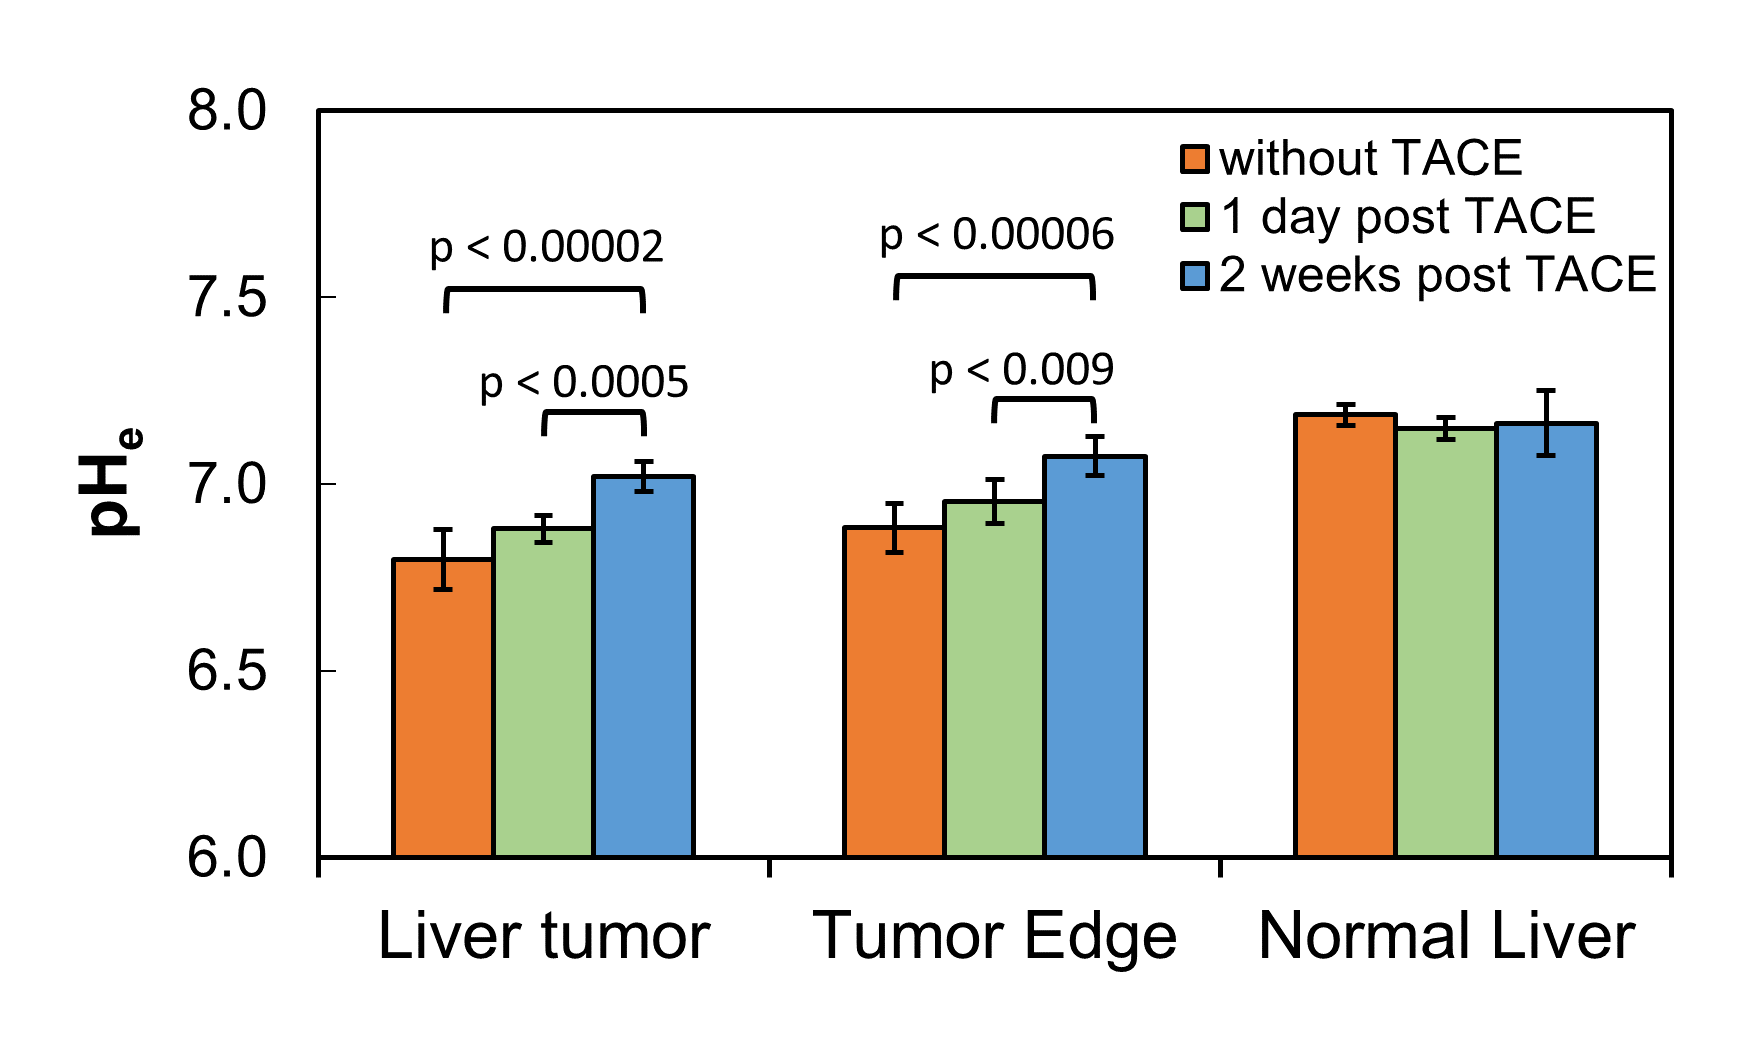
An example of pHe mapping of rabbit liver with BIRDS is shown in Fig.1. The CSI signals (red) were overlaid on a T1 VIBE image (Fig.1A). The chemical shifts of H2, H3 and H6 protons of TmDOTP5- (Fig.1B) were used to calculate the pHe maps (Fig.1C). Examples of pHe mapping with BIRDS in liver without TACE, at 1 day and at 2 weeks post TACE are shown in Fig.2. The T1 VIBE images were used for tumor localization (Fig.2, black) and to delineate normal liver regions (Fig.2, blue). BIRDS using the H2, H3 and H6 TmDOTP5- protons (Fig.2, red) was used to generate pHe maps of liver tumor (Fig.2A, 2C and 2E) and normal liver (Fig.2B, 2D and 2F). The pHe maps show a distinctly lower pHe in the tumor and edge areas compared to normal liver. An average pHe was calculated in each animal from the CSI voxels located inside the corresponding liver region, at each time point prior to or post TACE (1 day, and 2 weeks). Fig.3 shows acidity in tumors prior to TACE (pHe=6.80±0.08), which remain at 1 day post TACE (pHe=6.88±0.04), but it is shifted towards normalized values at 2 weeks post TACE (pHe=7.02±0.04). Similar low pHe values were observed at the edge of the tumor, while in normal liver the pHe values were within the range of 7.1-7.2 at all time points.Discussion
This work demonstrates for the first time the feasibility of obtaining pHe maps with BIRDS on a clinical scanner. The results indicate a low pHe (pHe=6.80±0.08) in the VX2 tumors without TACE. A gradual increase in time towards pHe normalization was indicated by the pHe values at 1 day (pHe=6.88±0.04) and 2 weeks (pHe=7.02±0.04) post TACE. However, these values are still lower than the average pHe value of normal liver (pHe=7.19±0.03) measured in rabbits without TACE (Fig.3). In conclusion, the ability to measure pHe distributions in a translational liver tumor model and to compare them with “normal” tissue has important implications for tumor detection, but also for monitoring the efficacy of different liver tumor treatments.Acknowledgements
This work was supported by NIH (R01 CA206180, R01 EB-023366, P30 NS-052519), by the Society of Interventional Oncology Research Grant and Visage Imaging, Inc.References
1) J Ferlay, I.S., M Ervik, et al. GLOBOCAN 2012 v1.0, Cancer Incidence and Mortality Worldwide: IARC CancerBased No. 11. 2012
2) Njei B1, Rotman Y, Ditah I, Lim JK. Emerging trends in hepatocellular carcinoma incidence and mortality. Hepatology, 2015. 61(1): p. 191-9.
3) Hanahan D, Weinberg RA. Hallmarks of cancer: the next generation. Cell. 2011;144(5):646-74.
4) Coman D, Trubel HK, Rycyna RE, Hyder F. Brain temperature and pH measured by 1H chemical shift imaging of a thulium agent. NMR in Biomed 2009;22(2):229-239.
5) Huang Y, Coman D, Herman P, Rao JU, Maritim S, Hyder F. Towards longitudinal mapping of extracellular pH in gliomas. NMR Biomed 2016; 29(10): 1364-1372.
6) Coman D, Huang Y, Rao JU et al. Imaging the intratumoral-peritumoral extracellular pH gradient of gliomas. NMR Biomed 2016; 29(3): 309-319.
7) Liapi E, Geschwind JF,Vali M, Khwaja AA, Prieto-Ventura V, Bujis M, Vossen J, Ganapathy S, Wahl R. Assessment of tumoricidal efficacy and response to treatment with 18F–FDG PET/CT after intra-arterial infusion with the antiglycolytic agent 3- bromopyruvate in the VX2 model of liver tumor. J. Nucl. Med. 2011; 52(2):225–230.
8) Duran R, Mirpour S, Pekurovsky V, Ganapathy-Kanniappan S, Brayton CF, Cornish TC, Gorodetski B, Reyes J, Chapiro J, Schernthaner RE, Frangakis C, Lin M, Sun JD, Hart CP, Geschwind JF. Preclinical Benefit of Hypoxia-Activated Intra-arterial Therapy with Evofosfamide in Liver Cancer. Clin Cancer Res. 2017 Jan 15;23(2):536-548.
9) Vali M, Vossen JA, Buijs M, Engles JM, Liapi E, Ventura VP, Khwaja A, Acha-Ngwodo O, Ganapathy-Kanniappan S, Syed L, Wahl RL, Geschwind JF. Targeting of VX2 rabbit liver tumor by selective delivery of 3-bromopyruvate: a biodistribution and survival study.J Pharmacol Exp Ther. 2008 Oct;327(1):32-7.
Figures