2307
13C Metabolomic and Fluxomic Study of Human Melanoma Metabolic Network in vivoAlexander A. Shestov1, Seung-Cheol Lee1, Kavindra Nath1, Jeff Roman1, Clementina Mesaros2, David A. Nelson2, Dennis Leeper3, Ian A. Blair2, and Jerry D. Glickson1
1Radiology, University of Pennsylvania, Philadelphia, PA, United States, 2University of Pennsylvania, Philadelphia, PA, United States, 3Thomas Jefferson University, Philadelphia, PA, United States
Synopsis
Information from 13C isotopomers, which appear as multiplets in 13C spectra can be measured and quantified in vivo. Using this additional information alone with extended melanoma tumor bionetwork model has enable simultaneous fitting of experimental dynamic isotopomer turnover curves and evaluation of metabolic parameters and fluxes
Introduction
Metabolic modeling of 13C turnover curves obtained during infusion of a 13C labeled substrate (e.g. [1,6-13C2]glucose) in vivo allows measurement of compartmentalized metabolic fluxes and parameters providing basis for biomarker discovery. The goal of the present work was to extend the isotopomer metabolic model we recently developed1 in order to simultaneously fit 13C MRS isotopomer curves of lactate and glutamate. Utilizing 13C MRS and LC-MS methods, coupled with metabolic modeling we have determined activities of key central metabolic pathways in human DB1 melanoma subcutaneous mouse model.Methods
13C isotopomer MRS in vivo data acquired during [1,6-13C2]glucose infusion were analyzed with compartmentalized extended metabolic network models that included glucose, lactate and glutamine transport, glycolysis, TCA cycle, malate-aspartate shuttle, pyruvate carboxylase activity, other anaplerosis, pyruvate recycling through malic enzyme, lactate dehydrogenase activity, glutaminolysis, reductive carboxylation and de novo fatty acids synthesis. Isotope balance equations were derived for every network metabolite. The resulted sets of differential equations were solved to determine flux through various metabolic pathways by isotopomer/bonded cumomer analysis1. Statistics for the obtained parameters/fluxes was calculated by Monte Carlo simulations including experimental noise levels2.Results
Metabolic Flux Analysis revealed metabolic enzymes activities in melanoma in vivo for multiple pathways and, potentially, these metabolic flux signature may serve as key biomarkers of therapeutic response and drug resistance. Some resulting fitted metabolic fluxes (see Figure 1, fluxes in mM/h) were: TCA cycle activity FTCA= 16, mitochondrial pyruvate carrier FMPC= 34, anaplerotic flux at the SucCoA level FAna= 27, glutaminolysis activity FGls=35% of the TCA flux and mitochondrial malic enzyme activity was 50% of the TCA flux. In addition, the Warburg effect parameter (the ratio of lactate production flux to the pyruvate influx to mitochondria was estimated to be 0.25; ATP production rate in mitochondrial compartment accounted impressive 90% and only 50% of this energy from glucose-derived pyruvate; concentration of the mitochondrial glutamate was estimated as 1.1 mM and total glutamate concentration was 6mM. Additionaly Isotopomer Control Analysis3 was performed to estimate how robustly fluxes were estimated (Figure 2)Discussion
The additional information included in the extended metabolic network has allowed simultaneously fitting of at least 6 experimental isotopomers time courses, which appear as multiplets in 13C spectra. In addition, the new model has allowed the measurement of some concentrations of compartmentalized metabolites which can hardly to measure with others experimental techniques. It worth to mention that using the additional information from 13C multiplets leads to an increase in precision for all metabolic fluxes in the model2. Dynamic high-resolution MR spectra and LC-MS mass-isotopomers are very sensitive to changing/adding biochemical pathways and flux values, and metabolic modeling allows one to check precisely the feasibility of assumed general bionetworks and alterations of particular metabolic pathways. In conclusion, we were able to fit 13C isotopomer turnover curves simultaneously using the extended metabolic network where additional feasible fluxes and metabolite compartmentalized pools were included in the model.Acknowledgements
No acknowledgement found.References
[1] Shestov AA et al, J. Biological Chemistry 2016;
[2] Shestov AA, Valette J. et al, Neurochem Res 2012,37, 2388;
[3] Shestov et al Front. Oncol 2017
Figures

Figure 1. The total
glutamate C2, C3 and C4 labeling curves. C4 curve is the sum of two 13C
isotopomer curves corresponding to a singlet C4s and a doublet C4d34.
Continuous lines represent the best fits to the data using extended metabolic
network.
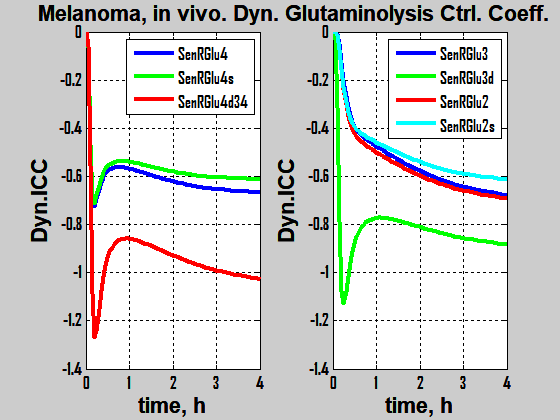
Figure 2. Dynamic multiplet isotopomer control coefficients are
shown with respect to glutaminolysis flux for the glutamate-C4 total and doublet
C4d34 and singlet C4s multiplets (left panel) and the glutamate-C3 and glutamate-C2
total and their multiplets (right panel) during infusion [1,6-13C2]glucose
Data show the time courses of normalized multiplet sensitivities to variation of
the glutaminolysis flux.