2305
Tracking adoptive cell transfer of primary human and mouse T-cells in naïve NSG and Balb/c mice, respectively, using PET and MRI methods1Zilkha Neurogenetic Institute, Keck School of Medicine of USC, Los Angeles, CA, United States, 2Pathology and Laboratory Medicine, Keck School of Medicine of USC, Los Angeles, CA, United States, 3Keck School of Medicine of USC, Los Angeles, CA, United States
Synopsis
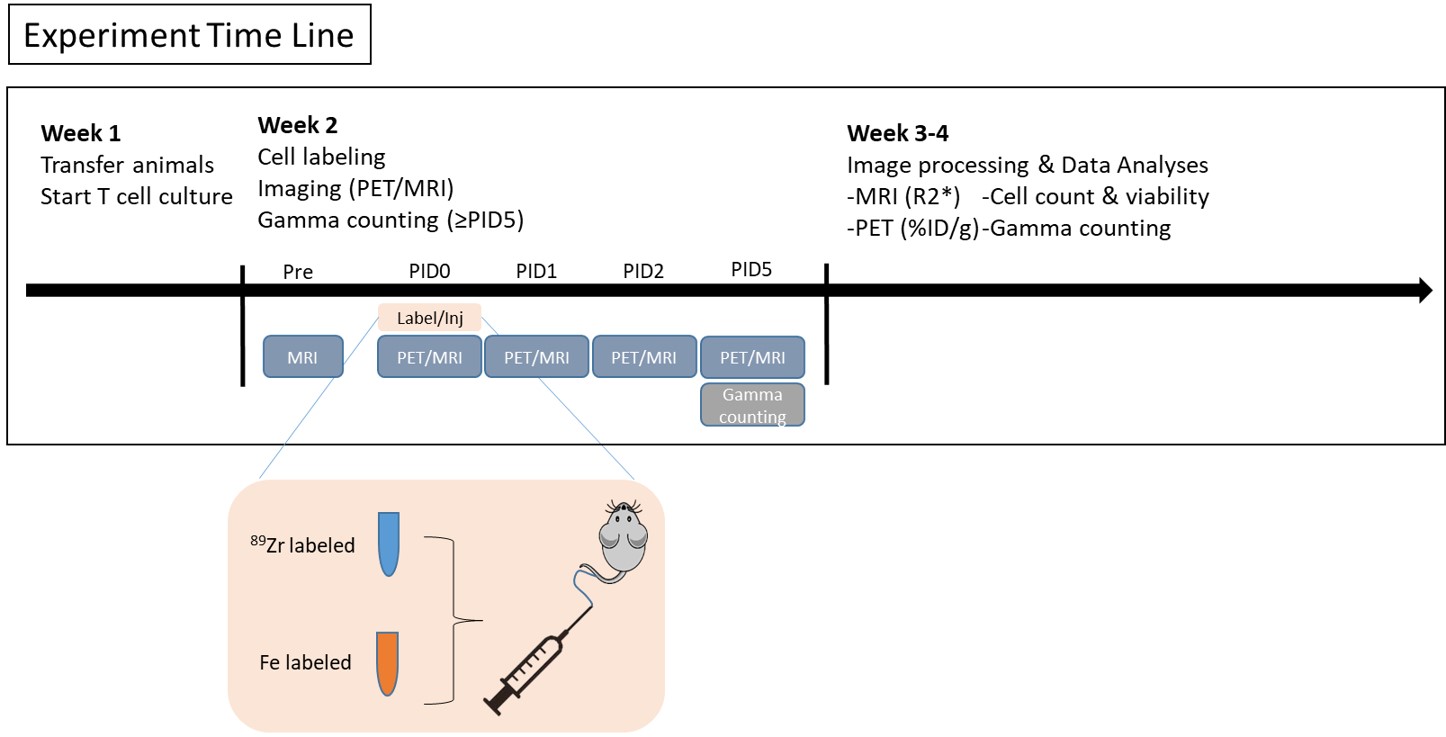
We determined the biodistribution of adoptively transferred primary T-cells in naïve mice to create a basis for quantifying adoptively transferred modified T-cells in mice cancer models, using PET and MRI cell labeling techniques simultaneously. Separate populations of T-cells were labeled with either a PET (89Zr) or an MRI label (ferumoxytol), and were injected intravenously into mice together. Animals underwent simultaneous PET/MRI imaging up to 5 days following cell injection in an MR Solutions 7 Tesla scanner with a PET camera. We looked at two models: primary mouse T-cells in naïve Balb/c mice and primary human T-cells in naïve NSG.
Purpose
The aim of the study was to establish a baseline spatial and temporal distribution of adoptively transferred T-cells in naïve mice to compare the trafficking of modified T-cells in murine models of cancer. We do this by using PET and MRI cell labeling techniques simultaneously and looking at two models: primary mouse T-cells adoptively transferred in naïve Balb/c mice and primary human T-cells adoptively transferred in naïve NOD scid IL-2R-gammanull (NSG) mice.Methods
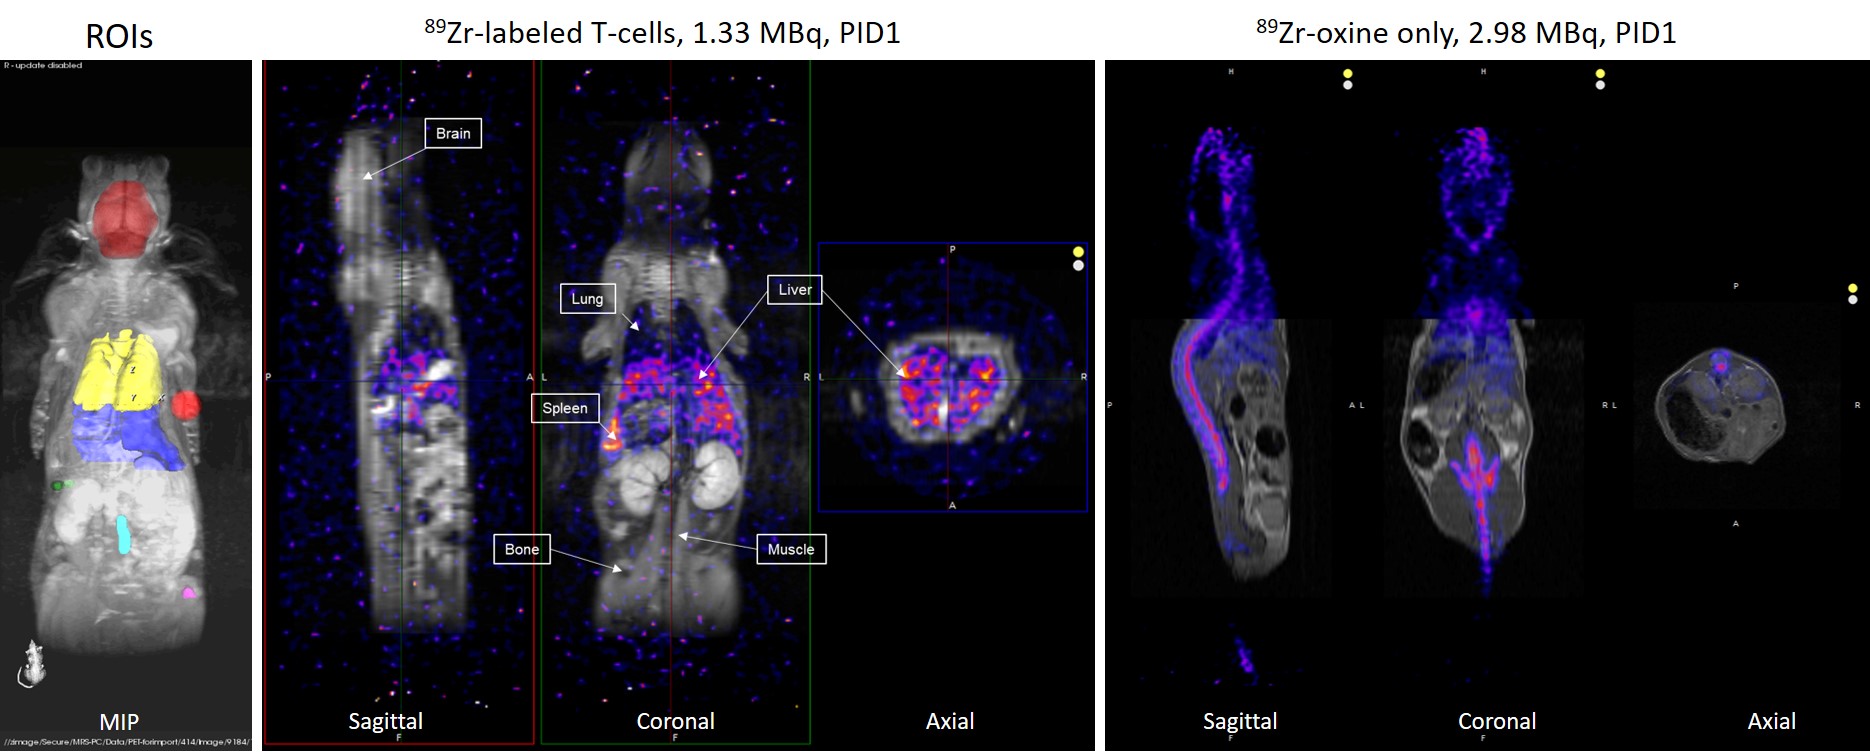
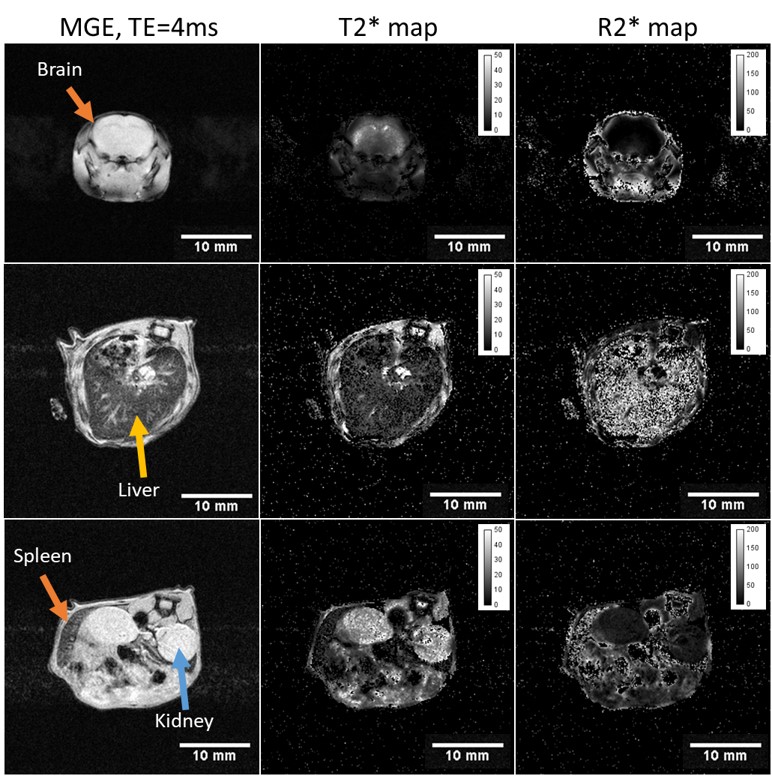
Cell labeling and injection For both the primary human and mouse T-cells, cells were labeled with 89Zr-[oxinate]4 (89Zr) in Hanks buffered saline solution (HBSS) for 45 min following a modified protocol from Weist, et al1. A separate population of cells were labeled with ferumoxtyol (Fe, ultra small paramagnetic iron oxide USPIO) in HSBSS for 2 hr with 200ug/mL protamine sulfate, modified from Gallli, et al2. NSG (n=3) and Balb/c (n=3) mice were anesthetized with 1.5% isoflurane and cells labeled with 89Zr (12e6 cells, with cell specific activity = 3µCi per million cells) and Fe (7e6 cells) were injected via the tail vein. Percent viability for the human and mouse T-cells were 64±6% and 88±5%, respectively, 3 hours after labeling. Twenty-four hours post injection, viability was 93±3% for human T-cells and 87±6% for mouse T-cells. PET image acquisition To track 89Zr-labeled cells, PET images were acquired using the MR Solutions PET insert installed in the MR solutions 7T MRI scanner. Animals were anesthetized with isoflurane (1.5%), and respiration and body temperature were monitored. A list mode static acquisition protocol, calibrated for 89Zr, was obtained for 10 min on post-injection day (PID) 0-2, and 20 min on PID5. Reconstruction was performed 3D-OSEM resulting in a 0.28 × 0.28 × 0.28 mm voxel dimension. Regions of interests (ROIs) were manually defined using VivoQuant software over anatomical MRI images and overlaid onto PET images. MRI image acquisition To track Fe-labeled cells, a respiration gated 2D multi-gradient echo (MGE) scan was acquired to create R2* maps, during the PET scan. All mice received an MGE scan prior to the adoptive cell transfer. The imaging parameters were used: TE/TR=4ms/1000ms (6 echoes, multiples of 4ms = 4, 8, 12, 16, 20, and 24ms), Inversion time=1000ms, slice thickness=1mm, 1 average, echo train length=1, field of view =36 mm x 36 mm, matrix size = 256 x 256, flip angle=50°. A two-dimensional anatomical Fast Spin Echo (FSE) T1-weighted was also acquired. Imaging parameters are as follows: TE/TR=11ms/3556ms, slice thickness=1mm, 1 average, echo train length=4, field of view =72 mm x 72 mm, matrix size = 512 x 252, flip angle=90°. Using ROCKETSHIP v.1.1 code3 in MATLAB (R2014b), T2* values were generated through a pixel-by-pixel exponential fitting of signal intensities across the different TE times, respectively. R2* maps were generated by taking the inverse of the T2* map (R2* = 1/T2*). ROIs were manually drawn using Fiji (ImajeJ2)4. Because tissues have a nonzero ‘background’ R2*, the change in R2* (ΔR2*) measures the concentration of Fe-labeled cells that accumulates in the ROI. ΔR2* is calculated by taking the difference between the R2* values at the time points post injection and the pre-injection R2* values. Gamma counting Organs and tissues of interests were dissected on PID8 for gamma counting on a Perkins Elmer Wizard 2480 gamma counter.Results
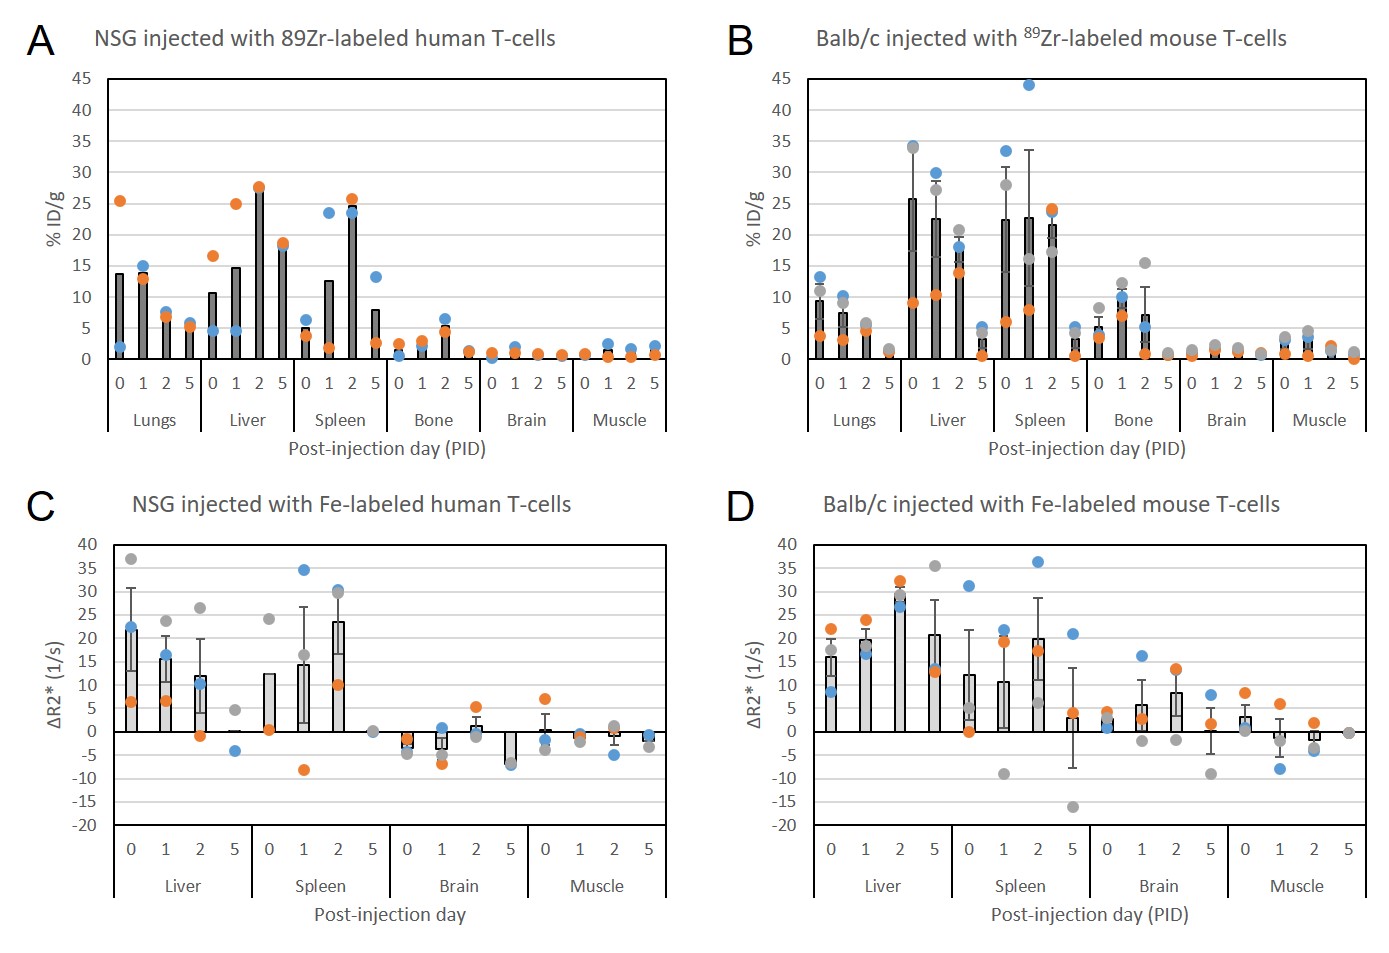
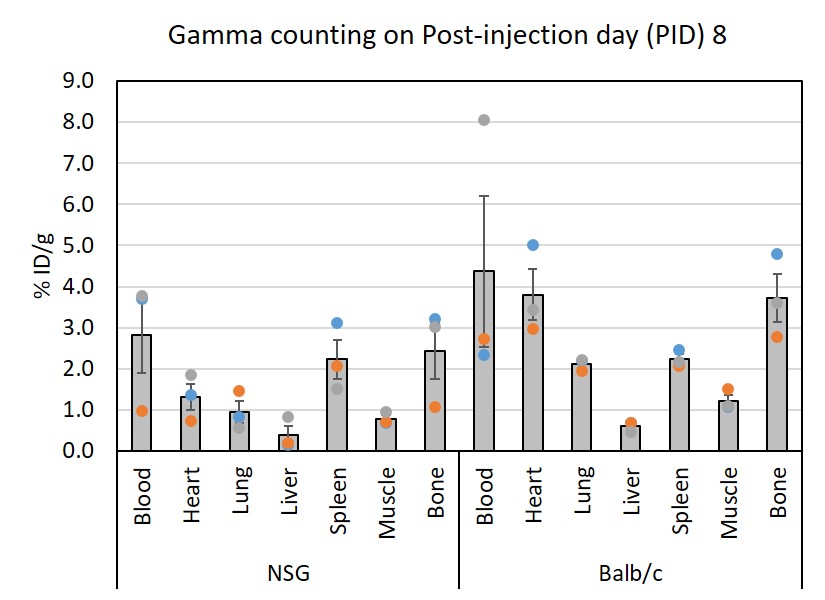
Overall, primary human T-cells and primary mouse T-cells showed similar biodistribution after adoptive transfer. 89Zr-labeled cells (%ID/g) were present in the lungs initially after injection and decreases by PID5. Increasing levels of cells were then detected in the liver and spleen. There was slight increase in non-specific binding to bone. Minimal signal from 89Zr-labeled cells were detected in brain and muscle. Fe-labeled cells showed correlated time-course as the 89Zr-labeled cells: persistent ΔR2* in the liver, increasing ΔR2* in the spleen, and minimal presence in brain and muscle. By PID8, gamma counts reveal that there was still 89Zr-labeled cells circulating due to their presence in blood, heart and lung.Conclusion
Primary human and mouse T-cells have similar spatial and temporal biodistribution after adoptive transfer within one week after intravenous injection. Signal is detected mainly in the lungs, liver, spleen, and some in bone. One week after injection, label can be detected in the blood, spleen and bone. This suggest that viable persisting T-cells are still in blood. 89Zr signal in bone and spleen usually indicate free 89Zr binding to bone or expired cells ending up in the spleen. We now have a basis for quantifying adoptively transferred Tcells in mice using PET (89Zr) and MRI (Fe) techniques.Acknowledgements
We would like to thank Dr. Kofi Poku and Dr. Michael Weist from City of Hope for their assistance in establishing 89Zr cell labeling protocol, and Ryan Park from the USC Molecular Imaging Core for assistance in the gamma counting of tissues and organs of interest.References
1. Weist MR, Starr R, Aguilar B, et al. PET of Adoptively Transferred Chimeric Antigen Receptor T-cells with (89)Zr-Oxine. J Nucl Med. 2018;59: 1531-1537.
2. Galli F, Histed S, Aras O. NK cell imaging by in vitro and in vivo labelling approaches. Q J Nucl Med Mol Imaging. 2014;58: 276-283.
3. Barnes SR, Ng TS, Santa-Maria N, Montagne A, Zlokovic BV, Jacobs RE. ROCKETSHIP: a flexible and modular software tool for the planning, processing and analysis of dynamic MRI studies. BMC Med Imaging. 2015;15: 19.
4. Schindelin J, Arganda-Carreras I, Frise E, et al. Fiji: an open-source platform for biological-image analysis. Nat Meth. 2012;9: 676-682.
Figures