2304
In vivo evaluation of pentose phosphate pathway activity in orthotopic glioma using hyperpolarized δ-[1-13C]gluconolactone1Radiology and Biomedical Imaging, UCSF, San Francisco, CA, United States
Synopsis
Flux via the pentose phosphate pathway (PPP) is typically upregulated in tumor cells. Imaging this upregulation could therefore help in monitoring tumor development and response to treatment. A previous study presented the use of hyperpolarized δ-[1-13C]gluconolactone to detect flux through PPP by monitoring its conversion to 6-phospho-[1-13C]gluconate in isolated perfused livers. Here, we demonstrate that HP δ-[1-13C]gluconolactone can also be used to monitor PPP activity in healthy brain and in gliomas, and that the ratio of HP 6-phospho-[1-13C]gluconate to 6-phospho-δ-[1-13C]gluconolactone is significantly higher in tumor regions compared to healthy brain.
Introduction
The pentose phosphate pathway (PPP) generates NADPH and ribose 5-phosphate, which are involved in the scavenging of reactive oxygen species and in the synthesis of nucleotides. As such, the PPP is typically upregulated in cancer cells to address the metabolic needs of rapid cell proliferation1,2. Imaging PPP upregulation could therefore be useful in tumor assessment. One intermediate of the pathway is 6-phospho-δ-gluconolactone (6P-δ-GL), which is produced by phosphorylation of δ-gluconolactone. In a recent study hyperpolarized (HP) δ-[1-13C]gluconolactone was used to detect flux via the PPP by monitoring its conversion to 6-phospho-[1-13C]gluconate (6PG) in isolated perfused liver (Fig.1)3. However, to date, the utility of this hyperpolarized probe has not been investigated in brain. The goal of our study was to evaluate whether HP δ-[1-13C]gluconolactone can be used to assess PPP flux in healthy rat brain and in an orthotopic glioma rat model.Methods
δ-[1-13C]gluconolactone probe preparation and characterization: δ-[1-13C]gluconolactone was synthesized and polarized as previously described3. 2M δ-[1-13C]gluconolactone was dissolved in 3:1 water:glycerol and mixed with 15mM trityl radical OX063. After maximal polarization was achieved, the sample was dissolved in 3.9ml phosphate-buffered saline (pH~7) and rapidly transferred to a horizontal 3T scanner (BioSpec 105mm bore diameter, Bruker) to evaluate T1 (N=1, TR=3s/FA=10o) and percent polarization (N=1, TR=300sec/FA=90o/NA=5). Spectra were processed by peak integration using MestReNova (Mestrelab).
Animal Studies: 7 male athymic nu/nu rats were investigated. In 4 animals (5 weeks old) U87 glioblastoma cells (3x10⁵) were implanted by intracranial injection4. 3 animals were used as age-matched tumor-free controls. All measurements were performed on the above-mentioned horizontal 3T scanner (Bruker) equipped with a dual-tuned 1H-13C volume coil. Axial T2-weighted images were recorded using a spin echo (TurboRARE) sequence (TE/TR=64/3484ms, FOV=35x35mm2, 256x256, slice thickness=1mm, NA=10) and used to evaluate tumor location and size. Hyperpolarized studies were performed following injection of 2.2ml HP δ-[1-13C]gluconolactone (prepared as described above) via a tail-vein catheter over 15s. Dynamic 13C MR spectra were acquired from an 8mm slab using a flyback spectral-spatial echo-planar spectroscopic imaging (EPSI) pulse with 15.2deg on 6PG, 3.4deg on 6P-δ-GL and 12deg on 6-phospho-γ-[1-13C]gluconolactone, FOV=35x35mm2, matrix size=8x8 and TR=3s/NR=20. The data were processed using in-house Matlab code. For each voxel at every time point, spectra were analyzed by determining the area under each peak. Intensity heat maps were produced by interpolating the data using a Lanczos-2 kernel. Additionally, the ratio of maximum value of 6PG to maximum 6P-δ-GL was assessed in a 3.76mm3 volume that represented tumor or healthy brain.
Statistical analysis: All results are expressed as mean±STD. Unpaired two-tailed student’s t-test was used to assess the statistical significance of differences (p<0.05 considered significant).
Results and Discussion
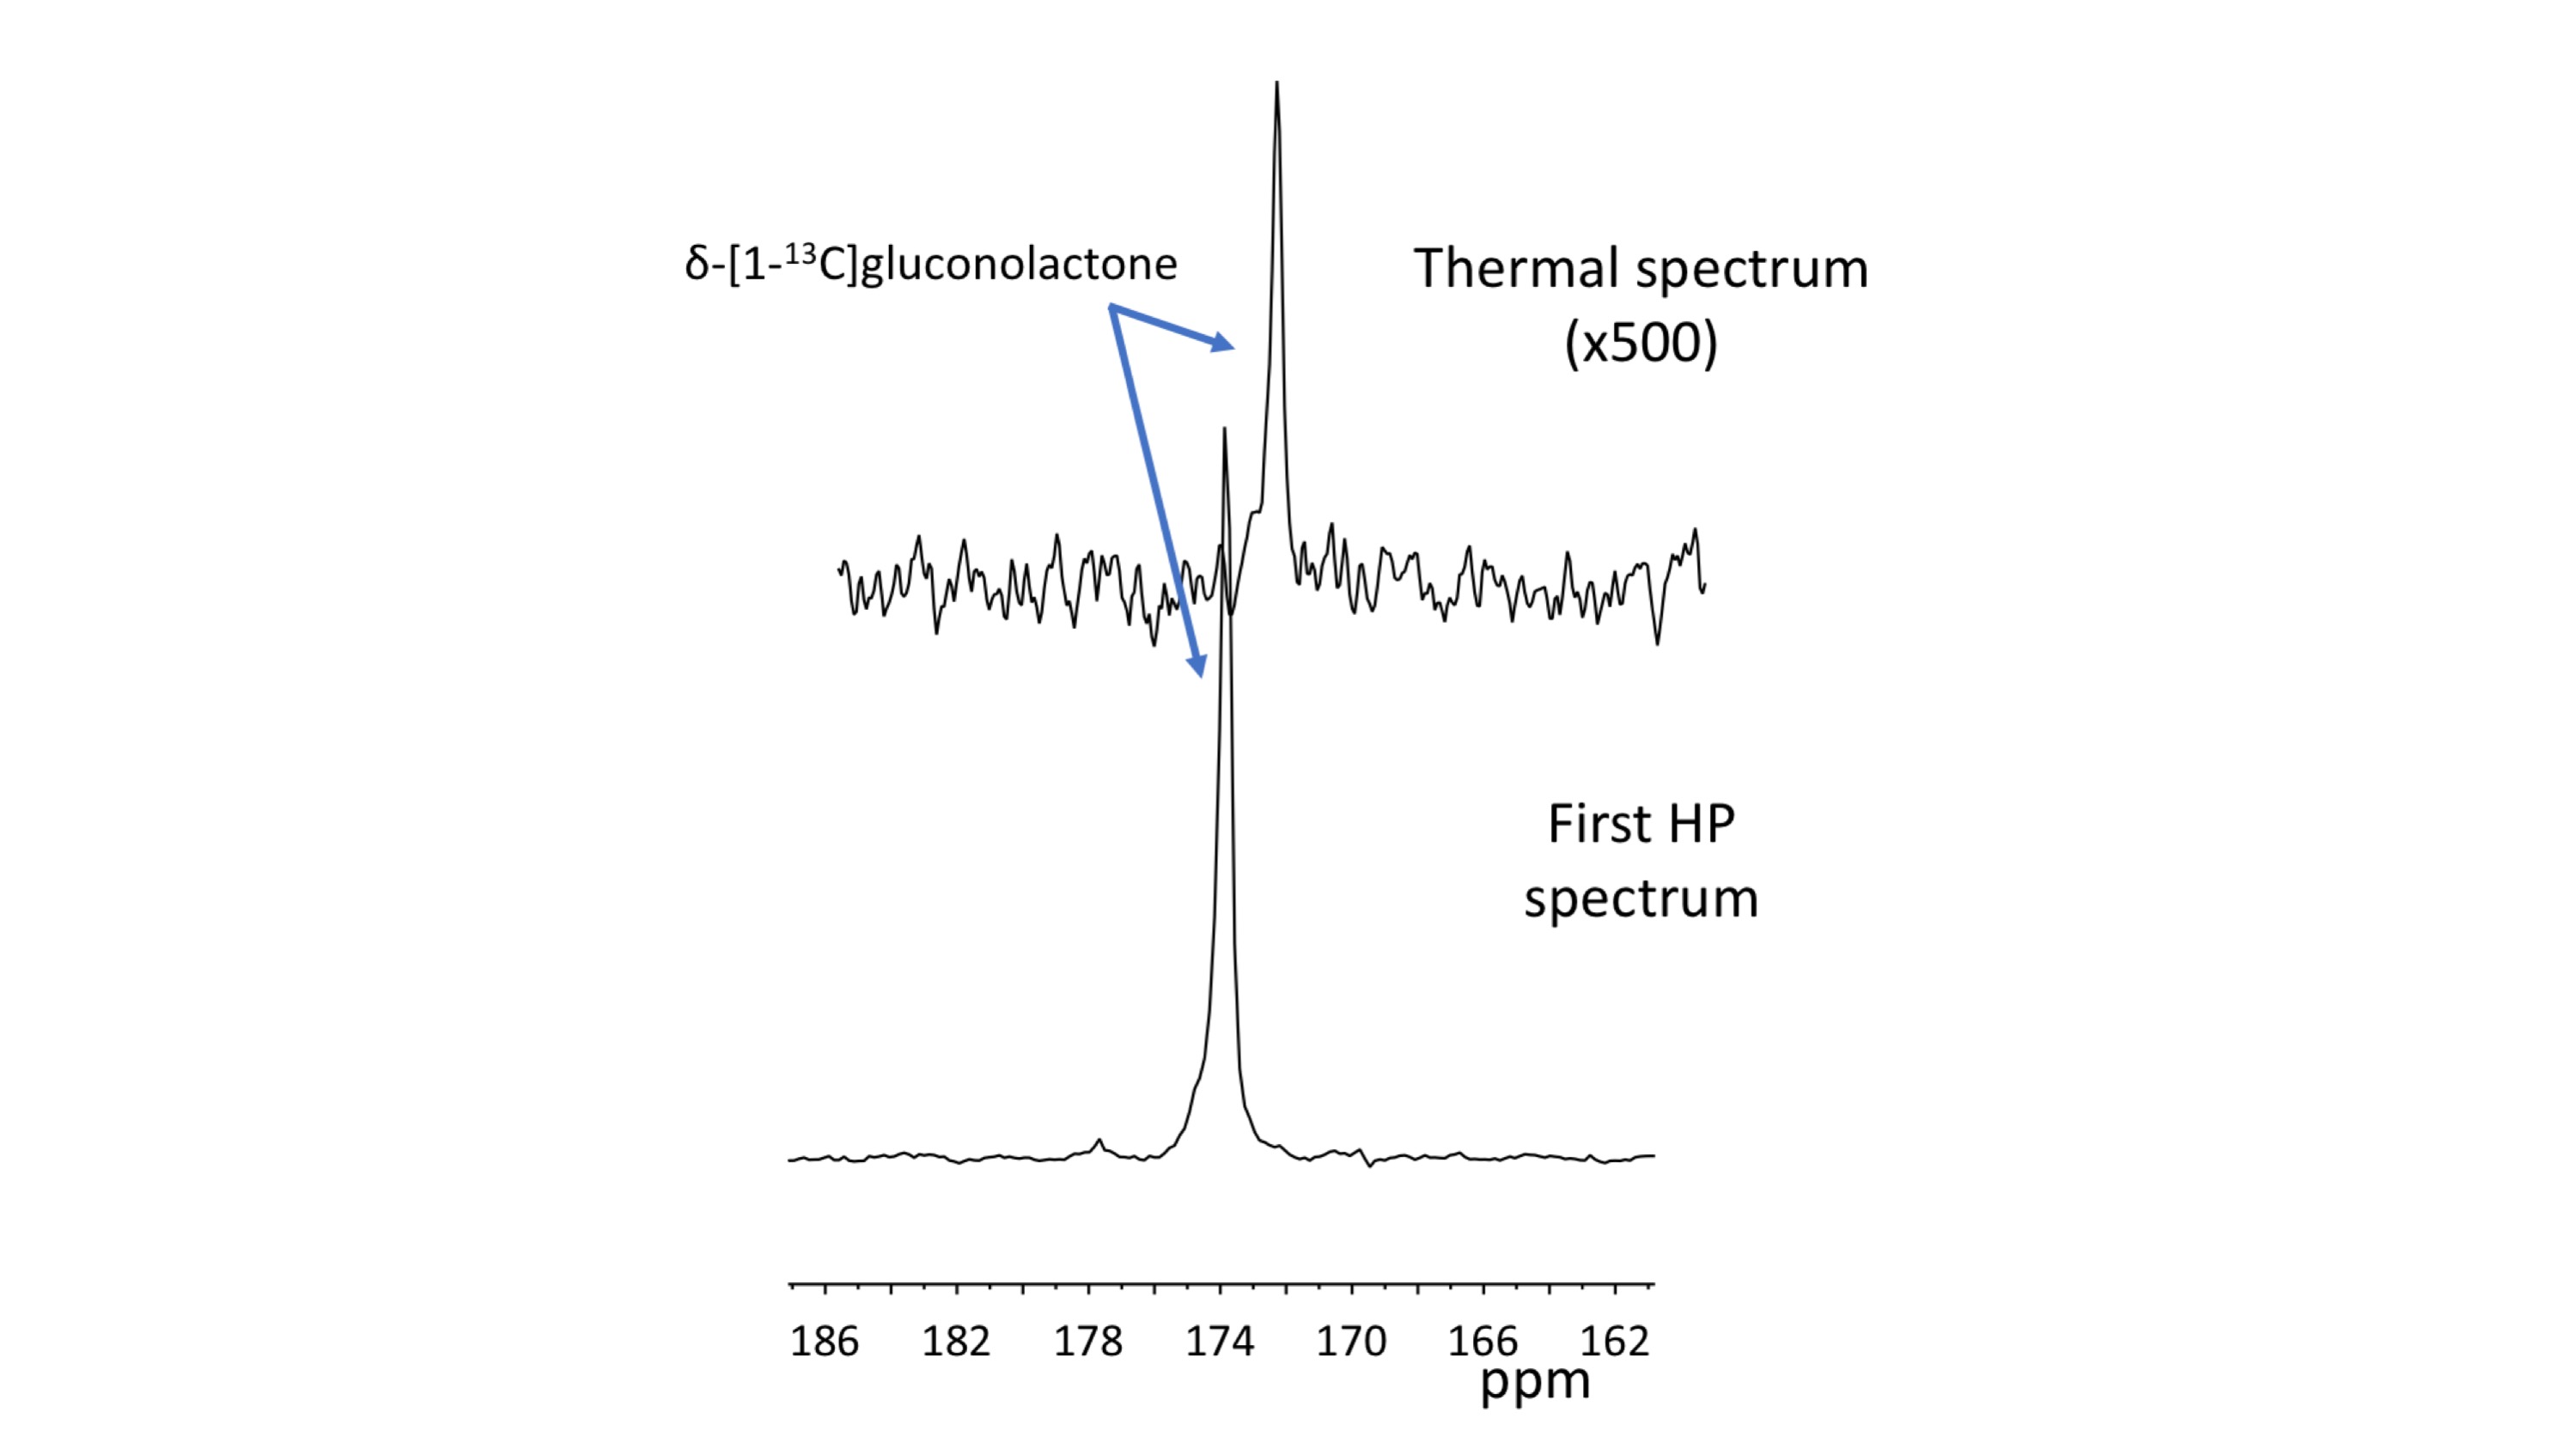
Polarization level and T1: A peak corresponding to δ-[1-13C]gluconolactone was detected at 173.8ppm following dissolution and an enhancement of 6.9% was observed when compared to the thermal spectrum (Fig.2), consistent with the previously reported value3. The T1 was 37s at 3T, which compared favorably to the T1 of 18s previously reported at 9.4T3.
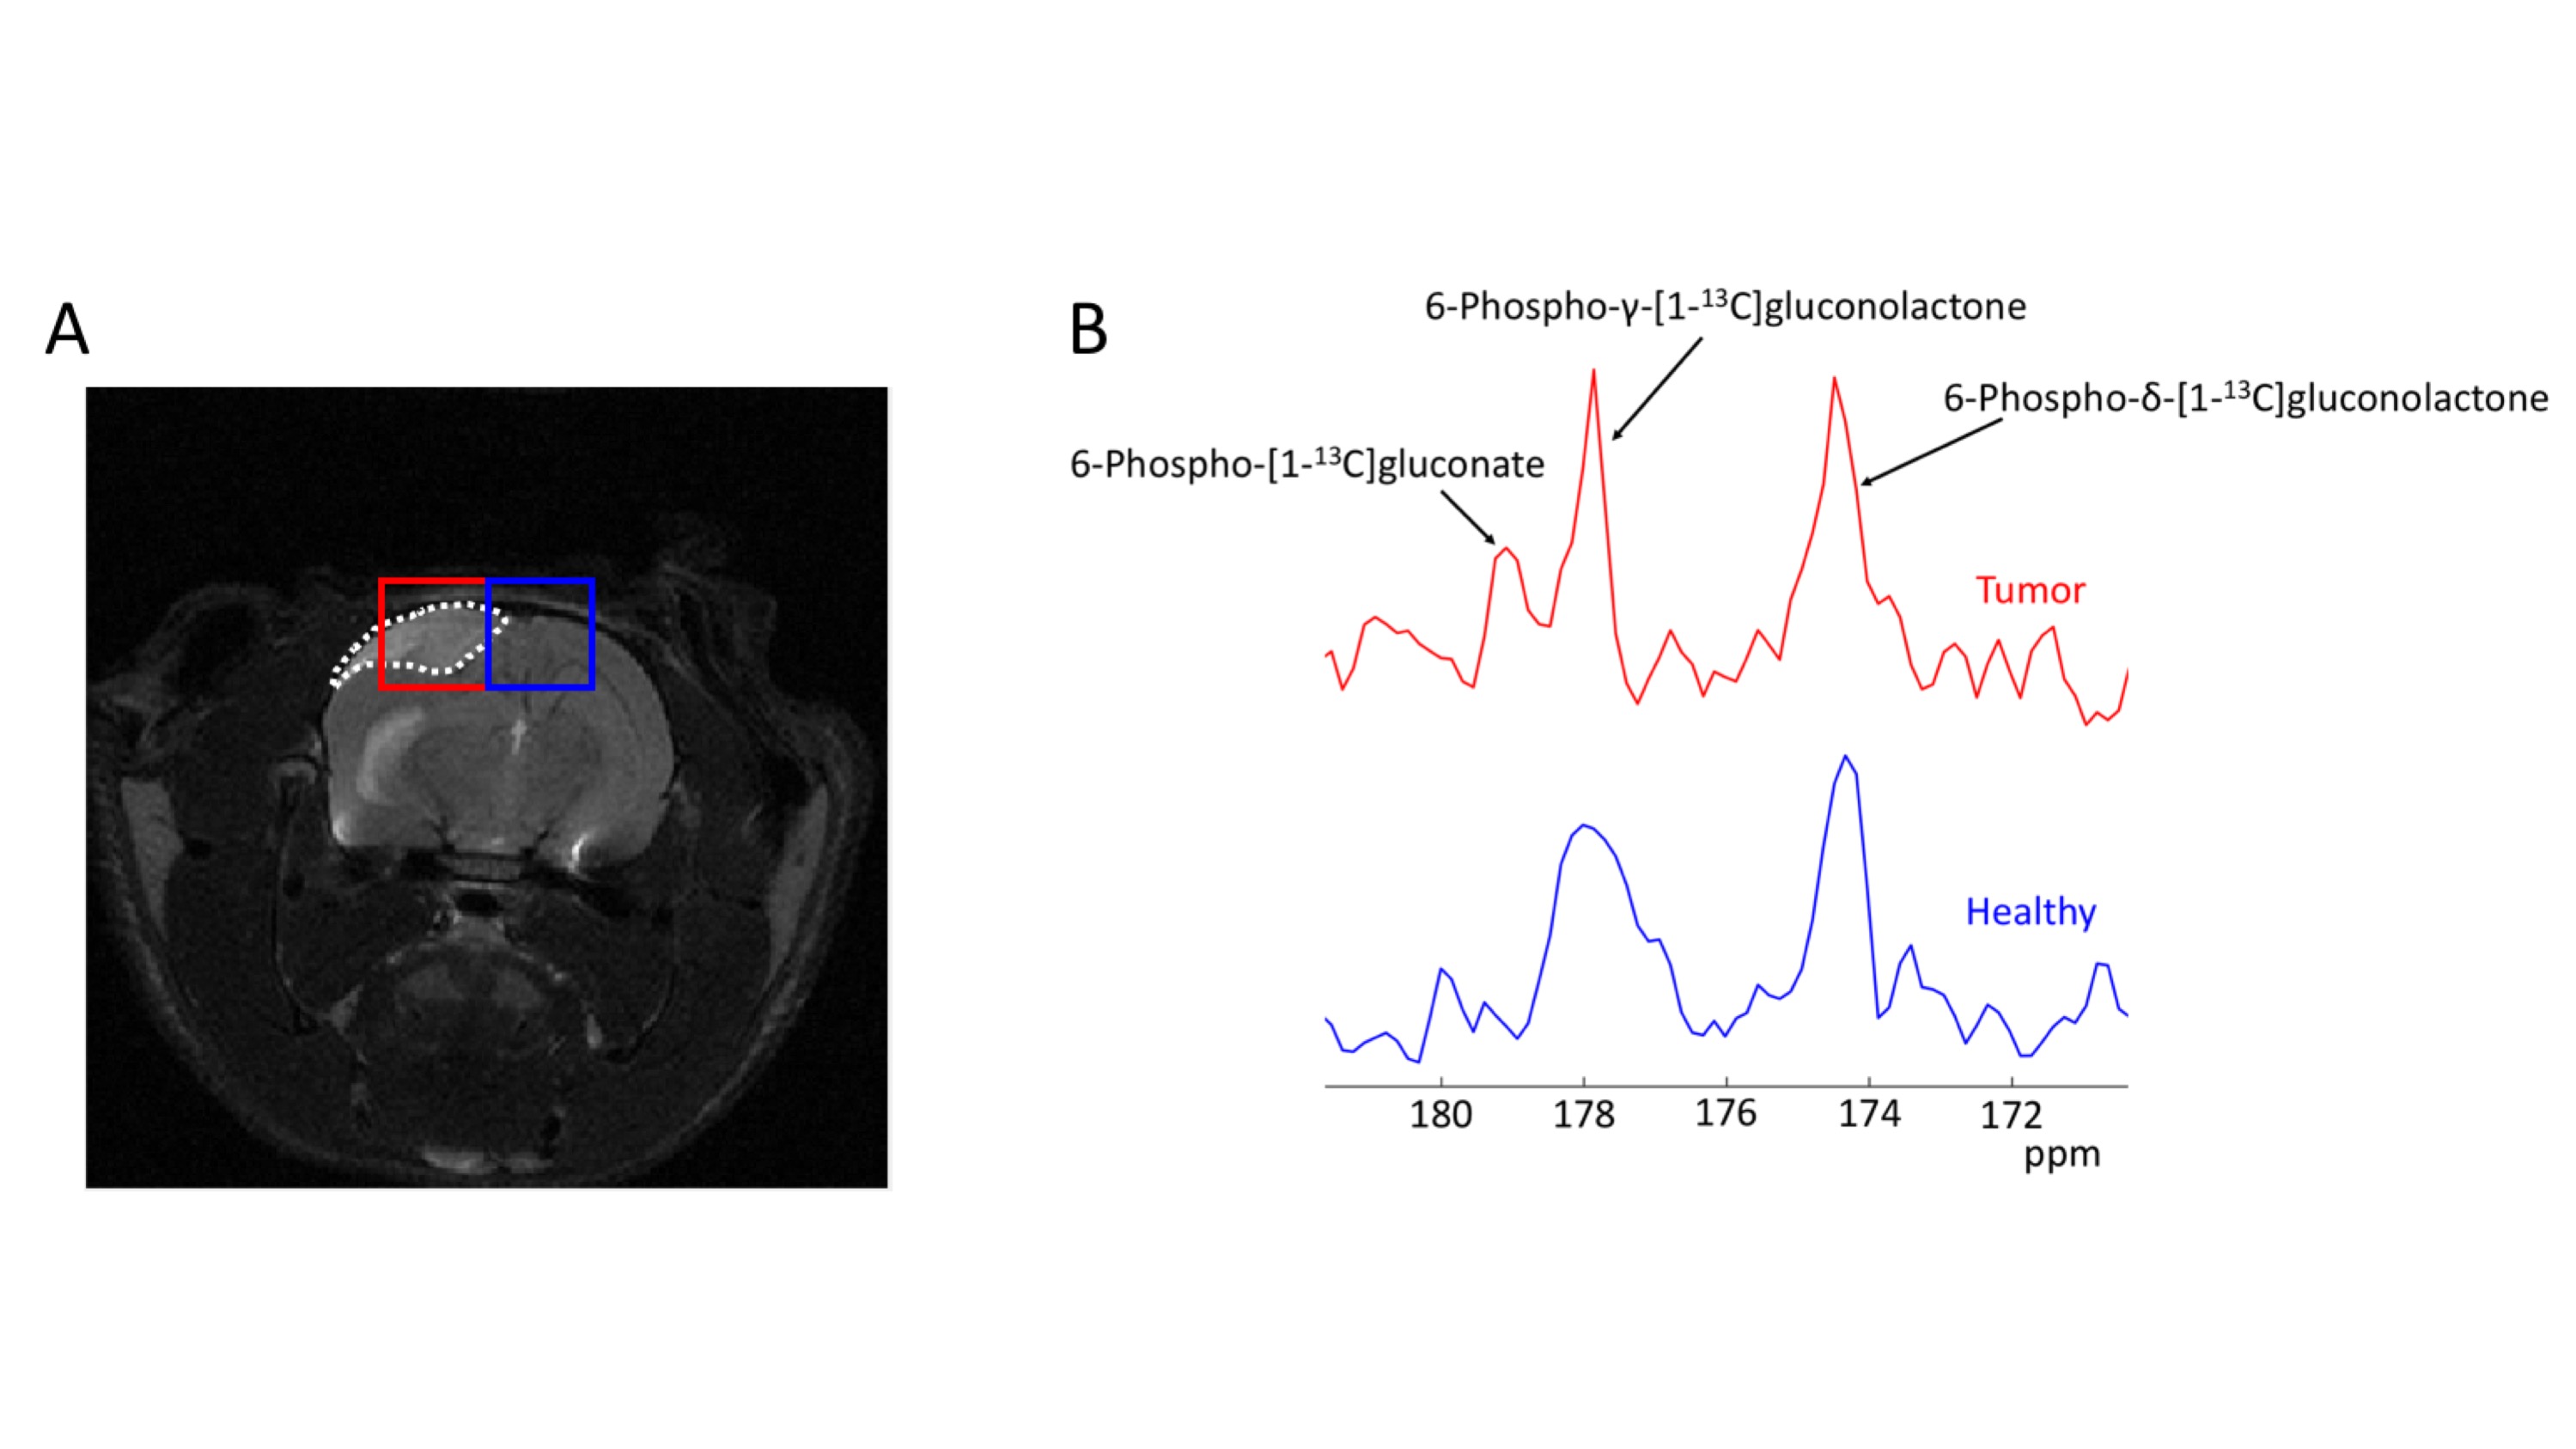
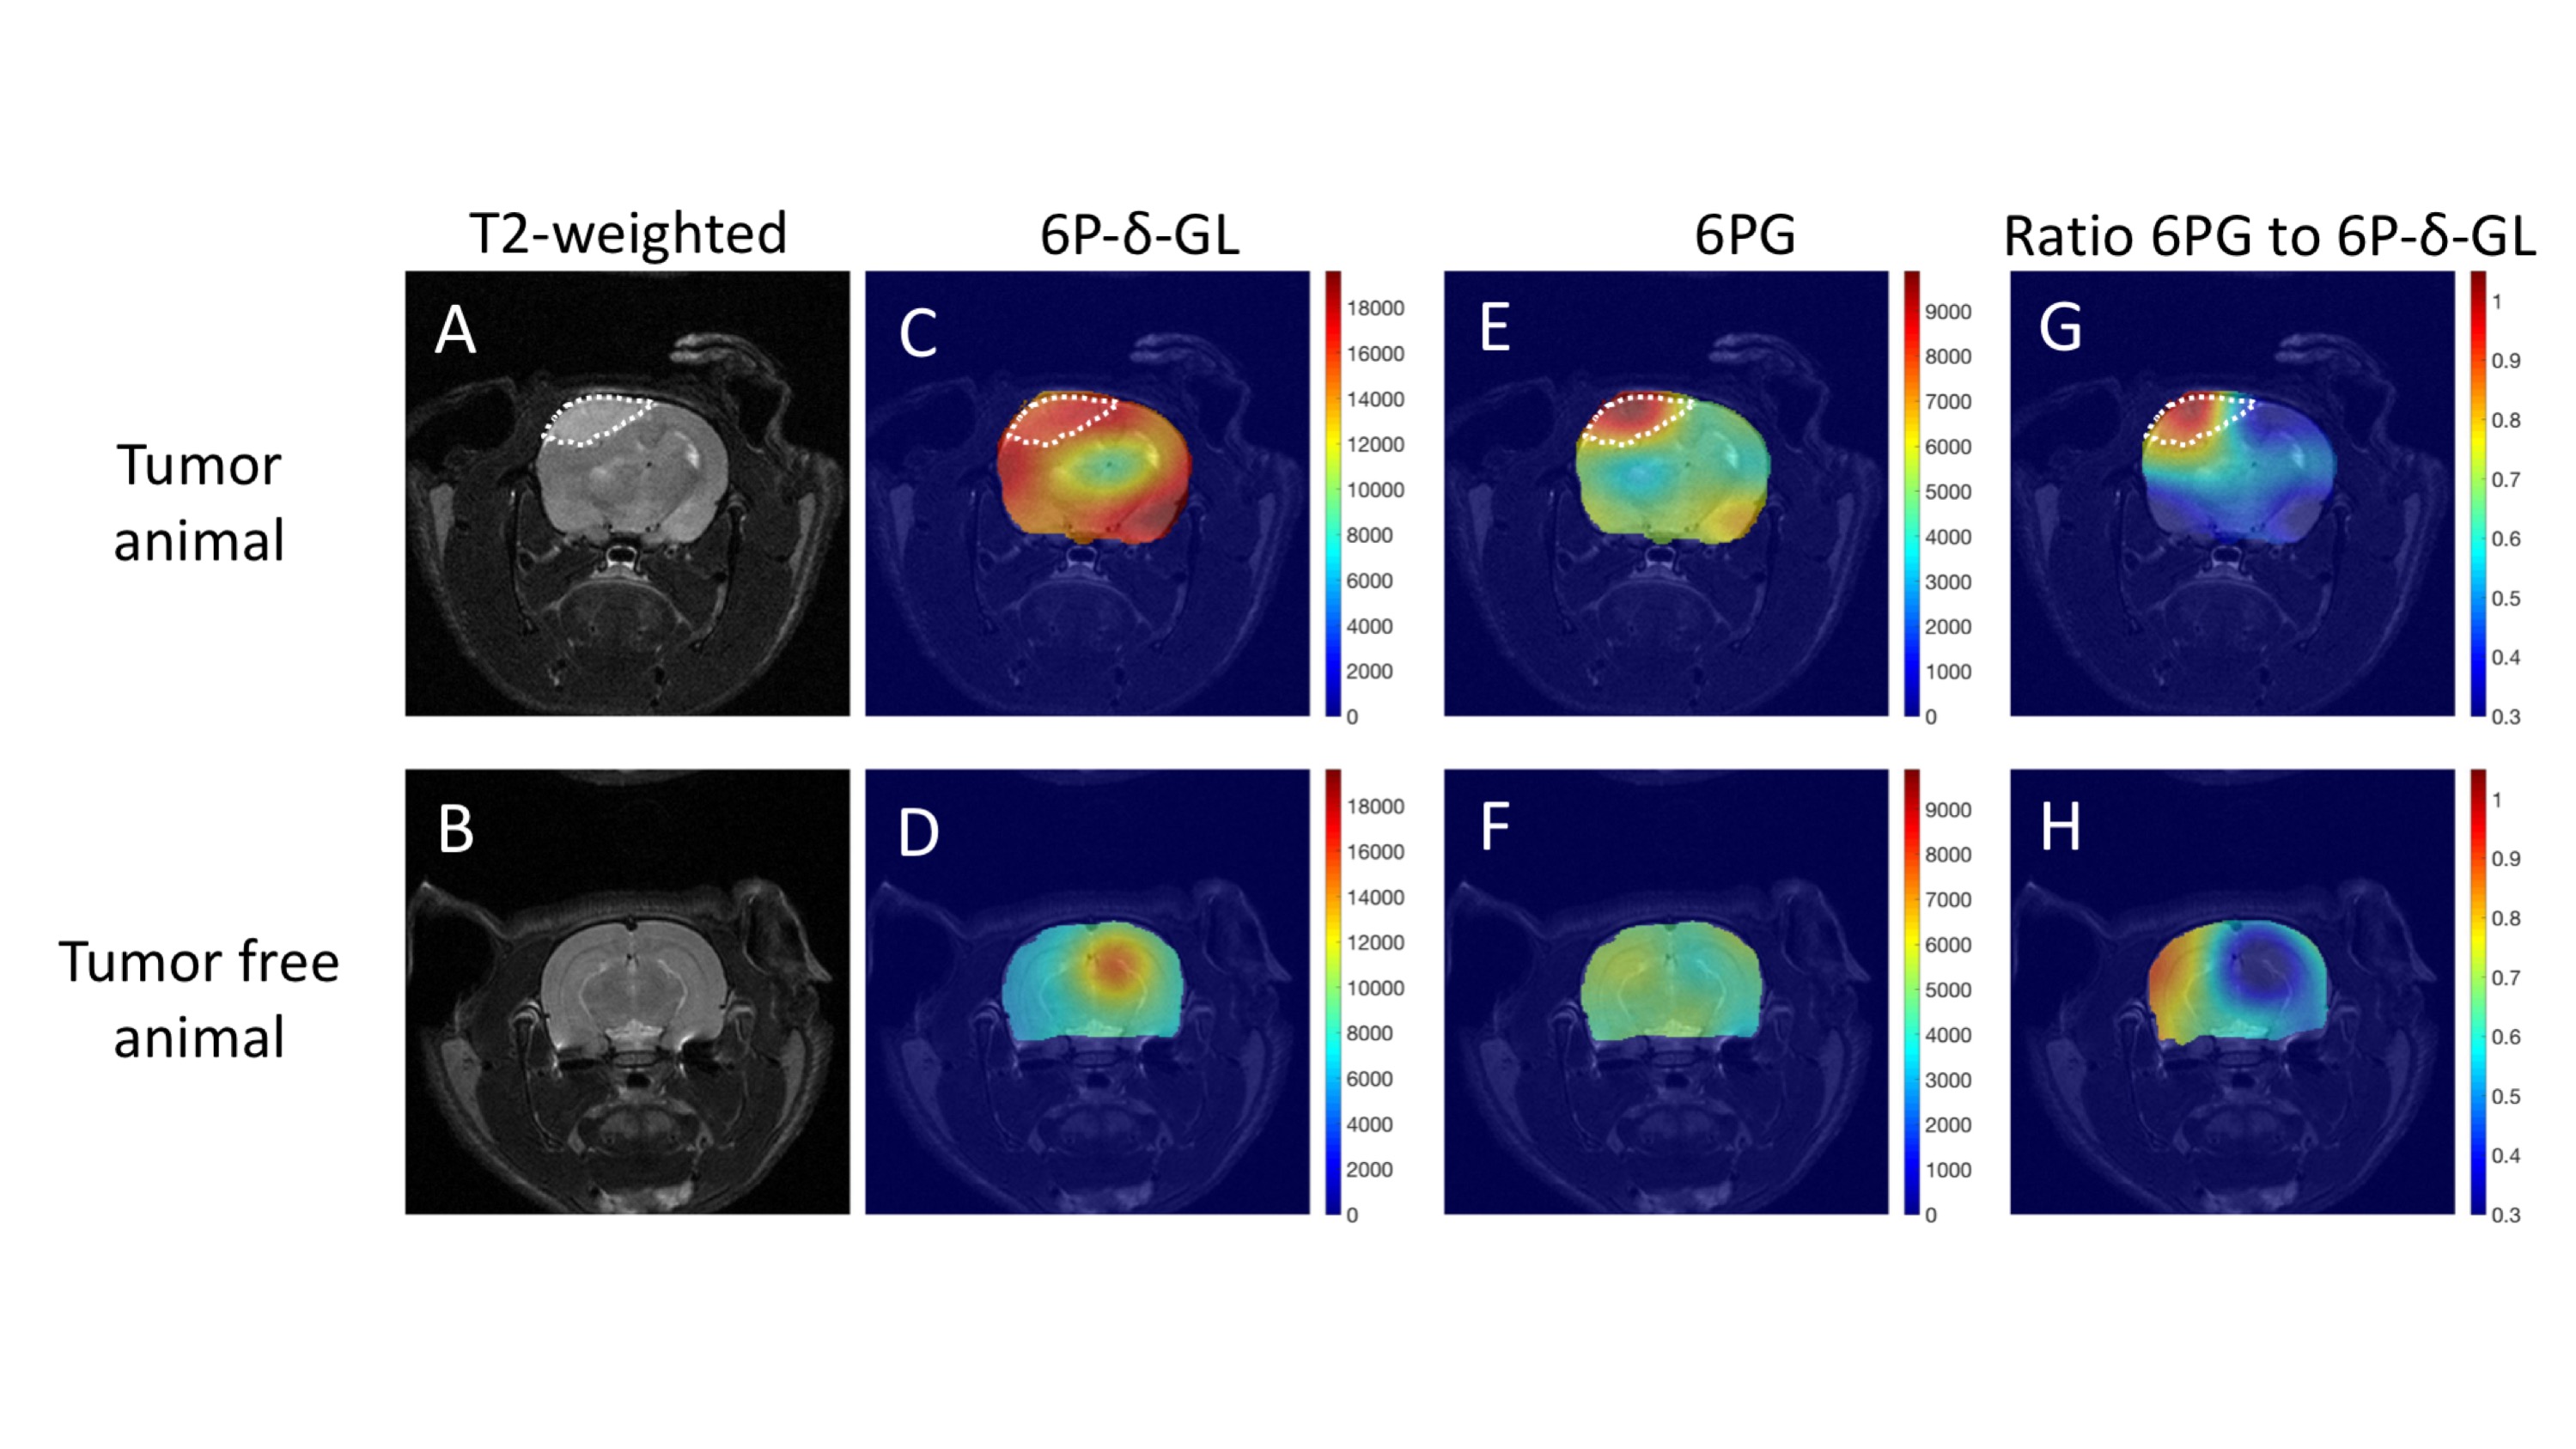
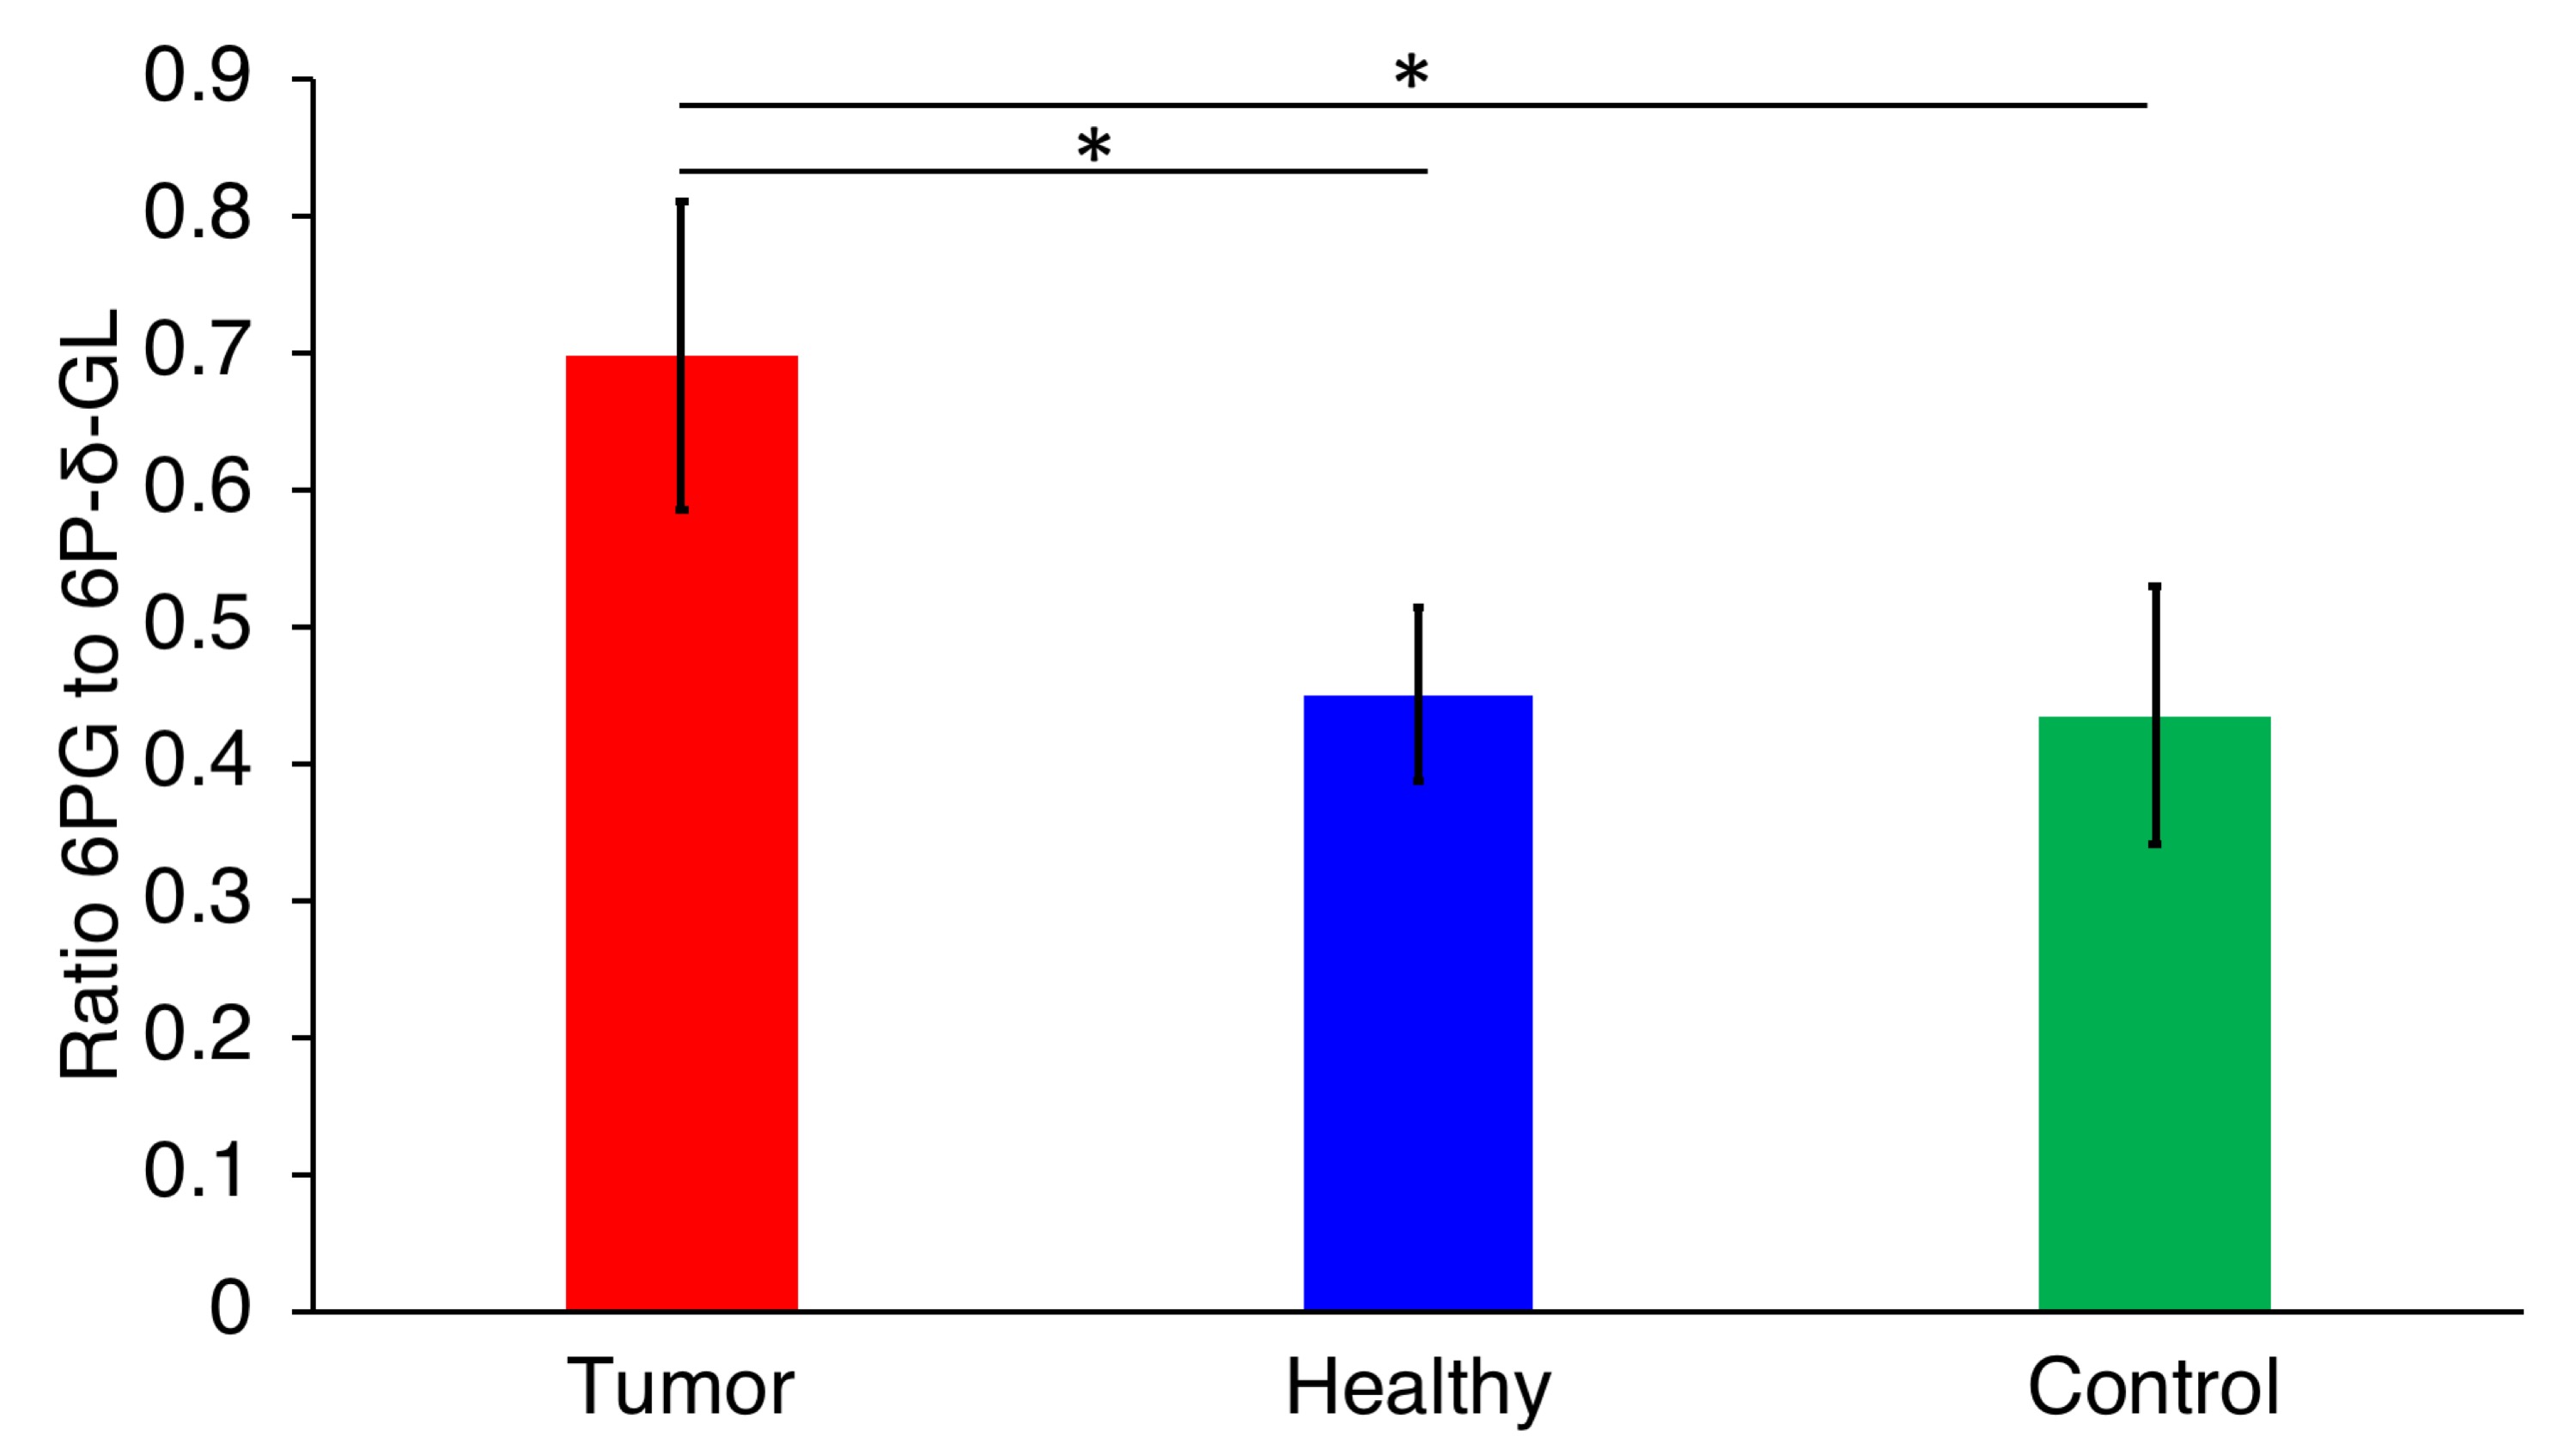
In vivo normal brain and GBM studies: HP acquisitions were performed on tumor-bearing animals when tumors reached ~0.25±0.1cm3 (Fig.3A) at 15±4 days post-implantation (and at the same age for controls). 9-12 seconds after HP δ-[1-13C]gluconolactone injection, peaks previously assigned3 to 6P-δ-GL (174.5ppm) and 6-phospho-γ-[1-13C]gluconolactone (177.7ppm) were observed in all rats. 3-6 seconds later a peak at 179.3ppm, the expected resonance of 6PG, was also observed. These data indicate that HP δ-[1-13C]gluconolactone likely crosses the blood-brain barrier and is rapidly metabolized, consistent with its transport via glucose transporters. Importantly, 6PG was significantly higher in tumor voxels (Fig.3B). The spatial distribution of 6P-δ-GL, 6PG and their ratio are illustrated in Fig.4. The ratio of 6PG-to-6P-δ-GL was comparable in normal brain and in normal-appearing contralateral brain of tumor-bearing rats, but higher in the tumor regions (Fig.4G-H). This was further confirmed by quantifying the 6PG-to-6P-δ-GL ratio from a 3.76mm3 volume of tumor or normal brain in all rats (Fig.5). The ratio was within experimental error in normal and normal-appearing brain (p=0.85) but significantly higher in tumor (p=0.02 and p=0.04 for tumor to normal-appearing contralateral brain and tumor to normal brain comparisons) likely reflecting the elevated PPP flux that typically occurs in tumor cells.
Conclusion
Our results indicate, to our knowledge for the first time, that metabolism of HP δ-[1-13C]gluconolactone can be assessed in the brain. Importantly, 6PG production is elevated in glioma relative to normal brain, providing a potential metabolic imaging approach to probe tumor development, recurrence and response to therapy.Acknowledgements
Work supported by NIH R01CA172845, NIH R01CA197254, UCSF LOGLIO collective, NICO project and P41EB013598.References
1Dong MA et al, Review of metabolic pathways activated in cancer cells as determined through isotopic labeling and network analysis, Metabolic Engineering (2017) 43:113-124
2Patra KC et al, The pentose phosphate pathway and cancer, Trends in Biochemical Sciences (2014) 39:347-54
3Moreno KX et al, Hyperpolarized δ‐[1‐13C]gluconolactone as a probe of the pentose phosphate pathway, NMR in Biomedicine (2017) 30:e3713
4Chaumeil MM et al., Non-invasive in vivo assessment of IDH1 mutational status in glioma, Nature Communications (2013)
Figures