2300
Investigating the effects of hypoxia on fibroblast invasion and metabolism1Division of Cancer Imaging Research, The Russell H. Morgan Department of Radiology and Radiological Science. The Johns Hopkins University School of Medicine, Baltimore, MD, United States, 2Sidney Kimmel Comprehensive Cancer Center, The Johns Hopkins University School of Medicine, Baltimore, MD, United States, 3Radiation Oncology and Molecular Radiation Sciences, The Johns Hopkins University School of Medicine, Baltimore, MD, United States
Synopsis
Fibroblast are considered as a major source of Collagen 1 fiber in the tumor stroma and to play a fundamental role in extracellular matrix (ECM) modification. Thus, cancer associated fibroblast has been related with increased tumor proliferation, invasion and metastasis. In the present study, we want to characterize the effect of different tumor microenvironments, as hypoxia and acidic extracellular pH, in the ability of prostate fibroblast cells to invade and degrade the extracellular matrix (ECM), as well with changes in their metabolome. We used our MR compatible cell perfusion system to assess this.
Introduction
Fibroblasts are versatile cells that produce several ECM proteins such as collagen 1 and extradomain A containing fibronectin, as well as degradative enzymes such as matrix metalloproteinases 1. In cancer, fibroblasts play a significant role in tumor progression and dissemination 2-4. We recently identified increased cancer associated fibroblasts in more metastatic prostate cancers 5. To further understand the influence of tumor microenvironmental factors such as hypoxia in modifying fibroblast invasion and metabolism, here we have investigated changes in prostate myofibroblast invasion and ECM degradation as well as metabolism with our MR-compatible cell perfusion system that allows careful control of oxygenation and pH. The system was used to characterize the invasion, ECM degradation, and metabolism of prostate myofibroblasts under normoxic and hypoxic conditions.Material and Methods
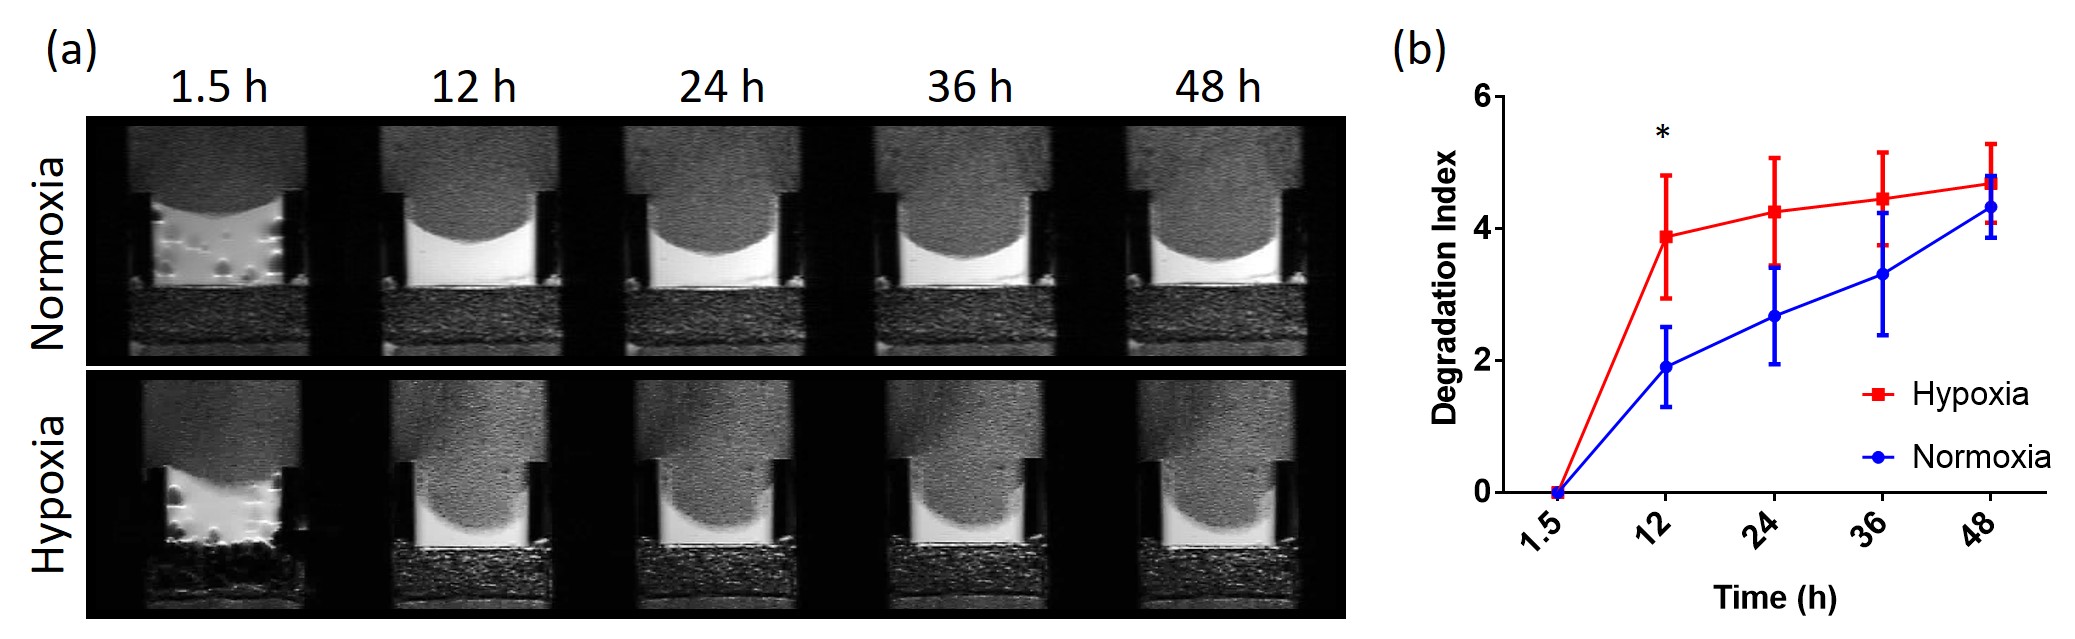
Experiments were performed using the human prostate myofibroblasts (WPMY-1, ATCC, Manassas, VA). The prostate myofibroblast stromal cell line, WPMY-1, was derived from stromal cells from the peripheral zone of the histologically normal adult prostate 6. Before each MR experiment, 1.5x10⁶ WPMY-1 cells were seeded on 0.5 ml of Plastic Plus beads in five 100 mm dishes and grown for 4 days. Experiments were carried out with WPMY-1 cells plated on ECM chamber under well-oxygenated (70% O2) or hypoxic (1% O2) conditions as previously detailed by us 7. MR data were acquired on a 9.4 T MR spectrometer (Bruker, Billerica, MA) every 12 h over a period of 2 days. T1-weighted 1H MR imaging was performed to evaluate the sample preparation, to visualize the geometry of the ECM gel, and to detect changes in its integrity due to invasion and degradation. One-dimensional (1D) 1H MR profiles of intracellular water were acquired along the length (z-axis) of the sample by diffusion- weighted (DW) MRI. Intracellular metabolite levels including total choline (Cho), (signals from phosphocholine (PC) + glycerophosphocholine (GPC) + free choline), creatine/phosphocreatine (Cr/PCr), and lipids were also derived from unlocalized DW 1H MR spectra. Signals from energy metabolites, pH, and the phospholipid metabolites PC and PE were obtained from global 1D 31P MR spectra. The first contact of cancer cells with the ECM gel during the loading of the sample was defined as the zero time point. The extent of ECM degradation was estimated by drawing a region of interest (ROI) around the ECM gel region using NIH ImageJ software. The degradation index at time “t” was defined as (ROIt-ROIt1)/ROIt1, where t1 is the first image acquired after loading. All MR data were processed using XsOs MR Software. Values are presented as Mean ± SEM of at least three independent measurement.Results and Discussion
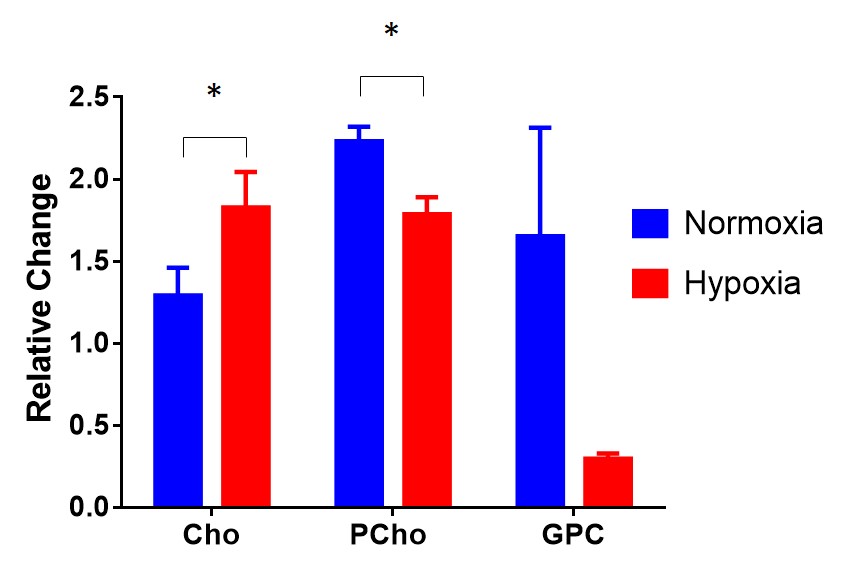
Figure 1a shows representative 1H MR images of ECM gel degradation by myofibroblasts under normoxic and hypoxic conditions, acquired over 48h. Hypoxia triggered a significantly faster degradation of the ECM by myofibroblasts in the first 12 h, but not at later time points (Figure 1b). Metabolites analysis of both 1H and 31P MR spectra identified increased free choline (Cho) and decreased phosphocholine (PCho) and glycerophosphocholine (GPC), as shown in Figure 2. These data indicate that hypoxia significantly modifies ECM degradation and metabolism of myofibroblasts. The data suggest that modulation of oxygen tensions may be used to modify myofibroblast behavior that may that have implications for wound healing, fibrosis, and cancer.Acknowledgements
Supported by NIH R35 CACA209960. JPT was supported by Alonso Martin Escudero foundation.References
1. Zent J and Guo LW. Signaling Mechanisms of Myofibroblastic Activation: Outside-in and Inside-Out. Cell Physiol Biochem. 2018; 49(3):848-868.
2. Glentis A, Oertle P, Mariani P, et al. Cancer-associated fibroblasts induce metalloprotease-independent cancer cell invasion of the basement membrane. Nat Commun. 2017; 8(1):924.
3. Labernadie A, Kato T, Brugues A, et al. A mechanically active heterotypic E-cadherin/N-cadherin adhesion enables fibroblasts to drive cancer cell invasion. Nat Cell Biol. 2017; 19(3):224-237.
4. Valencia T, Kim JY, Abu-Baker S, et al. Metabolic reprogramming of stromal fibroblasts through p62-mTORC1 signaling promotes inflammation and tumorigenesis. Cancer Cell. 2014; 26(1):121-135.
5. Penet MF, Kakkad S, Pathak AP, et al. Structure and Function of a Prostate Cancer Dissemination-Permissive Extracellular Matrix. Clin Cancer Res. 2017; 23(9):2245-2254.
6. Webber MM, Trakul N, Thraves PS, et al. A human prostatic stromal myofibroblast cell line WPMY-1: a model for stromal-epithelial interactions in prostatic neoplasia. Carcinogenesis. 1999; 20(7):1185-92.
7. Ackerstaff E, Artemov D, Gillies RJ, et al. Hypoxia and the presence of human vascular endothelial cells affect prostate cancer cell invasion and metabolism. Neoplasia. 2007; 9(12):1138-51.
Figures