2296
Water T2 is altered with hepatic lipid fraction at 3 Tesla1Department of Radiology, Maastricht University Medical Centre, Maastricht, Netherlands, 2Nutrition and Movement Sciences, NUTRIM school for Nutrition and Translational Research in Metabolism, Maastricht, Netherlands, 3Internal medicine, Maastricht University Medical Centre, Maastricht, Netherlands
Synopsis
1H-MRS is extensively used to measure the hepatic lipid content. Conventionally, the water resonance is used as an internal reference, thereby assuming a constant T2 decay of water across individuals to estimate absolute hepatic lipid content. However, the T2 values reported in literature for 3T vary widely, which might be due to different subject populations and/or other methodological discrepancies. The purpose of this study was to measure T2 of water in a group of subjects with a wide range of hepatic lipid content and to evaluate whether there is a dependence of water T2 relaxation times and hepatic lipid fraction.
Introduction
Materials and Methods
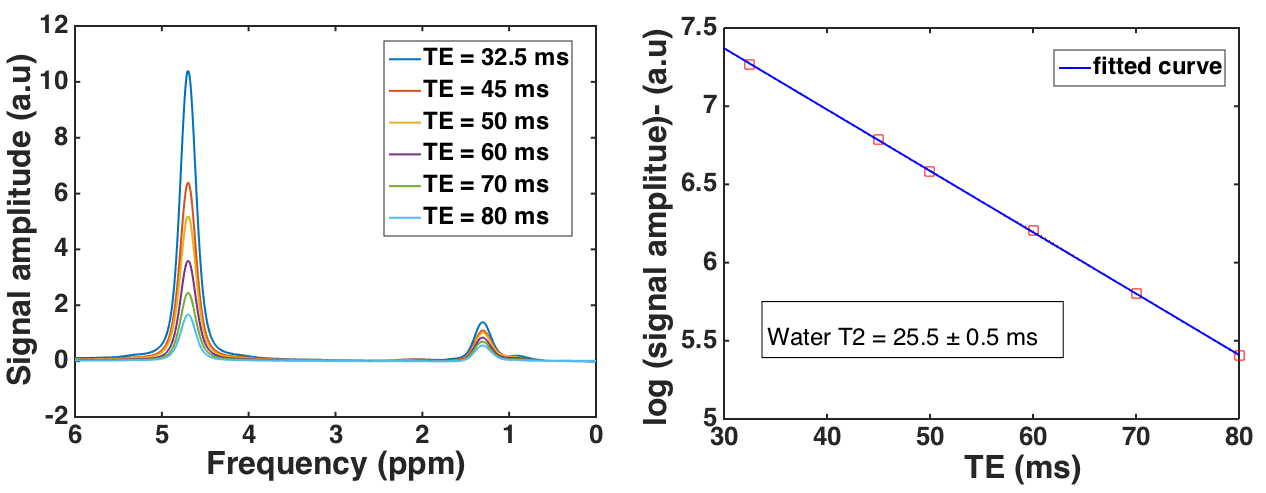
All experiments were performed on a 3T MR system (Achieva 3T-X, Philips Healthcare, Best, Netherlands) by using a 32-channel sense cardiac/torso coil (Philips Healthcare, Best, Netherlands). A total of 23 subjects (m/f = 10/13), age between 19-60 years and BMI between 21-35 kg/m2, were included in this study. In vivohepatic spectra were acquired with a series of 6 TEs (32.5, 45, 50, 60, 70 and 80 ms) without water suppression using PRESS (TR =4000 ms, NSA=16, Voxel=20x20x20 mm). The TR of 4000 ms was chosen to allow the subjects to breath in the rhythm of the measurement (acquisition at end expiration) and to avoid saturation effects due to T1 relaxation. All obtained hepatic spectra were post-processed in a home-written MATLAB script (including frequency, phase alignment, eddy current correction and fitting of the water resonance). The T2 of water was measured by fitting a mono-exponential decay curve. The hepatic lipid fraction (CH2/water) was calculated from the uncorrected peak areas of CH2(1.3 ppm) and water from the post-processed spectra acquired at TE =32.5 ms. The pearson correlation was calculated to find the relationship between water T2 and the hepatic lipid fraction.Results and discussion
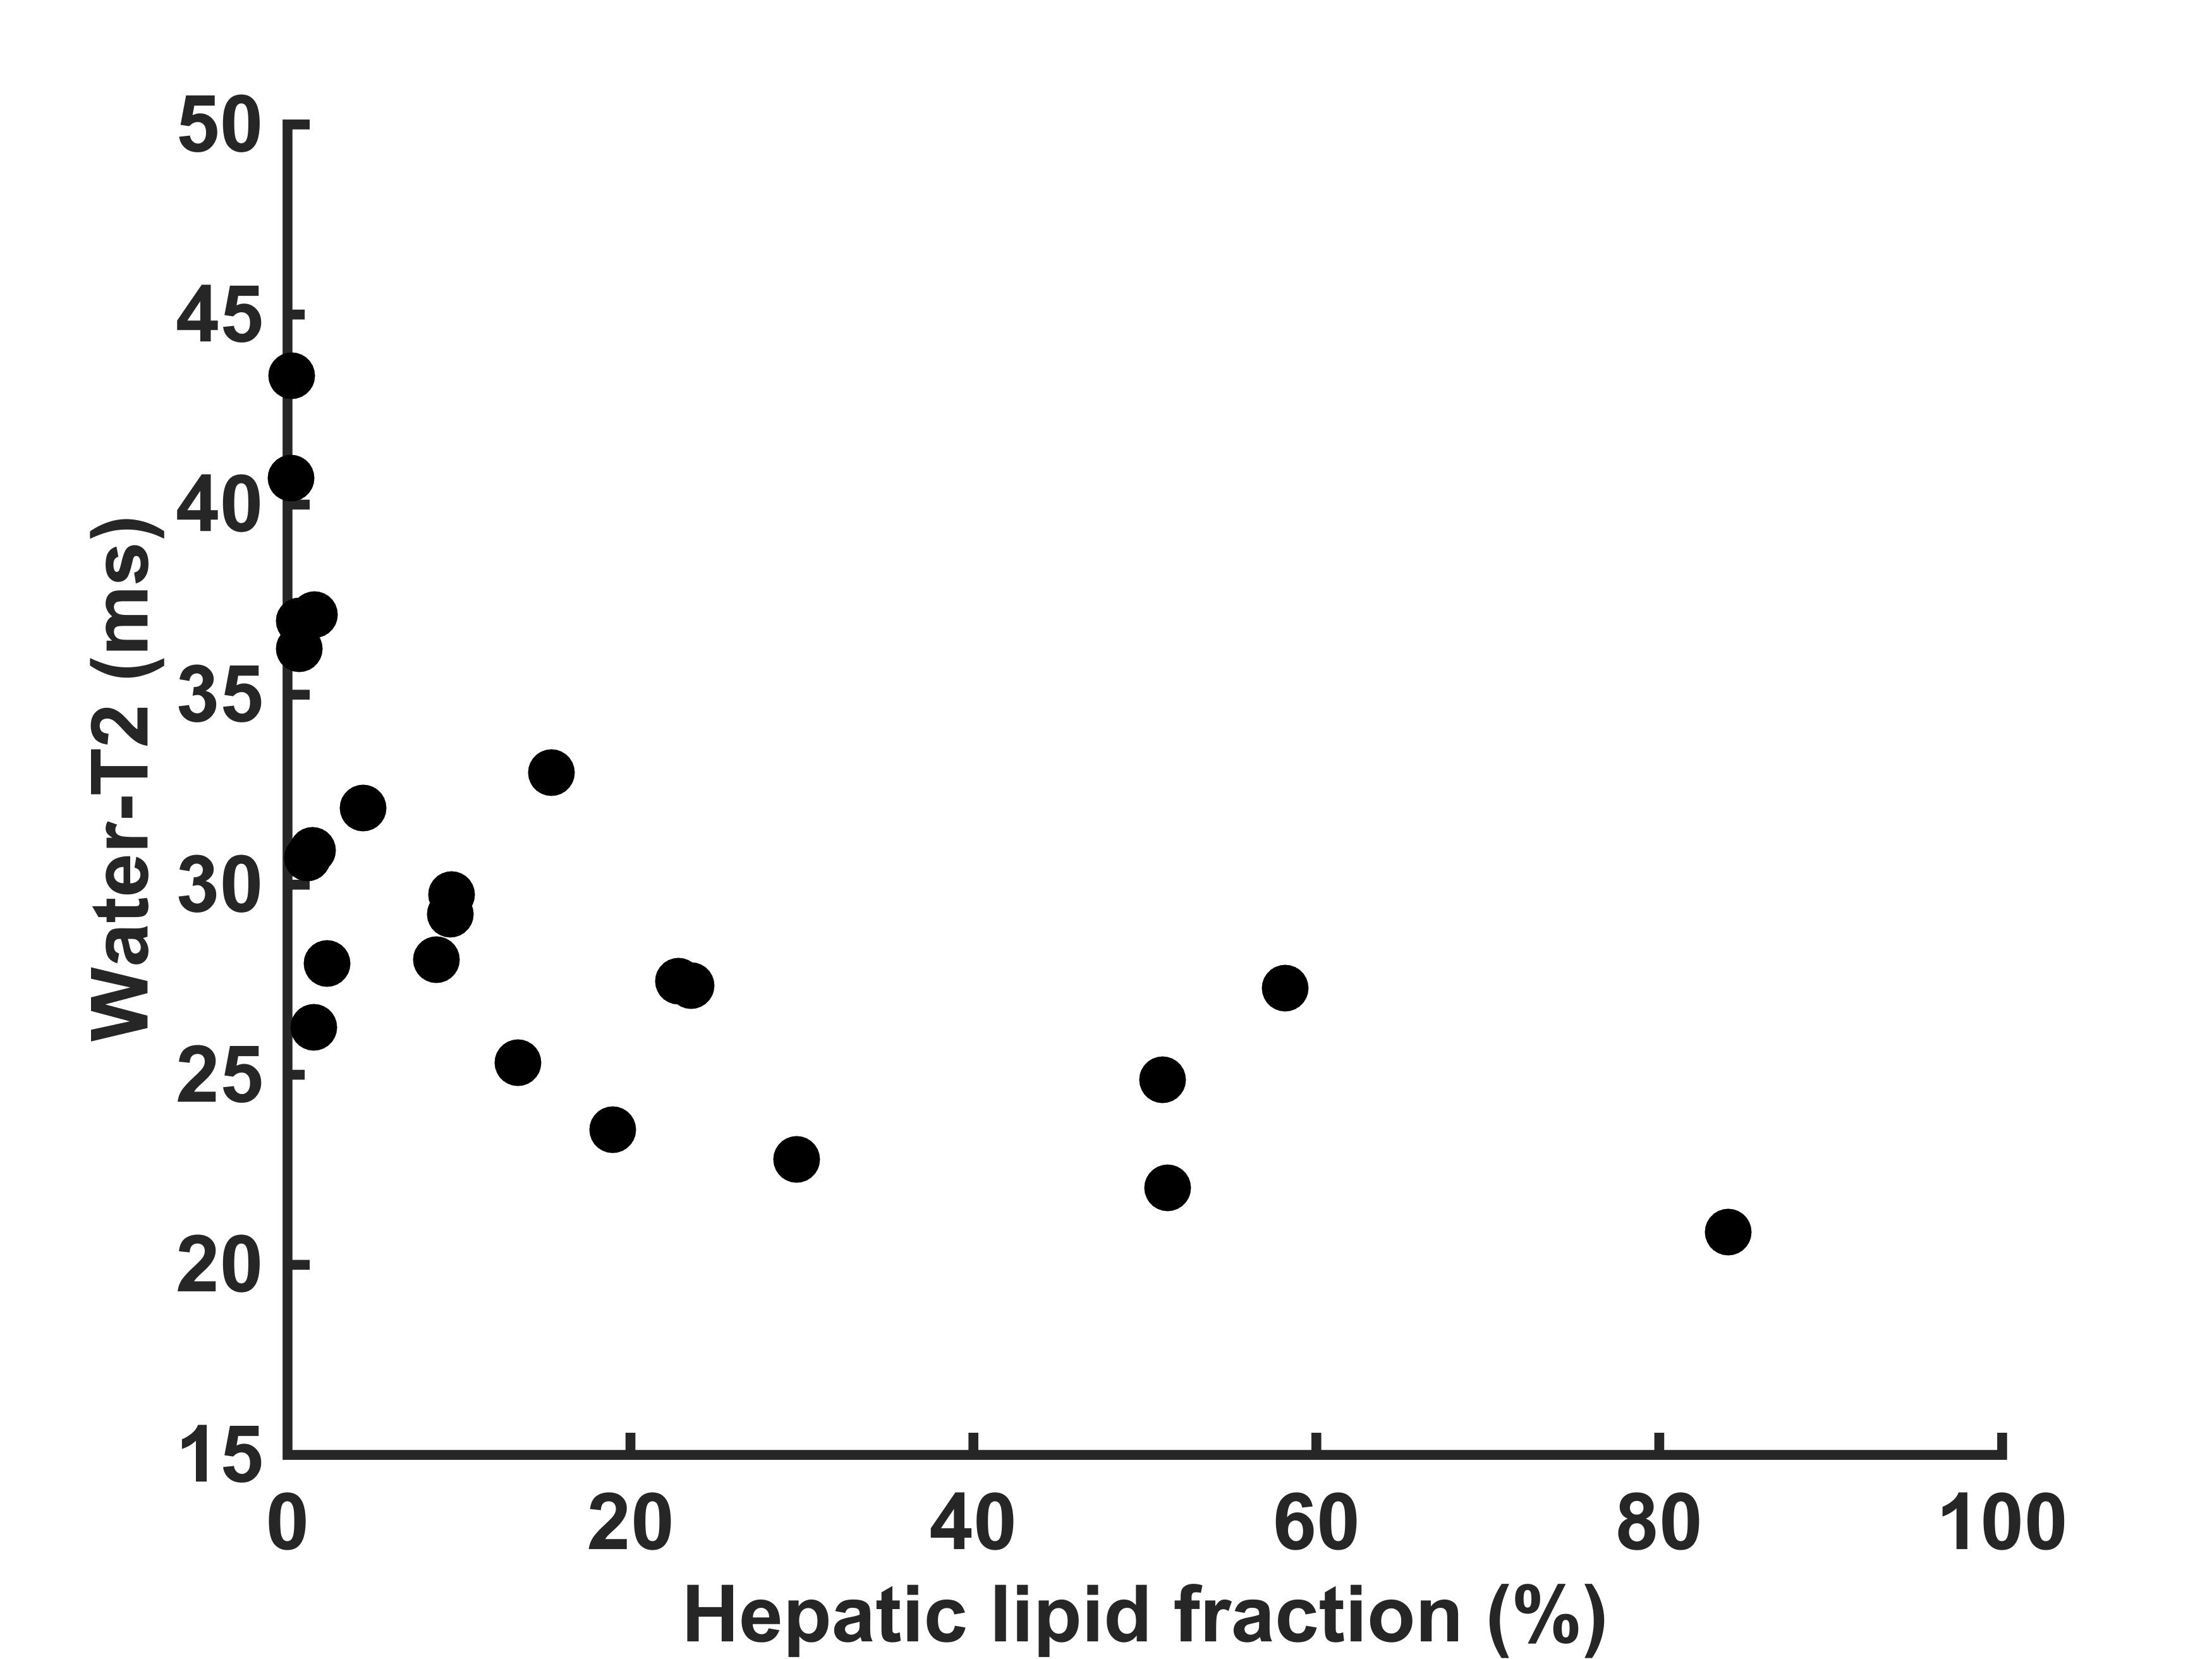
The T2 fit was successful for all subjects with a 95% confidence interval in the range of ± 8% (Fig 1). The average T2 of water was found to be 30 ± 6 ms and the (uncorrected) CH2/water ratio ranged from 0.2% to 84%.The measured water T2 values were found to vary in the range from 21 to 43 ms (Fig 2). We found a significant negative correlation (P=0.001; Pearson correlation=-0.66) between the water T2 relaxation time and the uncorrected hepatic CH2/water ratio. This finding suggests that for absolute quantification of hepatic lipid content, correction with a single T2 relaxation time for water for all subjects is not accurate and can result in two-fold difference in hepatic lipid content. Therefore, individual T2 measurements should be performed and/or different T2 correction factors should be applied in different groups (i.e. depending on hepatic lipid fraction). It is yet unclear what the underlying mechanism is of the association of water T2 with hepatic lipid content, but this will be subject of future studies.Conclusion
We found shorter water T2 relaxation times in subjects with elevated hepatic lipid content. Our results suggest that correction of the water signal intensity with a single T2 value for all subjects is not appropriate. The individual measurement of the T2 of water would lead to a more reliable determination of the hepatic lipid content.Acknowledgements
The collaboration project is financed by the Ministry of Economic Affairs and Climate Policy by means of the PPP Allowance made available by the Top Sector Life Sciences & Health to stimulate public-private partnerships.References
1. Thomsen C, Becker U, Winkler K, et al. Quantification of liver fat using magnetic resonance spectroscopy. Magn. Reson. Imaging.1994;12(3):487–495.
2. Szczepaniak L.S, Nurenberg P, Leonard D, et al. Magnetic resonance spectroscopy to measure hepatic triglyceride content: prevalence of hepatic steatosis in the general population. Am. J. Physiol. Endocrinol. Metab.2005;288(2)E462-468.
3. Gambarota G, Tanner M, van der Graaf M, et al. 1H-MRS of hepatic fat using short TR at 3T: SNR optimization and fast T2 relaxometry. Magma N. Y. N. 2011;24(6):339–345.
4. Hamilton G, Middleton M S, Bydder M, et al. Effect of PRESS and STEAM sequences on magnetic resonance spectroscopic liver fat quantification. J. Magn. Reson. Imaging JMRI.2009;30(1):145–152.
5. Guiu B, Petit J M, Loffroy R et al. Quantification of liver fat content: comparison of triple-echo chemical shift gradient-echo imaging and in vivo proton MR spectroscopy. Radiology 2009;250(1): 95–102.
Figures