2294
Quantifying the CEST@2ppm from 5-pool Lorentzian fitting in the substantia nigra of acute MPTP mouse models at 7 Tesla1Southern Medical University, Guangzhou, China
Synopsis
Non-invasive and quantifiable diagnosis of Parkinson’s disease is an ongoing challenge for researchers. In this study, we worked on the CEST signal at 2ppm (CEST@2ppm) in the substantia nigra of acute 1-methyl-4-phenyl-1,2,3,6-tetrahydropyridine (MPTP) mouse models at three different time points including pre and 3rd day, 10th day after treatment. CEST@2ppm after 5-pool lorentzian fitting showed a statistically significant difference after MPTP injection and metrics based on this fitting model ( MTRrex and AREX) also indicated positive correlation of CEST@2ppm with the SN damages while the statistic difference of 3rd and 10th day was not significant. This quantifying CEST signal may reflect the pathological mechanism of PD in SN.
Introduction
Non-invasive and quantifiable diagnosis of Parkinson’s disease is an ongoing challenge for relative researchers. Chemical exchange saturation transfer imaging (CEST), as an newly- developing molecular imaging technique, had shown its potentials in detection of intracerebral hemorrhage and cerebral ischemia5, differentiation between radiation necrosis and tumor procession4. In 2016, Puneet et al. found that GluCEST could be used to map the alteration in glutamate in subacute MPTP mouse model2, while Chen M et al. succeeded in applying APT to diagnosis of PD 3. In this study, our purpose was to confirm the correlation between CEST@2ppm and the damage of substantia nigra in acute MPTP mouse model.Method
The institutional animal care and use committee of the Southern Medical University approved all the experimental protocols in this research. All male C57BL/6 mice (6-8 week) were purchased from Laboratory Animal Center of Southern Medical University (Guangzhou, China). Experimental mice were divided into two groups: Group 1, control (without MPTP injection, n=6); Group 2, MPTP (administrated intraperitoneally with four doses of 20 mg/kg at 2h intervals, n=12).All imaging experiments were performed at 7.0T (PharmaScan; Bruker, Germany). Animals were anesthetized (1.5~2.5% isoflurance mixed with air) and tightened to body-bed inside a 60 mm diameter volume coil with the mouse-specific receive-only surface coil. All mice were scanned to create a baseline at day 0 and then scanned again at the 3rd and 10th day after the MPTP group was ready. The whole imaging schedule contained CEST images, the IRSE images, MSME images, WASSR and M0 images. CEST@2ppm images were acquired from one axial slices (1.7 mm thick) and this slice included the SN of the mouse. The CEST imaging sequence consisted of a single rectangular off-resonance RF pulse lasting 3s (B1 = 2μT) followed by a RARE readout with TR/TE=5s/4ms (FOV = 13×12 , matrix = 130×110, RARE factor=23 and two averages). The entire Z-spectrum contained 49 images acquired at various saturation offsets from -1200 to 1200 Hz in an increment of 50 Hz and one extra image captured at 30000Hz as M0 for normalization. The total imaging time for entire Z-spectrum was about 35min. Following Z-spectrum acquisition, a water saturation shift reference (WASSR) method was applied to correct Z-spectrum shift cause by the B0 field inhomogeneity after shimming. Images from inversion recovery sequence that was used for T1 mapping were acquired by a saturation recovery gradient echo sequence with 7 contrasts at different recovery times between 118ms and 5.5s. And the T2 mapping was obtained through the MSME sequence with 25 different TE equally varied from 9.5 to 237.5ms. Determination of the SN was manually performed on the T2-weighted anatomical MR images, and ROIs were overlapped on the CEST@2ppm maps. Data were processed in MATLAB(MathWorks, Natick, MA). T1 and T2 were acquired via least squares fitting of image intensity respectively as a function of inversion time and echo time. Then the B0-corrected data from CEST images were fitted using a modified 5-pool Lorentzian model using the Levenberg-Marquardt algorithm and the metrics MTRrex and AREX were calculated according to 6. $$\frac{M_{Z}(\Delta \omega )}{M_{0}(\Delta \omega )}= Z(\Delta \omega)=Z_{base}-\sum L_{i}(\Delta \omega)$$[1]
with $$L_{i}(\Delta \omega)=A_{i}\frac{\frac{\Gamma_{i} ^{2}}{4}}{\frac{\Gamma_{i} ^{2}}{4}+(\Delta \omega-\delta _{i})^{2}} $$[2]
The lorentzian function Li of each pool is composed of the offset frequency Δω , amplitude Ai and FWHM Γi2 , δi the displacement from the resonance frequency of free water.
Results
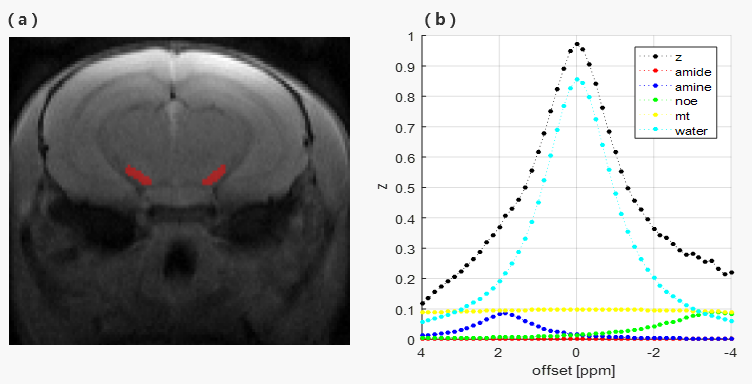
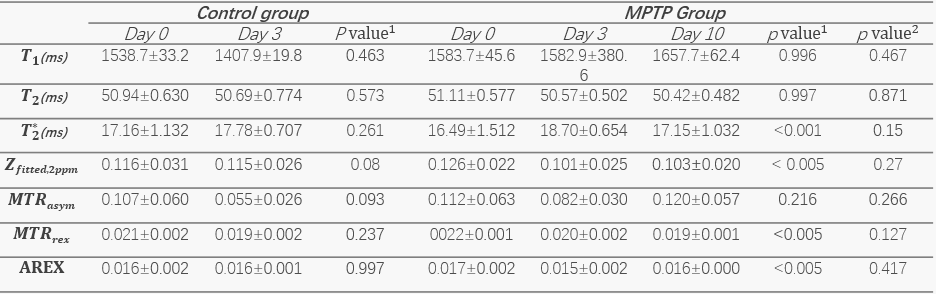
Figure 1 showed the CEST image at -4 ppm of a mouse and the plot of five-pool lorentzian fitting curves and Z spectrum. In the control group, T1 and T2, T2*, Zfitted,2ppm, MTRasym, MTRrex and AREX (Fig. 2) shown no significant alterations between day 0 and day 3, while there was a significant decrease of MTRrex and AREX in the modeling group after injection of MPTP as well as a significantly changing T2* value. All metrics above indicated no significant changes between datasets from the MPTP mice group at day 3 and day 10.Discussion and Conclusion
The changing T2* in Parkinson’s disease patients due to the iron accumulation in substantia nigra was reported 1 but hard to be verified in animal models since there was not much iron overload. From the MTRrex and AREX, we can know that the molecules or proteins that contribute to CEST@2ppm are getting less after damages of SN in mouse’s brain. We consider that the difference at 2ppm comes from the loss of death of dopaminergic neurons and the consequential altering protein level since the researchers generally attribute the signal at 2ppm to the chemical exchange of creatine and other proteins. Therefore, the quantifying signal at 2ppm maybe reflects the destroying mechanism of PD in SN.Acknowledgements
No acknowledgement found.References
1 J. Acosta-Cabronero, A. Cardenas-Blanco, M. J. Betts, M. Butryn, J. P. Valdes-Herrera, I. Galazky, and P. J. Nestor, 'The Whole-Brain Pattern of Magnetic Susceptibility Perturbations in Parkinson's Disease', Brain, 140 (2017), 118-31.
2 P. Bagga, R. Crescenzi, G. Krishnamoorthy, G. Verma, R. P. Nanga, D. Reddy, J. Greenberg, J. A. Detre, H. Hariharan, and R. Reddy, 'Mapping the Alterations in Glutamate with Glucest Mri in a Mouse Model of Dopamine Deficiency', J Neurochem, 139 (2016), 432-39.
3 C. Li, S. Peng, R. Wang, H. Chen, W. Su, X. Zhao, J. Zhou, and M. Chen, 'Chemical Exchange Saturation Transfer Mr Imaging of Parkinson's Disease at 3 Tesla', Eur Radiol, 24 (2014), 2631-9.
4 Hatef Mehrabian, Kimberly L. Desmond, Hany Soliman, Arjun Sahgal, and Greg J. Stanisz, 'Differentiation between Radiation Necrosis and Tumor Progression Using Chemical Exchange Saturation Transfer', Clinical Cancer Research, 23 (2017), 3667-75.
5 Meiyun Wang, Xiaohua Hong, Che-Feng Chang, Qiang Li, Bo Ma, Hong Zhang, Sinan Xiang, Hye-Young Heo, Yi Zhang, Dong-Hoon Lee, Shanshan Jiang, Richard Leigh, Raymond C. Koehler, Peter C. M. van Zijl, Jian Wang, and Jinyuan Zhou, 'Simultaneous Detection and Separation of Hyperacute Intracerebral Hemorrhage and Cerebral Ischemia Using Amide Proton Transfer Mri', Magnetic Resonance in Medicine, 74 (2015), 42-50.
6 J. Windschuh, M. Zaiss, J. E. Meissner, D. Paech, A. Radbruch, M. E. Ladd, and P. Bachert, 'Correction of B1-Inhomogeneities for Relaxation-Compensated Cest Imaging at 7 T', NMR Biomed, 28 (2015), 529-37.
Figures