2290
Neurochemical evolution of murine embryonic brain, an in vivo 1H MRS study at 14.1T1Center for Biomedical Imaging (CIBM), Ecole Polytechnique Fédérale de Lausanne (EPFL), Lausanne, Switzerland, 2Faculty of Medicine, University of Geneva, Geneva, Switzerland, 3Faculty of Science, University of Geneva, Geneva, Switzerland
Synopsis
1H MRS study of embryonic brain development is feasible and offers valuable insights towards early brain development in utero.
INTRODUCTION
Neurochemical profiling murine embryonic brain in utero may shed insights towards normal fetal brain development and opens possibilities to investigate large number of transgenic mouse models.METHODS
All animal study was performed according to the local ethical guidelines for in vivo experimentation.Three pairs of adult C57/BL mice underwent timed mating at the end of the day and the presence of a vaginal plug was checked the following morning. This time was taken as E0.5. Embryonic brain was studied at E12.5-13 and E17.5-18.
A quadrature coil (two geometrically decoupled 16-mm-diameter loops) was used for radio-frequency transmitting and receiving. The pregnant animals were lying on the surface coil with one side. Throughout the entire study, animals were kept anesthetized under 1.5-2% isoflurane mixed with air and oxygen (1:1) through a mask to maintain their respiration rates within the range of 80-100 beats-per-minute. Their body temperatures were monitored (SA Instruments. U.S.A.) and well-maintained at 36-37°C by circulating warm water via silicon tubes. Anatomical images were acquired with fastest spin echo (FSE, effective echo time (TEeff)/repetition time (TR) = 50/4000 ms, 4 averages, 256×256 data matrix) with sufficient field-of-view (30×30mm2). Once embryo brain volume was identified, field homogeneity was improved by adjusting 1st and 2nd order shim terms using FASTMAP (Fast, Automatic Shimming Technique by Mapping Along Projections, 1) and the resulting water linewidths were no more than 25 Hz. STEAM (TE/TM/TR=2.8/20/4000ms, 2) and SPECIAL (TE/TR=2.8/4000ms, 3) with outer volume suppression and water suppression was used for localized 1H MRS. When comparing to those spectra from the identical volume using STEAM, both spectra at TE=2.8ms in solution were nearly identical and no substantial differences from in vivo studies (3). Thus, both spectral results with quality were reported. Typical volumes for embryonic brain at E12.3-13 were 5.5-7 μL and at E17.5-E18 were 15-18 μL. To reach satisfactory signal-to-noise ratios (SNRs), sufficient number of scans were acquired, e.g. 240-480 for STEAM and 80-160 for SPECIAL, respectively.
LcModel (4) was applied to analyze spectral data referencing to the endogenous water (90%, 5). All metabolites except macromolecules (Mac) in the basis set of the LCModel were simulated, i.e. alanine (Ala), ascorbate (Asc), aspartate (Asp), creatine (Cr), myo-inositol (Ins), γ-aminobutyric acid (GABA), glucose (Glc),glutamine (Gln), glutamate (Glu), glycine (Gly), glycerophosphocholine(GPC), glutathione (GSH), lactate(Lac), N-acetyl-aspartate (NAA), N-acetyl-aspartylglutamate(NAAG), phosphocholine (PCho),phosphocreatine (PCr), phosphorylethanolamine (PE),scyllo-inositol (scyllo), and taurine (Tau). The sum of slected metabolites, i.e. Glu and Gln (Gln+Glu), NAA and NAAG (NAA+NAAG), total choline (GPC+PCho) and total creatine (PCr+Cr), were reported. In this study, some metabolites may exhibit low contents at early embryonic stage and then evolve with embryonic brain development. Given the CRLBs are not only factors influencing quantification(6), all metabolites were analyzed.
RESULTS AND DISCUSSION
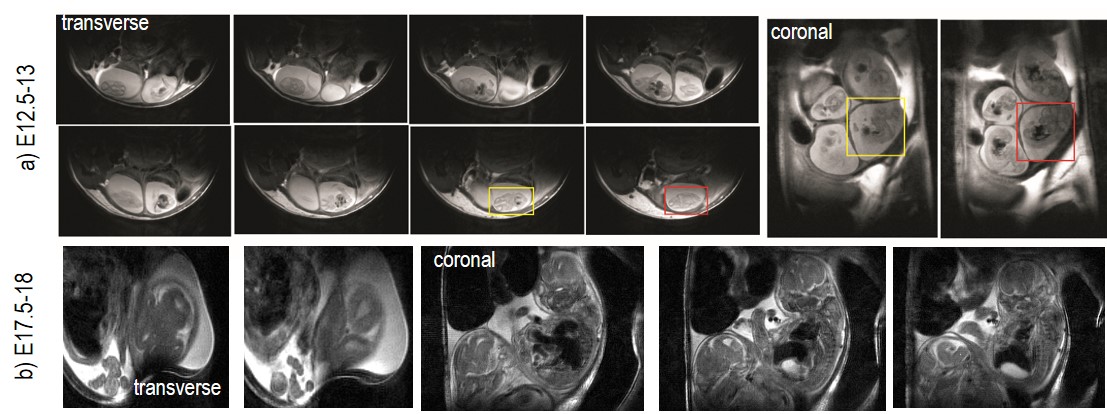
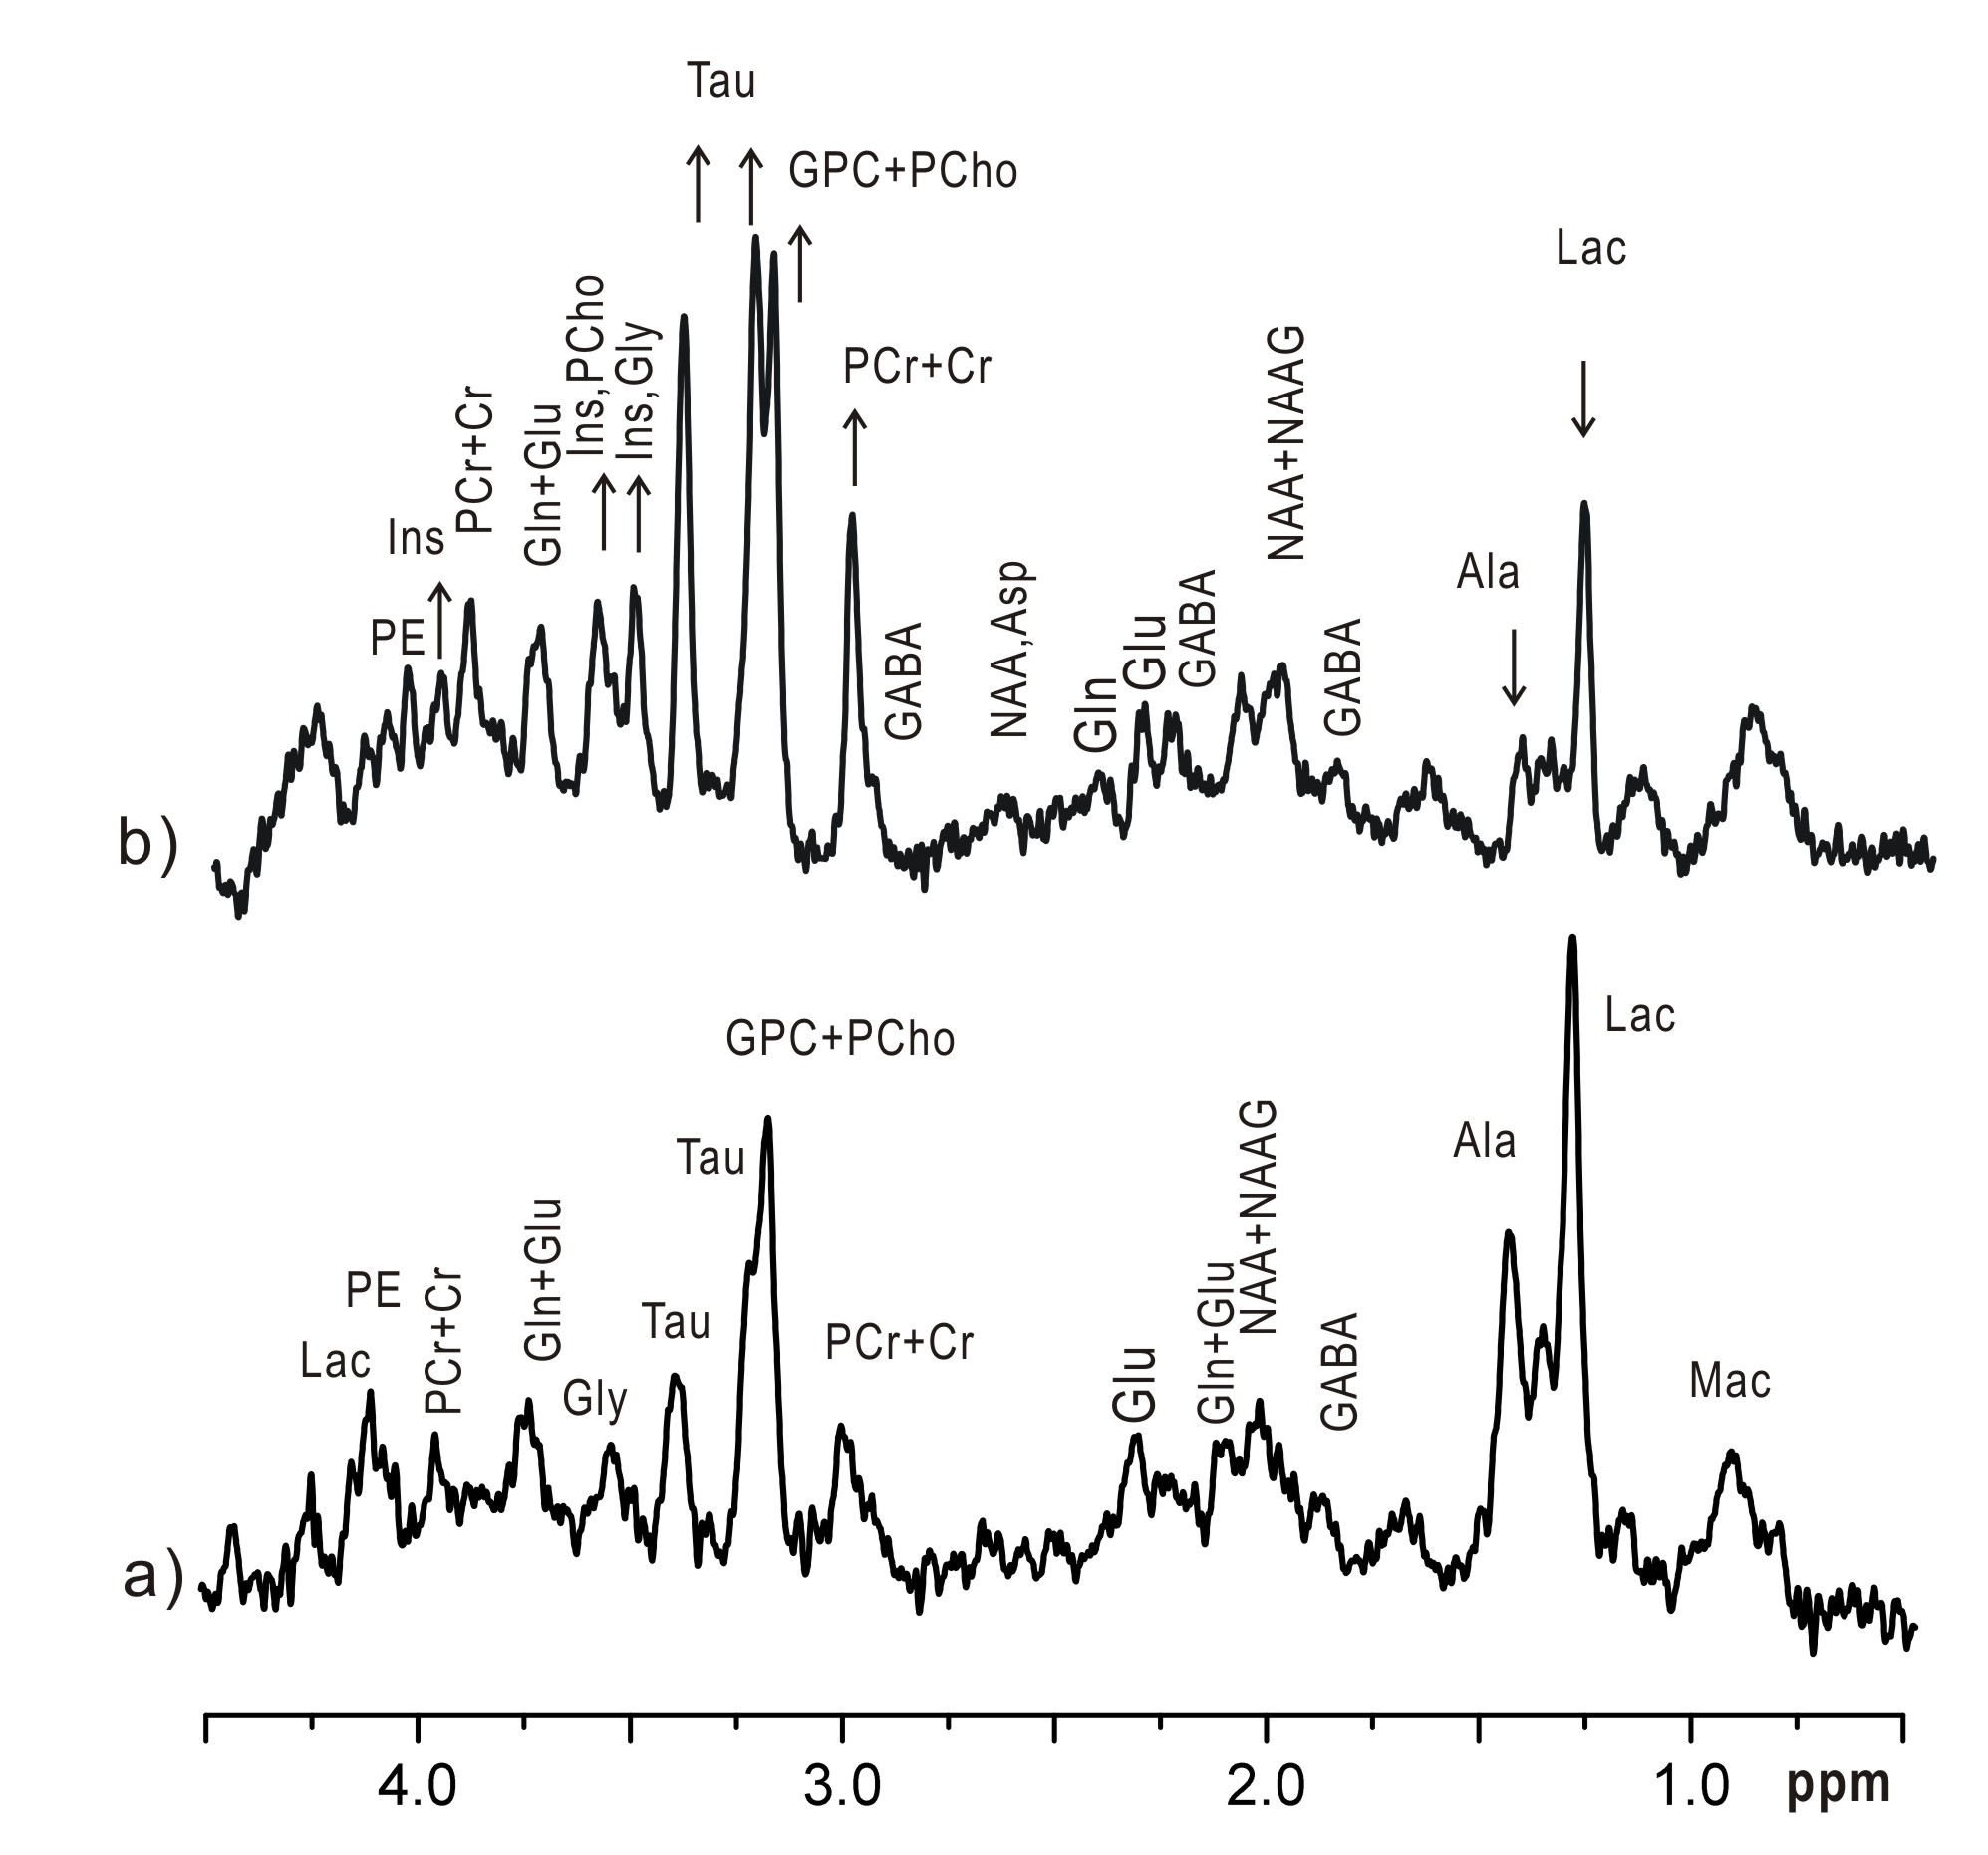
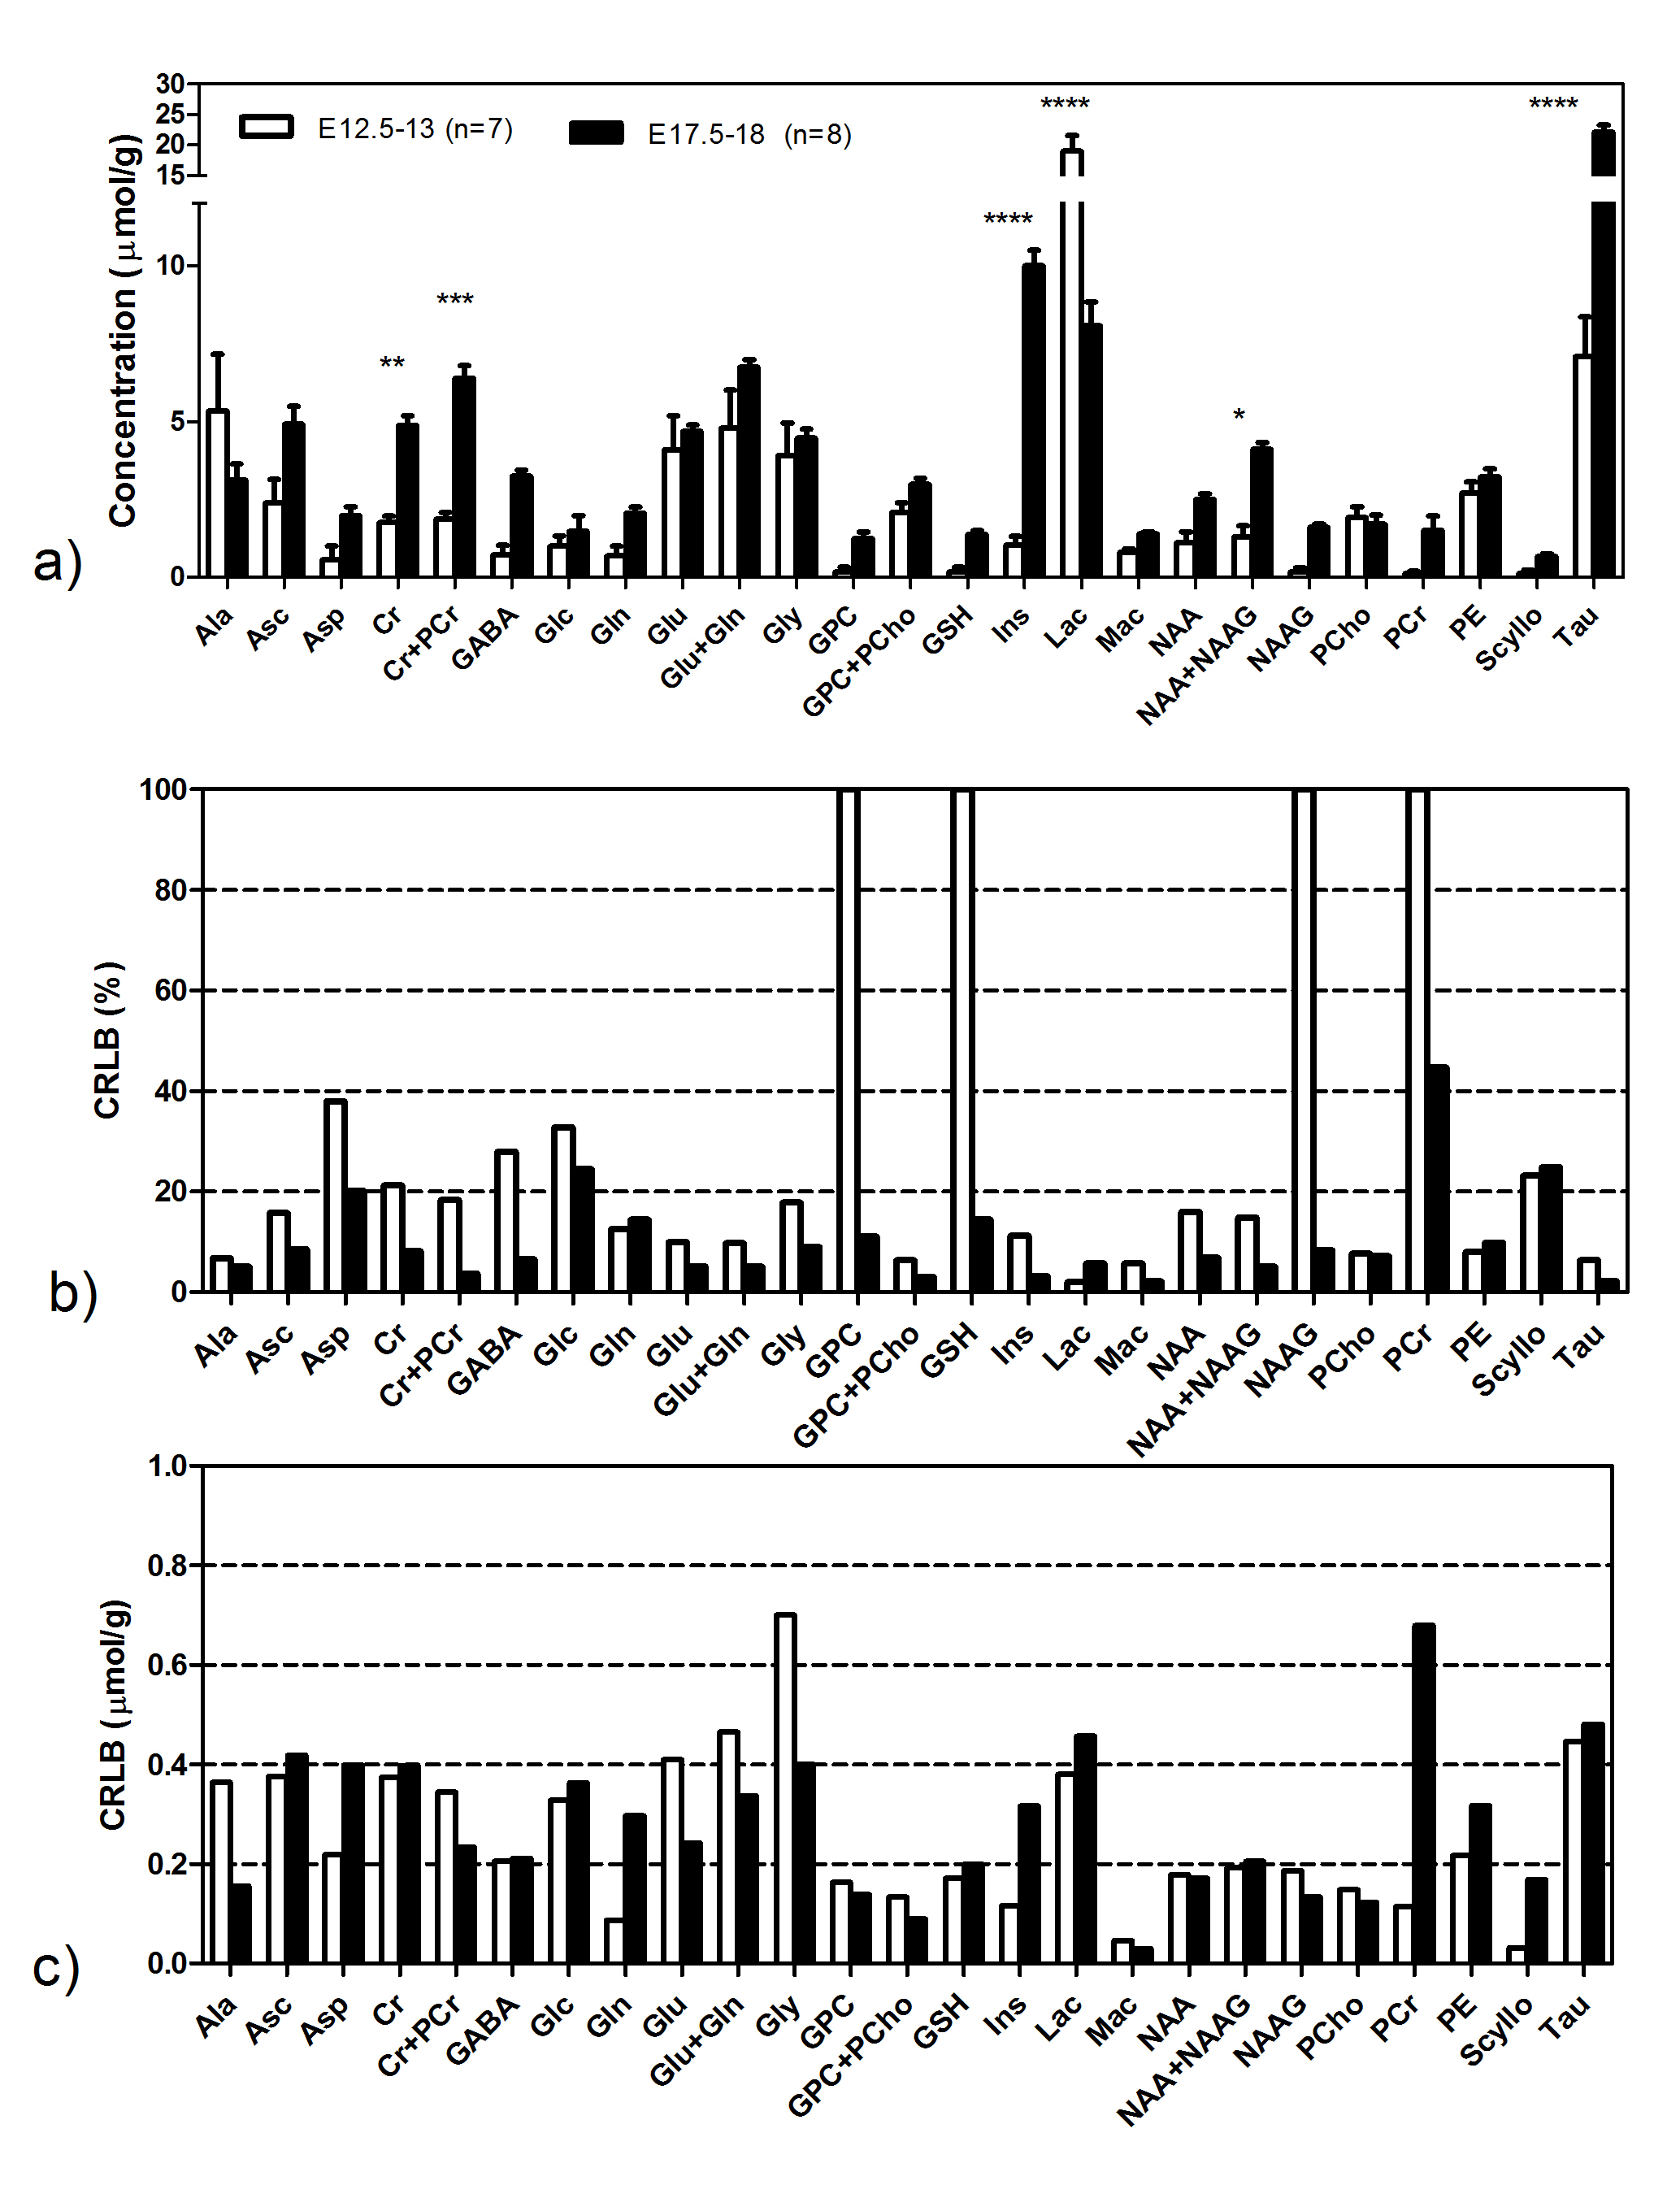
Anatomical images were obtained with sufficient resolution to depict embryonic brain, its structures and development (Figure 1). Immediately after improvements of field homogeneity, MR spectra with sufficient scans and satisfactory water suppression exhibited adequate quality to identify numerous metabolite resonances, e.g. Tau, Lac, Ala, Glu, GPC+PCho, PCr+Cr, Gly, Glu+Gln, NAA+NAAG, PE and Mac etc ( Figure 2). At E17.5-18, increased number of resonances appeared in the spectra, e.g. Gln and Ins etc. In addition, some resonances exhibited amplitude changes, such as reductions in Ala and Lac, and increases in Ins, Tau, GPC+PCho and PCr+Cr etc. Further quantification of such quality spectra at E12.5-13, e.g. SNRs = 20±3, the resulting neurochemical profile of embryonic brain confirmed spectral observations and further revealed more metabolites in embryonic brains (Figure 2B). Among these metabolites, 11 metabolites were quantified with the satisfactory CRLBs: Tau, Lac, Ala (two with CRLBs>100%), Glu, GPC+PCho, PCr+Cr, Gly, Glu+Gln, NAA+NAAG (one with CRLBs>100%), PE (one with CRLBs>100%) and Mac. At E17.5-18, SNR of 14±1 was achieved. Most metabolites were quantified with the averaged CRLBs less than 25%, except Asp, PCr and GPC, which have one or two concentration value quantified with CRLBs>100%. Such neurochemical profile of embryonic brain at E17.5-18 confirmed spectral differences (Figure 2) and was noticeably different from the neurochemical profile of brain at E12.5 (Figure 3).
In this study, we applied anatomical MRI to locate embryonic brains of mouse in utero as early as E12.5-13. Typical neurochemical profile of embryonic brains is, to our knowledge, the first to be reported in mice. The resulting abundant metabolic information from short echo 1H MRS extends the limited number of metabolites from human fetal brain, e.g. NAA, Glu, Ins and choline containing compounds (7), to 18 metabolites. The non-invasive characteristics of MR techniques allow us following metabolic development longitudinally. Thus, the further 1H MRS assessments of embryonic brains at E17.5-18 revealed substantial neurochemical evolution towards the birth.
Acknowledgements
This work was supported by the Center for Biomedical Imaging (CIBM) of the University of Lausanne (UNIL), University of Geneva (UNIGE), Geneva University Hospital (HUG), Lausanne University Hospital (CHUV), École Polytechnique Fédérale de Lausanne (EPFL) and the Leenaards and Louis-Jeantet FoundationsReferences
1. Gruetter R and Tkac I. Field mapping without reference scan using asymmetric echo-planar techniques. Magn Reson Med. 2000; 43: 319-23.
2. Tkáč, I., Starčuk, Z., Choi, I.-Y. and Gruetter, R. (1999), In vivo 1H NMR spectroscopy of rat brain at 1 ms echo time. Magn Reson Med, 41: 649–656.
3. Mlynarik V, Gambarota G, Frenkel H and Gruetter R.(2006) Localized short-echo-time proton MR spectroscopy with full signal-intensity acquisition. Magn Reson Med. 56: 965-70.
4. Provencher, S. W. (1993), Estimation of metabolite concentrations from localized in vivo proton NMR spectra. Magn Reson Med, 30: 672–679.
5. Katzman, R., and Pappius, H. (1973). Brain Electrolytes and Fluid Metabolism, Williams & Wilkins, Baltimore, pp. 1–13
6. Kreis R. 2016 The trouble with quality filtering based on relative Cramer-Rao lower bounds. Magn Reson Med. 75: 15-8
7. Brighina E, Bresolin N, Pardi G and Rango M. Human fetal brain chemistry as detected by proton magnetic resonance spectroscopy. Pediatr Neurol. 2009; 40: 327-42
Figures