2289
Magnetic Resonance Spectrum Simulator (MARSS): Software for Fast and Reliable Simulation of Spin Systems1Biomedical Engineering, Columbia University, New York, NY, United States, 2Radiology, Columbia University, New York, NY, United States
Synopsis
Accurate density matrix simulation of nuclear spin systems is critical for quantifying magnetic resonance spectroscopy (MRS) data, as well as for simulation studies designed to optimize acquisition parameters. Although a variety of packages exist to achieve this result, no currently available software is capable of computing a large number of spatial points in a reasonable time frame. Here we present and experimentally validate a novel MATLAB-based software package able to compute complex spin systems, including those exhibiting scalar coupling like GABA, for 643 spatial points within 25 minutes.
Introduction
Accurate density matrix simulation of nuclear spin systems is critical for quantifying magnetic resonance spectroscopy (MRS) data, as well as for simulation studies designed to optimize acquisition parameters. A variety of packages designed to simulate spin systems currently exist; most, however, were developed for nuclear magnetic resonance (NMR) experiments, for which spatial integration is not required due to the absence of localization pulses. No currently available software is capable of handling a large number (643 or more) of spatial points in a reasonable time frame (approximately 1 hour) for complex systems like GABA or glucose, which exhibit 6 and 7 coupled spins, respectively. Here we present and experimentally validate, both phantom and in vivo, a novel spin system simulator implemented in MATLAB (Mathworks, Natick, MA), referred to as MAgnetic Resonance Spectrum Simulator (MARSS). MARSS, in addition to being useful for quantification, can be used to perform simulation studies, such as another one of our submitted abstracts on recommendations to generate accurate basis sets.Methods (Algorithm)
The algorithm behind MARSS consists of the following 8 steps.
Step 1: The position-dependent RF-pulse propagators are constructed for each of the individual RF pulses according to
$$\hat{P}=\prod_{i=1}^{N_p}exp(+i\hat{H_{i,k}}\Delta t) ,$$
where $$$N_p$$$ is the number of time points in the RF pulse, and $$$\hat{H_{i,k}}$$$ is the Hamiltonian for the ith time point and kth spatial location and $$$\Delta t$$$ is the duration of each individual sub-pulse. This employs the so-called T-matrix algorithm2 or 1D projection method3. The chemical shift and J-coupling values are obtained from published constants4,5.
Step 2: The initial state of the density matrix is assumed to be at thermal equilibirium6:
$$ \hat{\rho^{eq}} = \sum_{j=1}^{N_s} \hat{I_{z,j}} ,$$
where $$$N_s$$$ is the number of coupled spins.
Step 3: The density matrix is transformed from its pre-pulse state to its post-pulse state via
$$\hat{\rho}'(x,y,z) = \hat{P}^\dagger \hat{\rho}(x,y,z)\hat{P} ,$$
where superscript $$$\dagger$$$ denotes the Hermitian conjugate.
Step 4: The density matrix undergoes free precession, which is obtained via the solution of the von Neumann equation6.
Step 5: The density matrix is selected according to the equation
$$\rho_f(x,y,z) = F\circ\rho(x,y,z)$$
where $$$\circ$$$ denotes the Hadamard or element-wise multiplication and $$$F$$$ is the filter matrix which has element values of 1 for elements which correspond to the user-defined coherence order for that particular pathway interval and 0 for all other elements, which is a novel method of handling coherence pathways.
Step 6: Steps 3 through 5 are repeated for each of the RF pulses and inter-pulse delays
Step 7: Steps 3 through 6 are repeated for each of the individual user-defined spatial positions and the density matrix is averaged over all spatial positions.
Step 8: The simulated time-domain signal is calculated according to6
$$S(t) = \sum_{j=1}^{N_s}Tr[\hat{\rho}(t)(\hat{I_{x,j}}-i\hat{I_{y,j}}]$$
for each of the time-domain signal points.
Methods (Experimental Validation)
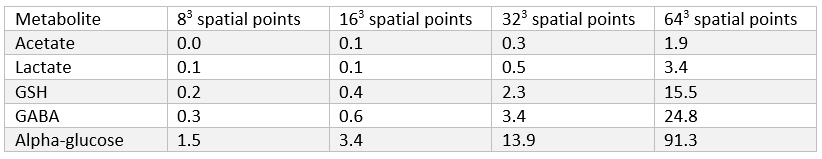
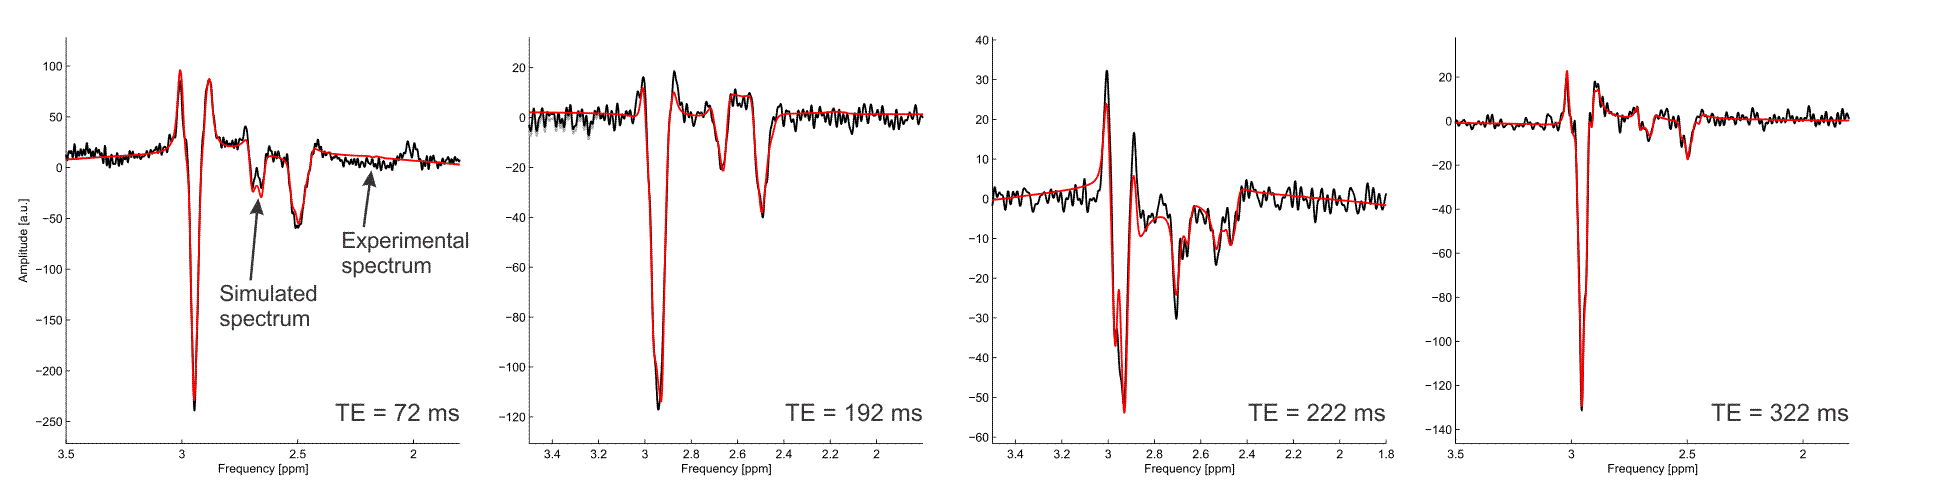
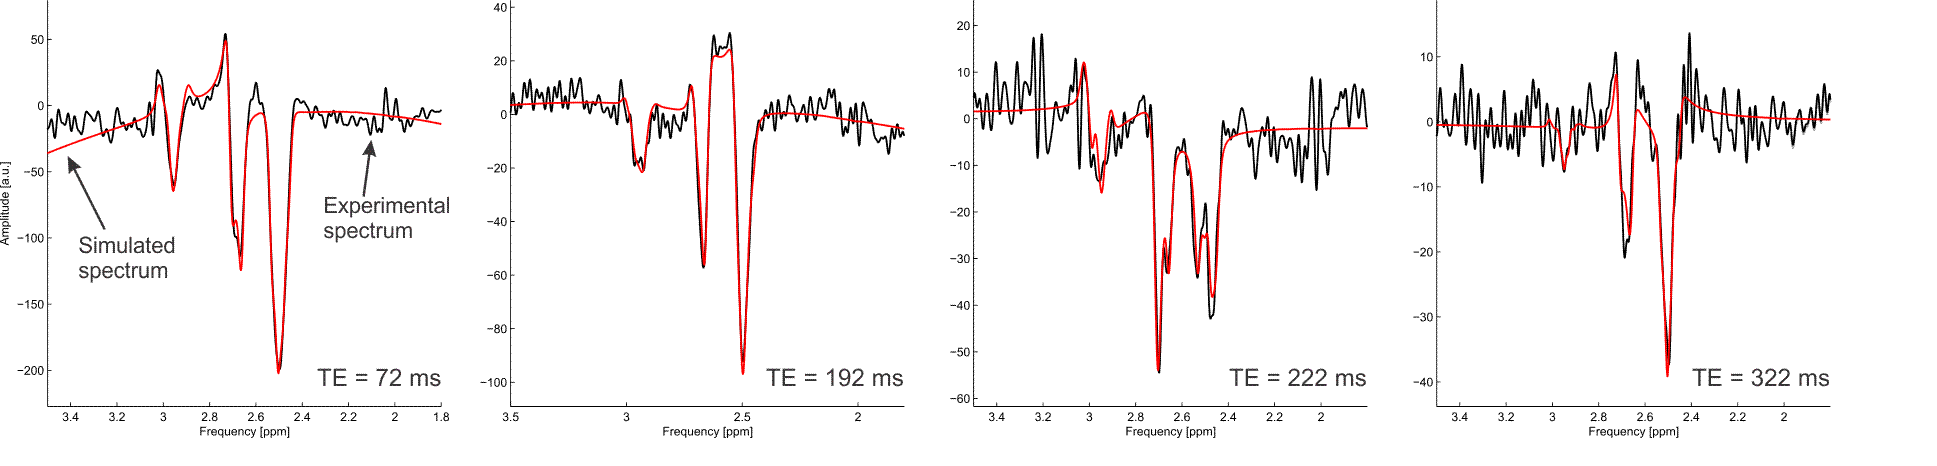
MARSS was validated using data from a 7-Tesla head-only human MR system (Varian Medical Systems, Inc., Palo Alto, CA, USA). A MEGA-sLASER7 sequence with TEs of 72, 192, 222 and 322 ms (full details provided in Swanberg et al.8) was used to quantify glutathione (GSH) via linear combination modeling with INSPECTOR9 with basis functions simulated in MARSS. Acquisitions at each echo time exhibited distinctive shapes for GSH and co-edited NAA, validating the accuracy of the spin system simulation under a number of conditions. Data was acquired both from an aqueous phantom containing 5 mM each of GSH and NAA and in vivo in a healthy adult male volunteer. To demonstrate the feasibility of spin systems simulations, spectra were simulated with 83, 163, 323 and 643 spatial points for metabolites with a variable number of coupled spins, as it was shown in another submitted abstract that the number of spatial points can have a significant impact on the shape of a simulated spectrum.Results and Discussion
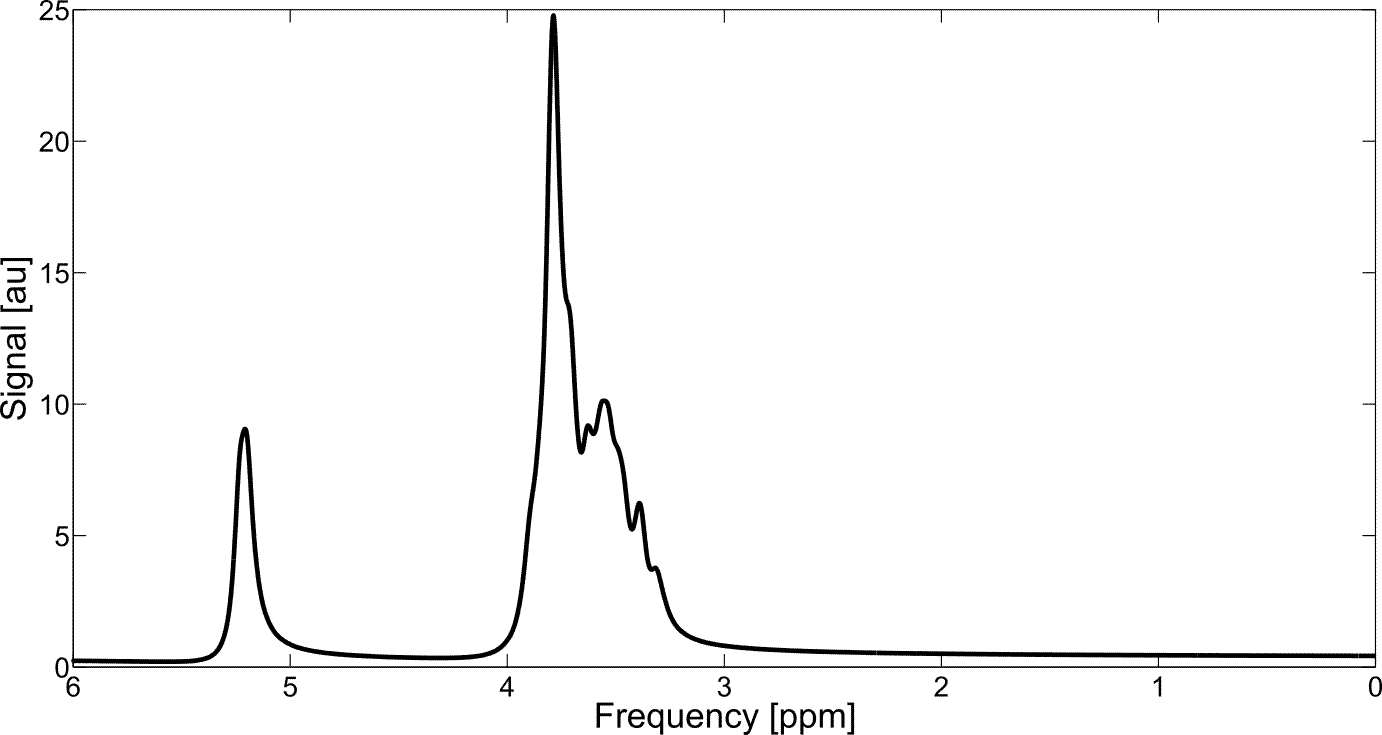
Even for 643 spatial points and a system with 7 coupled spins (α-glucose) the simulated spectrum for a Siemens PRESS experiment (Figure 1) can be performed within 91 minutes (Table 1), indicating that using this large number of spatial points with MARSS is feasible. The simulated spectral shapes from MARSS are in excellent agreement with phantom lineshapes (Figure 2), and, although some variations are observed in in vivo experiments (Figure 3), this could be due to J-coupling and chemical shift values deviating in vivo from their measurements in NMR tubes4 and furthermore is consistent with results from other software packages8.
Conclusion
MARSS, a novel software package that employs the density matrix formalism, was developed and demonstrated by validation both in phantom and in vivo to accurately simulate spin systems in a feasible amount of time.Acknowledgements
Special thanks to the New York State Psychiatric Institute (NYSPI) and Dr. Feng Liu for their facilities and technical support. This research was supported by the National Multiple Sclerosis Society (NMSS, RG-5319).References
- Provencher, S. Estimation of Metabolite Concentrations from Localized in Vivo Proton NMR spectra. Magn Reson Med 30, 672–679 (1993).
- Choi, C. et al. 2-hydroxyglutarate detection by magnetic resonance spectroscopy in IDH-mutated patients with gliomas. Nat Med 18, 624–629 (2012).
- Zhang, Y., An, L. & Shen, J. Fast computation of full density matrix of multispin systems for spatially localized in vivo magnetic resonance spectroscopy. Med. Phys. 44, 4169–4178 (2017).
- Govindaraju, V., Young, K. & Maudsley, A. A. Proton NMR chemical shifts and coupling constants for brain metabolites. NMR Biomed 13, 129–153 (2000).
- Near, J., Evans, C. J., Puts, N. A. J., Barker, P. B. & Edden, R. A. E. J-difference editing of GABA: simulated and experimental multiplet patterns. Magn Reson Med 70, 1–17 (2013)
- Malom H. Levitt. Spin Dynamics. (Wiley, 2008).
- Andreychenko, A., Boer, V. O., Arteaga de Castro, C. S., Luijten, P. R. & Klomp, D. W. J. Efficient Spectral Editing at 7 T: GABA Detection with MEGA-sLASER. Magn Reson Med 68, 1018–1025 (2012).
- Swanberg, K. M., Prinsen, H., Coman, D., Graaf, R. A. De & Juchem, C. Quantification of glutathione transverse relaxation time T2 using echo time extension with variable refocusing selectivity and symmetry in the human brain at 7 Tesla. J. Magn. Reson. 290, 1–11 (2018).
- Juchem, C. INSPECTOR - Magnetic Resonance Spectroscopy Software. Columbia Tech Ventures (CTV) License CU17130 (2016). Available from: innovation.columbia.edu/technologies/cu17130_inspector.
Figures