2285
High-grade and low-grade prostate cancer discrimination via blood plasma NMR based metabolomics1Department of NMR & MRI Facility, India Institute of Medical Sciences, New Delhi, India, NEW DELHI, India, 2Department of Urology, India Institute of Medical Sciences, New Delhi, India, New Delhi, India, 3Department of Radio-diagnosis, All India Institute of Medical Sciences, New Delhi, India, New Delhi, India, 4Department of Pathology, All India Institute of Medical Sciences, New Delhi, India, New Delhi, India
Synopsis
This study investigates the metabolic profile of blood plasma for distinguishing prostate cancer (PCa) patients with high Gleason score (GS≥7) and low Gleason score (GS<7) using 1H-NMR metabolomics. A significantly higher concentration of lactate, pyruvate, choline, dimethylamine, acetate and alanine were observed in the blood plasma of PCa patients with high Gleason score as compared to patients with low Gleason score. Our results suggested that the metabolic pathway alterations seen in amino acids, choline, glucose and ketone body may be related to changes in PCa progression.
Purpose: To investigate the potential 1H NMR metabolomics of blood plasma for distinguishing PCa patients with high and low grade Gleason scores (GS).
Introduction: PCa is the most frequently diagnosed malignancy in men over the age of 50 years. The prostate specific antigen (PSA) and/or the digital rectalexamination (DRE) followed by TRUS guided biopsy are used for the diagnosis of PCa. These techniques are not useful in distinguishing low grade from high grade PCa, because of their limited sensitivity and specificity. Thus the present study based on 1H-NMR, investigates the differences in the metabolic profiling of blood plasma of PCa patients with high grade GS and low grade GS.
Methods: Blood samples were collected from PCa patients with high grade (GS ≥7)[(n = 40 mean age: 66.6±7.5 years; PSA: 79.0 (5.56-541) ng/mL] and low grade (GS<7) [(n =30, mean age: 67.4 ± 8.0 years; PSA: 15.62 (4.11-61) ng/mL], in morning pre-prandial after overnight fasting. An informed consent was taken and the study was approved by Institute Ethics Committee. Each blood sample was centrifuged at 3000 rpm for 10 minutes at 4°C and plasma was separated and stored at -80°C until NMR experiments were carried out. Proton spectra of blood plasma samples were carried out at 700 MHz spectrometer (Agilent, USA) using 1D CPMG with presaturation. The following parameters were used for 1D NMR experiment: 64 scan with a 70 s relaxation delay and a spectral width of 9124.1 Hz with an echo time of 15 ms. Two dimensional (2D) TOCSY experiment was carried out for assignments of metabolite peaks. The metabolites levels were compared across low and high GS of blood plasma using unpaired Man Whitney U test. A p-value <0.05 was considered significant. Univariate (receiver operating characteristics (ROC) curve analysis) and multivariate (orthogonal partial least squares–discriminant analyses (OPLS-DA), variable importance to projection (VIP) score statistical analysis was carried out using MetaboAnalyst 4.0.
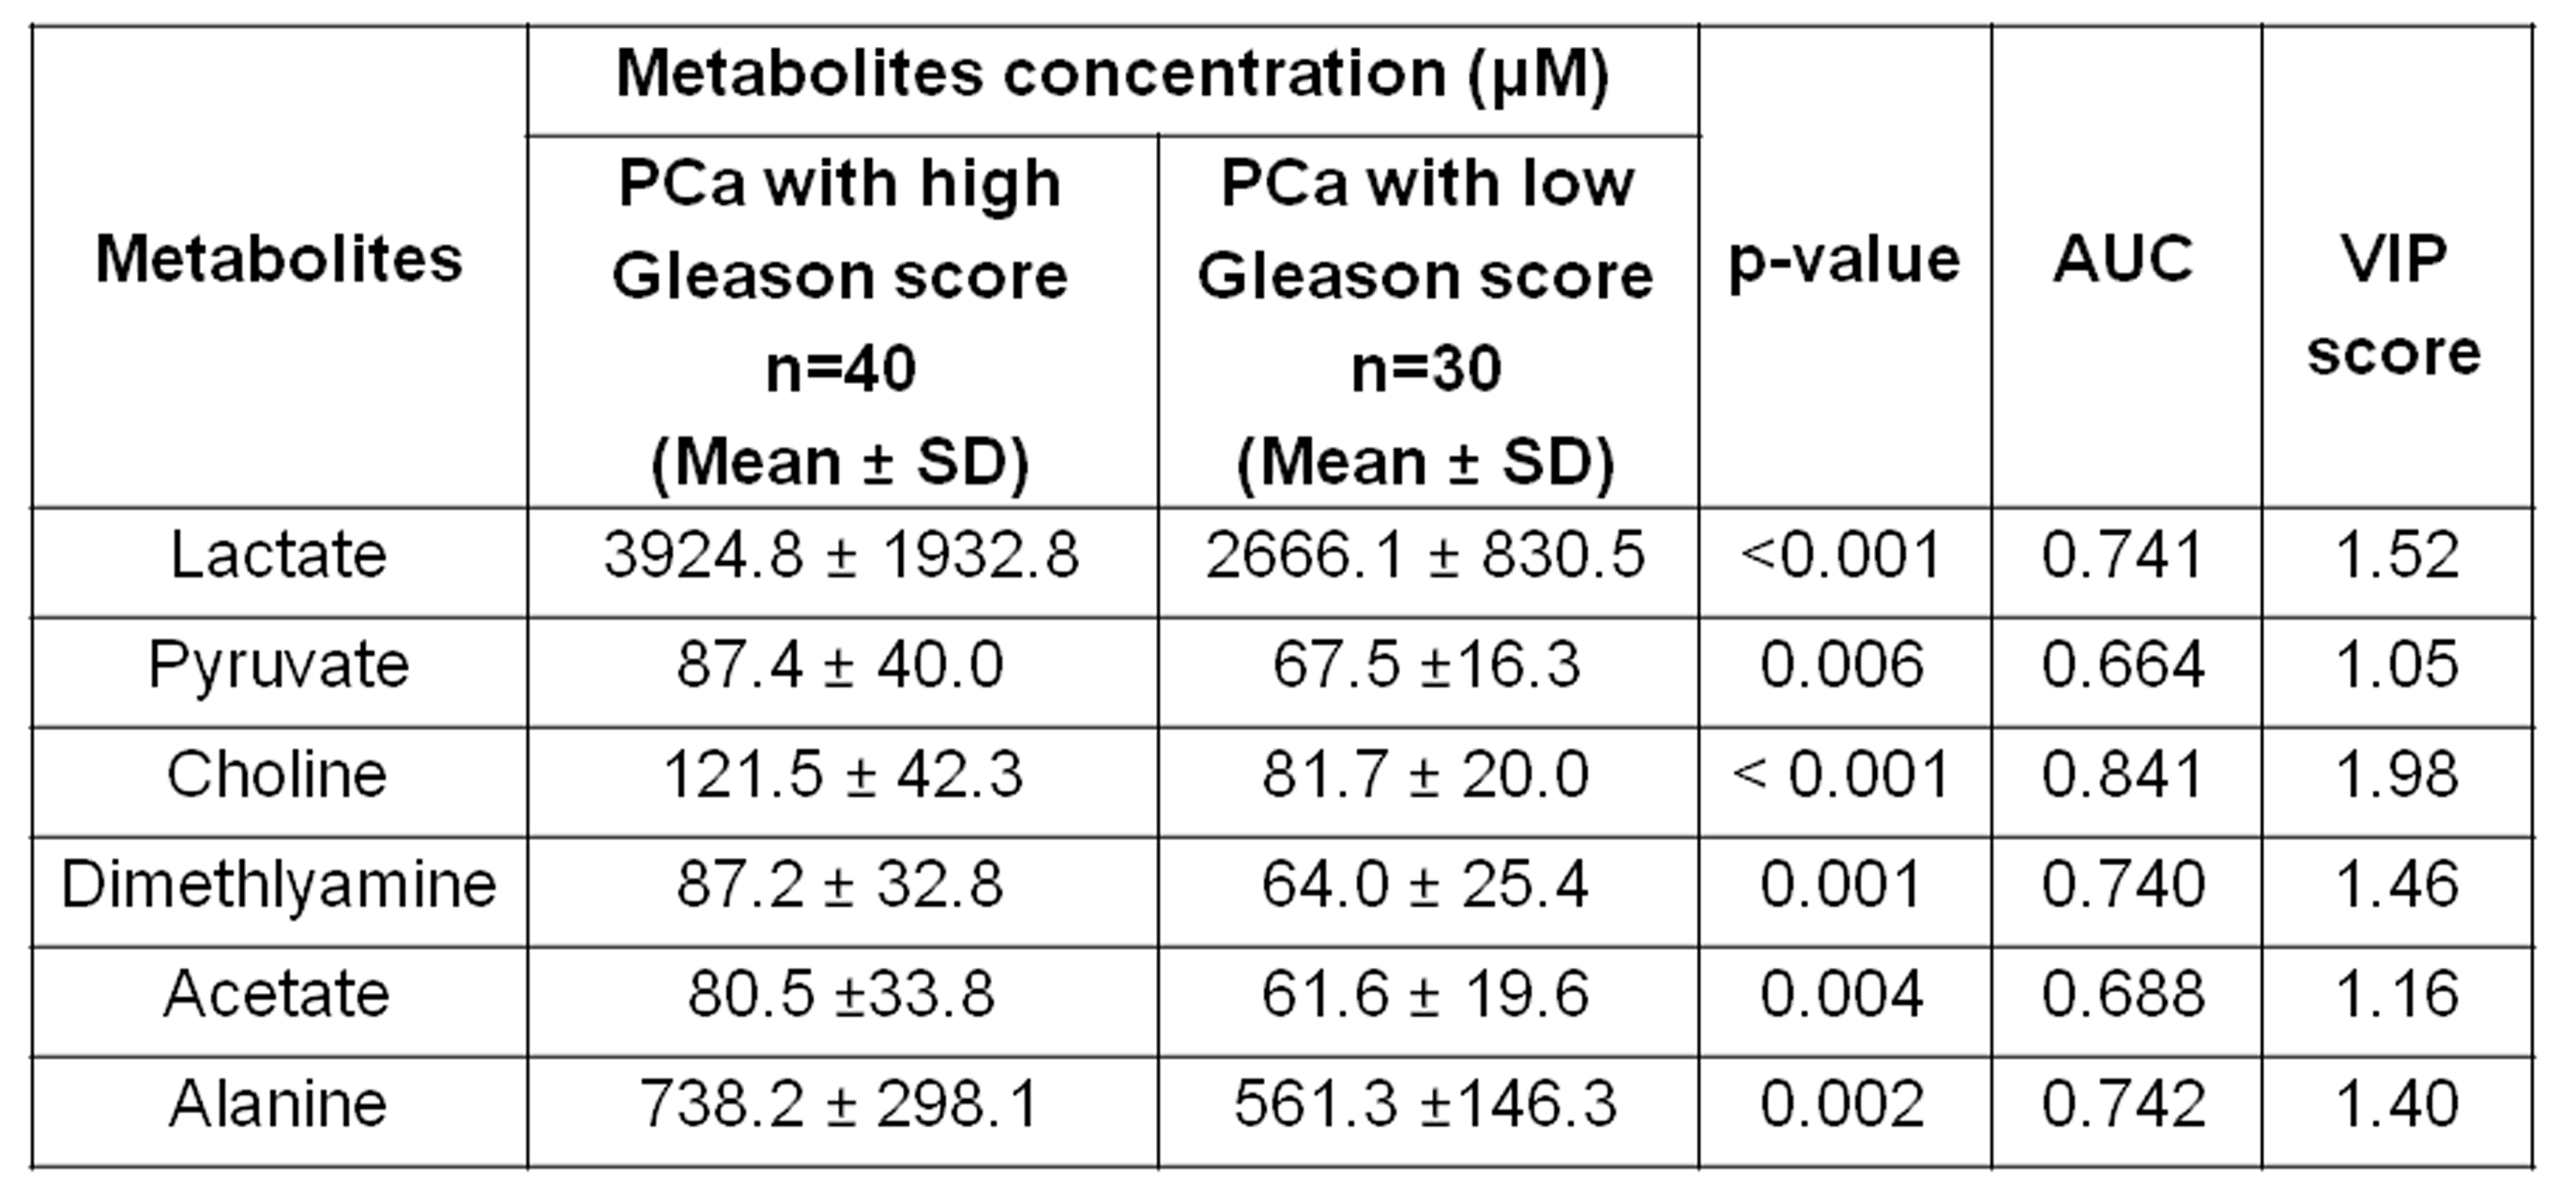
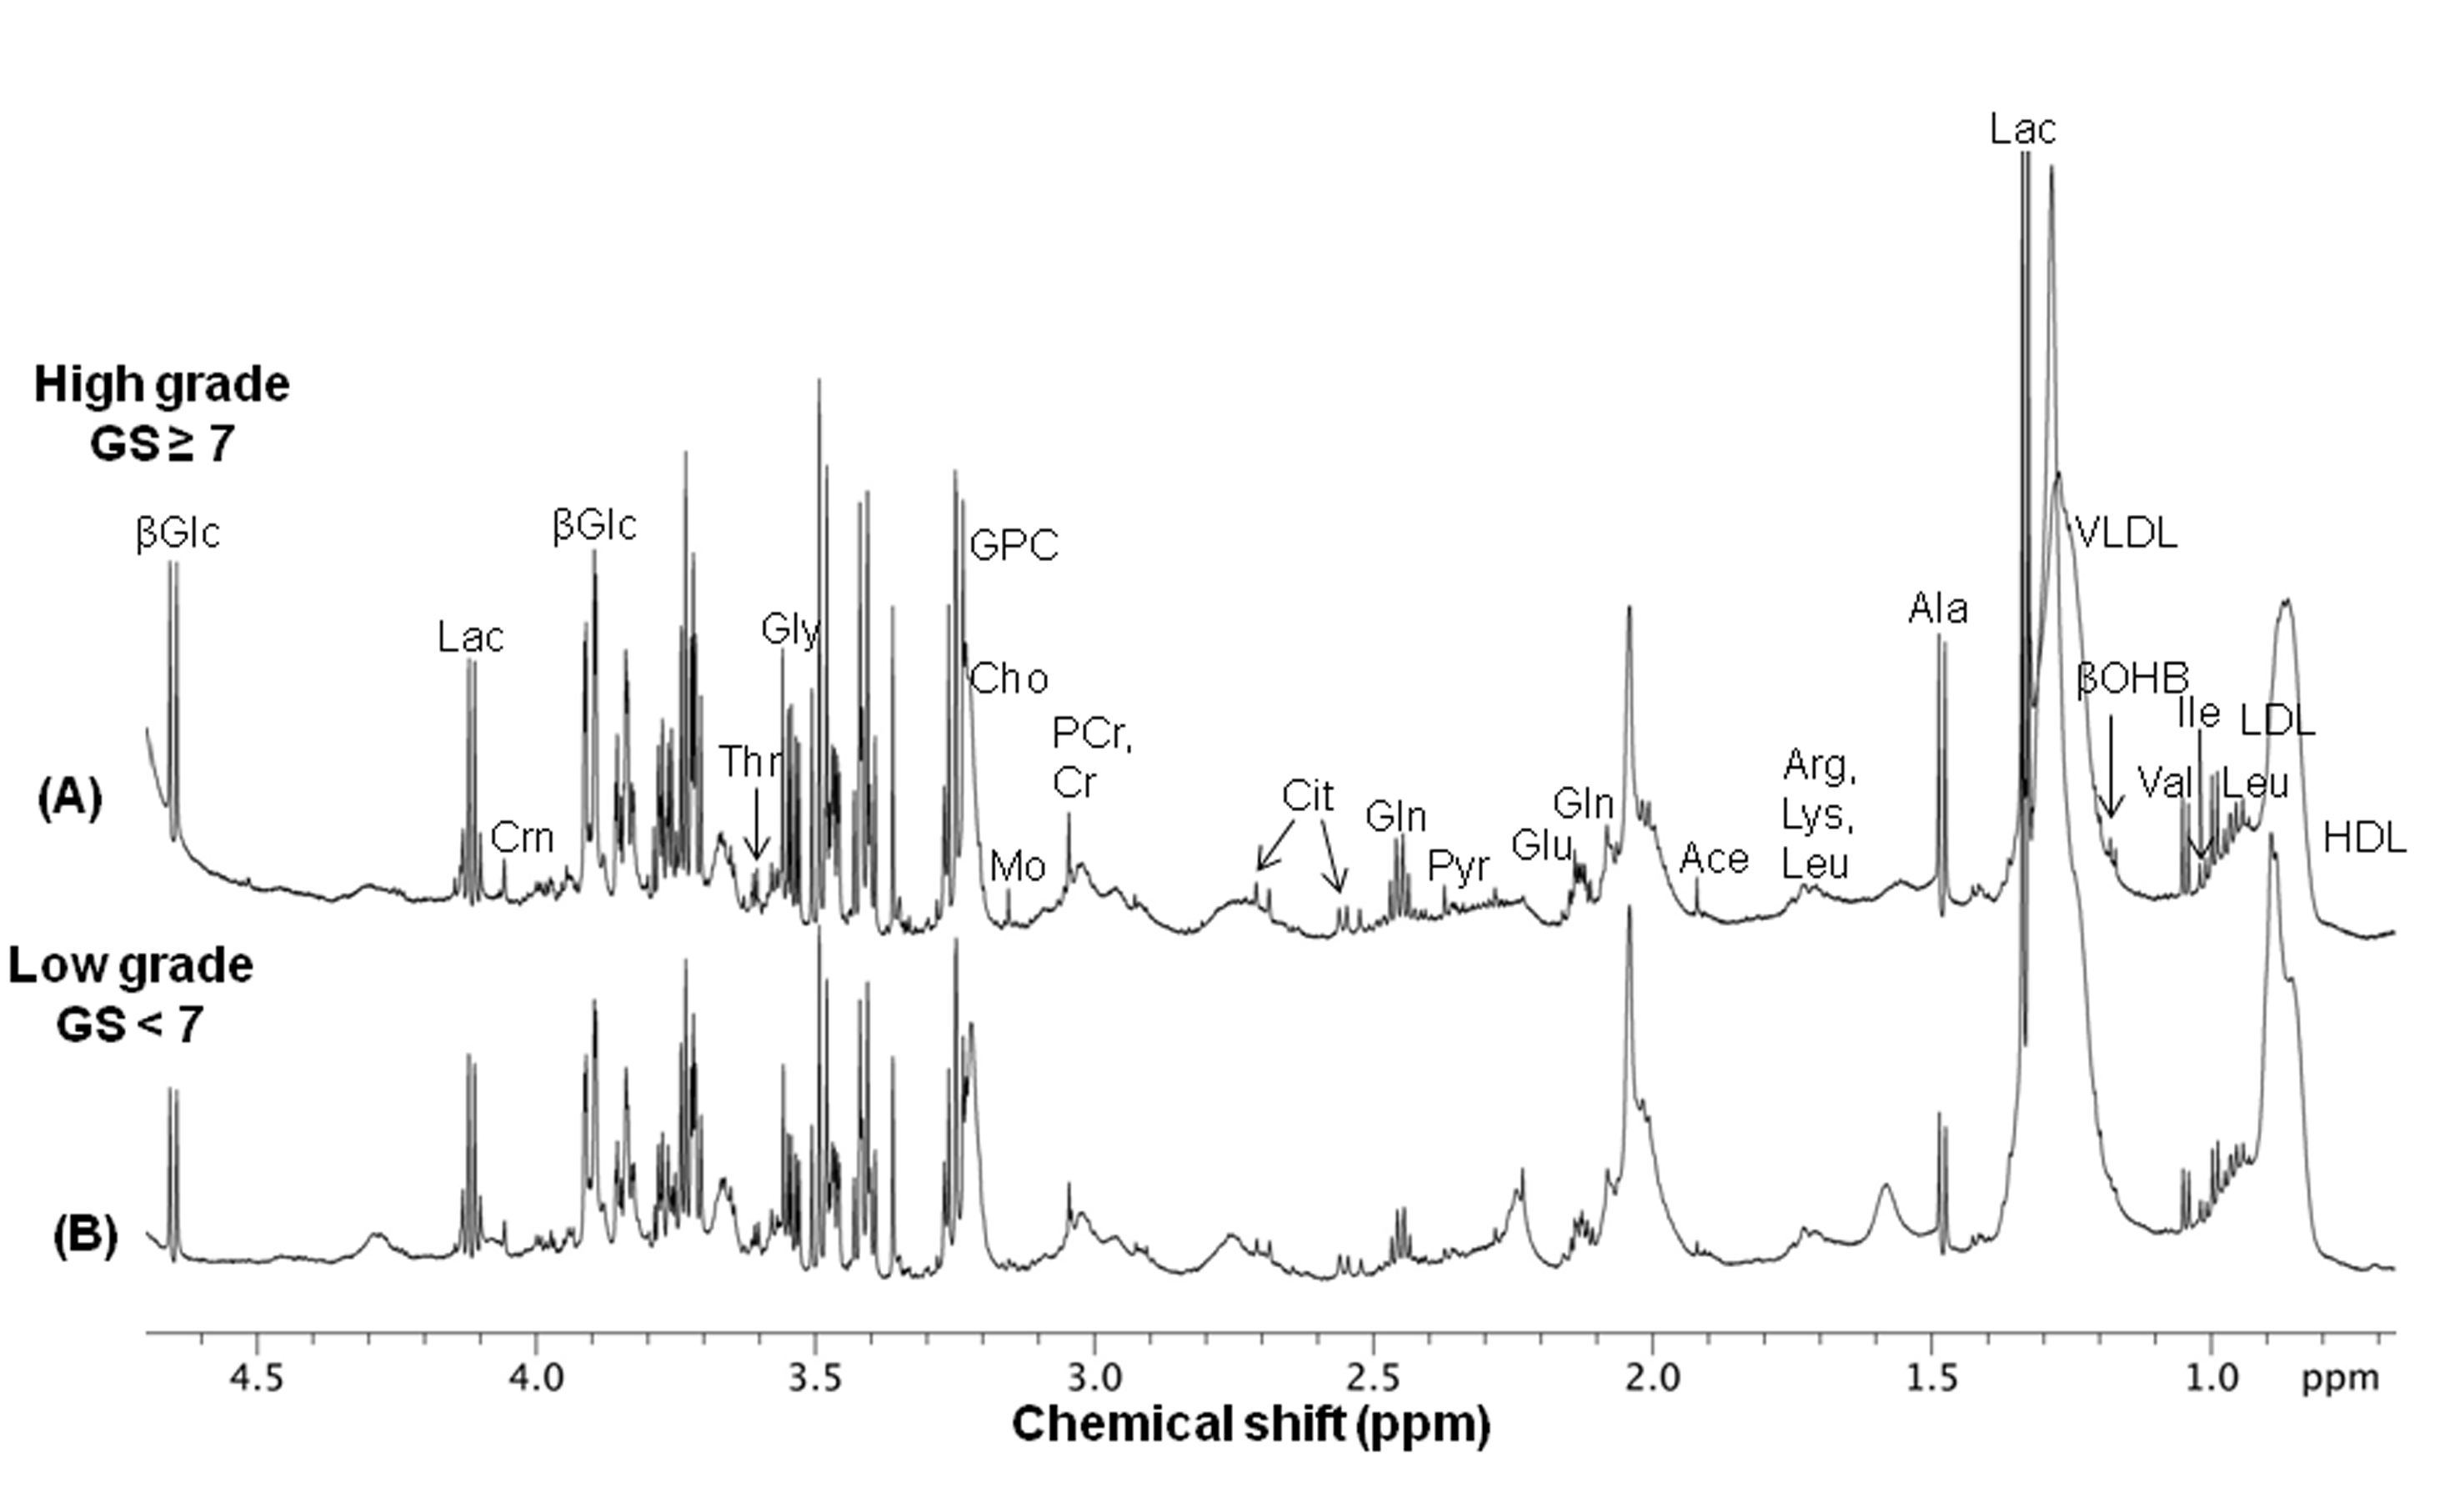
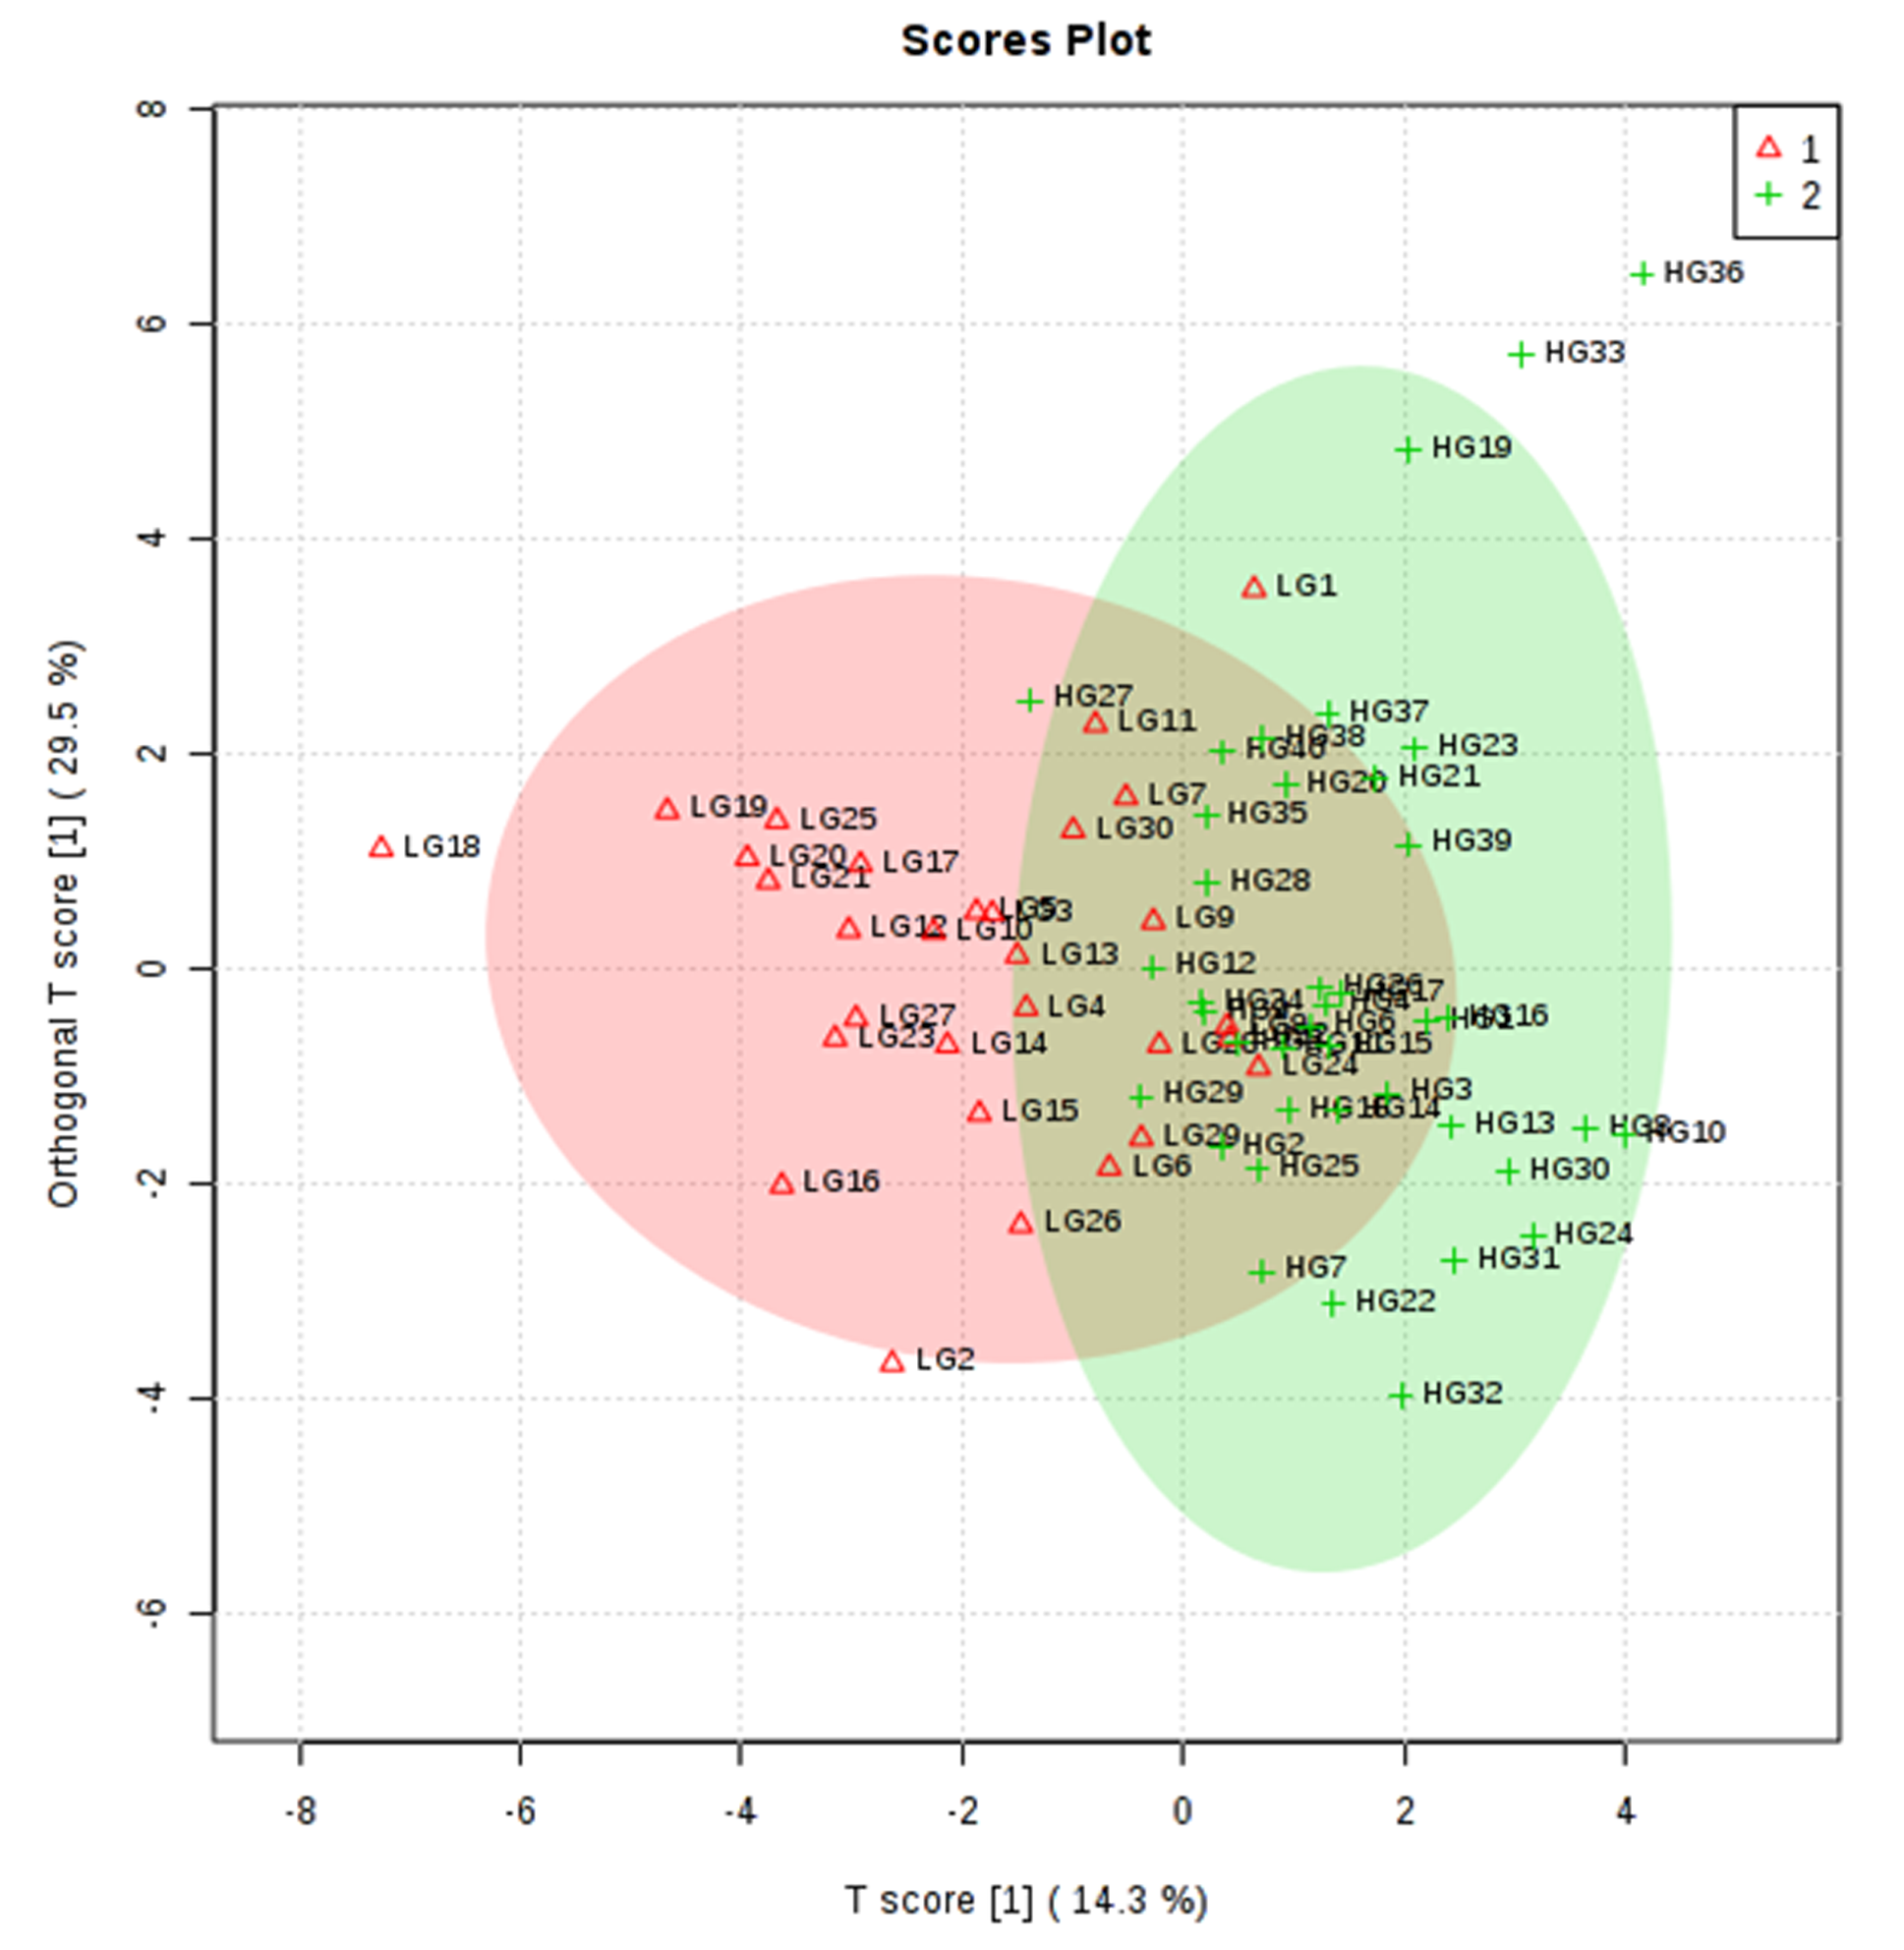
Results: Figure 1 shows the representative aliphatic region of 1D 1H NMR spectrum of blood plasma sample of a PCa patient with high GS (4+4) and low GS (6). In all, 29 metabolites were assigned using 1D and 2D NMR. For the concentration [μM (mean ± SD)] of 6 metabolites that showed significant (p<0.05) differences, the AUC values and VIP scores (>1) between PCa patients with high and low GS were determined and presented in Table 1. Figure 2 the OPLS -DA score plot showing the discrimination of PCa patients with high from grade low GS.
Discussion: The present study revealed significantly higher concentration of choline (Cho) in blood plasma of PCa patients with high GS as compared to low GS. Cho is associated with the breakdown of membrane phospholipids during malignant transformation of prostatic epithelial cells1. Higher concentration of dimethylamine (DMA) in blood plasma of PCa patients with high GS indicate alterations in membrane biosynthesis needed for proliferation of cancer cells2. Further elevated level of lactate (Lac), pyruvate (Pyr) and alanine (Ala) were observed in blood plasma of PCa patients with high GS as compared to patients with low GS3,4. Ala, Lac and Pyr are intermediates of glycolysis and TCA cycle, which suggested that the higher consumption of glucose by high grade cancers is in response to the stimulated aerobic glycolysis or due to Warburg effect with a conversion through Pyr to Ala and Lac. Higher concentrations of acetate (Ace) in blood plasma of PCa patients with high GS indicate utilization of lipids and ketone bodies as energy source5. The univariate ROC curve analyses indicated that in blood plasma, the metabolites such as Cho and Ala showed high AUC values (0.841 and 0.742, respectively) and had the highest diagnostic accuracy. The VIP values of Cho, DMA, Ala and Lac were increased during the progression of the PCa, which indicated that these metabolites may a play an important role in distinguishing between high GS grade from grade low GS PCa patients. Figure 2 shows an OPLS-DA classification score plot that presents the differentiation of PCa patients with high GS and low GS in separate quadrant.
Conclusion: The significant difference in the metabolites concentration of Cho, Ala and DMA may be used as a measure to discriminate between PCa patients with high GS and low grade GS. Also the metabolic profiling may offer the opportunity to understand the biochemical mechanism of tumorgenesis and help to identify potential biomarker/s of aggressive PCa.
Acknowledgements
NRJ acknowledges SERB, Government of India for the J.C. Bose Fellowship, while PK for UGC fellowship.References
(1). Glunde K, Bhujwalla ZM, Ronen SM. Nat Rev Cancer. 2011; 11:835-48. (2). Pérez RC, Puchades CL, García FM et al. Metabolomics. 2017;13:52. (3). Gatenby RA, Gillies RJ .Nat Rev Cancer. 2004;4:891-9. (4). Nagrath D, Caneba C, Karedath T et al. Biochim Biophys Acta. 2011; 1807:650-63. (5). Puchalska, P. & Crawford, P. A. Cell Metabolism. 2017; 25:262–284.Figures