2284
Metabolomics study of urine discriminates prostate cancer (PCa) patients from benign prostatic hyperplasia (BPH) by 1H NMR spectroscopy1Department of NMR & MRI Facility, India Institute of Medical Sciences, New Delhi, India, NEW DELHI, India, 2Department of Urology, India Institute of Medical Sciences, New Delhi, India, New Delhi, India, 3Department of Radio-diagnosis, All India Institute of Medical Sciences, New Delhi, India, New Delhi, India, 4Department of Pathology, All India Institute of Medical Sciences, New Delhi, India, New Delhi, India
Synopsis
The present study demonstrates the potential of proton nuclear magnetic resonance (1H-NMR) based metabolic profiling of urine for distinguishing prostate cancer patients (PCa; n=43) from patients with benign prostatic hyperplasia (BPH; n=30) and to determine non-invasive biomarker/s for diagnosis. A significantly lower concentration of leucine, valine, hippurate, dimethylglycine, glycerophosphocholine, glutamine, glycine, taurine and creatinine were observed in PCa patients as compared to BPH. Our result suggests metabolic alterations due to protein turnover, cell proliferation, energy demand and gut micro-biota metabolism in PCa patients.
Purpose: To investigate the metabolic profiling of urine to distinguish between prostate cancer patients (PCa) and benign prostatic hyperplasia (BPH) using proton (1H) nuclear magnetic resonance (NMR) spectroscopy.
Introduction: Prostate cancer is the most diagnosed cancer in men worldwide. The screening for PCa remains controversial because of low specificity of PSA which translates into many unnecessary biopsies and overtreatment of tumors with low malignant potential or benign. Thus the present study was designed to investigate the metabolic profile of urine to discriminate PCa patients from BPH patients using NMR spectroscopy and to determine potential biomarker/s of diagnosis.
Methods: Urine samples were collected from PCa patients [n =43 mean age: 67.4±8.0years, PSA: 30.28 (4.11-100) ng/mL] and BPH [n=30, mean age: 62.4± 9.8 years, PSA: 2.14 (0.3-3.76) ng/mL], in morning pre-prandial and immediately stored at -80°C until NMR experiments were performed. An informed consent was taken and the study was approved by institute ethics committee. Proton spectra were carried out at 700 MHz spectrometer (Agilent, USA). One dimensional with water pre-saturation was acquired at 25°C with following parameters: spectral width: 9124.1 Hz; scans: 256; with a relaxation delay: 14s. Two dimensional (2D) total correlation spectroscopy (TOCSY) experiment was carried out for assignments of resonances. The data was processed using the Vnmrj 2.3A software (Agilent technologies). For comparison between the two groups, unpaired Mann-Whitney U test was carried out using SPSS software. Comparative analysis of urine metabolic profiles were carried out using univariate (receiver operating characteristics (ROC) curve analysis) and multivariate (OPLS-DA, variable importance to projection (VIP score) statistical approaches using MetaboAnalyst 4.0.
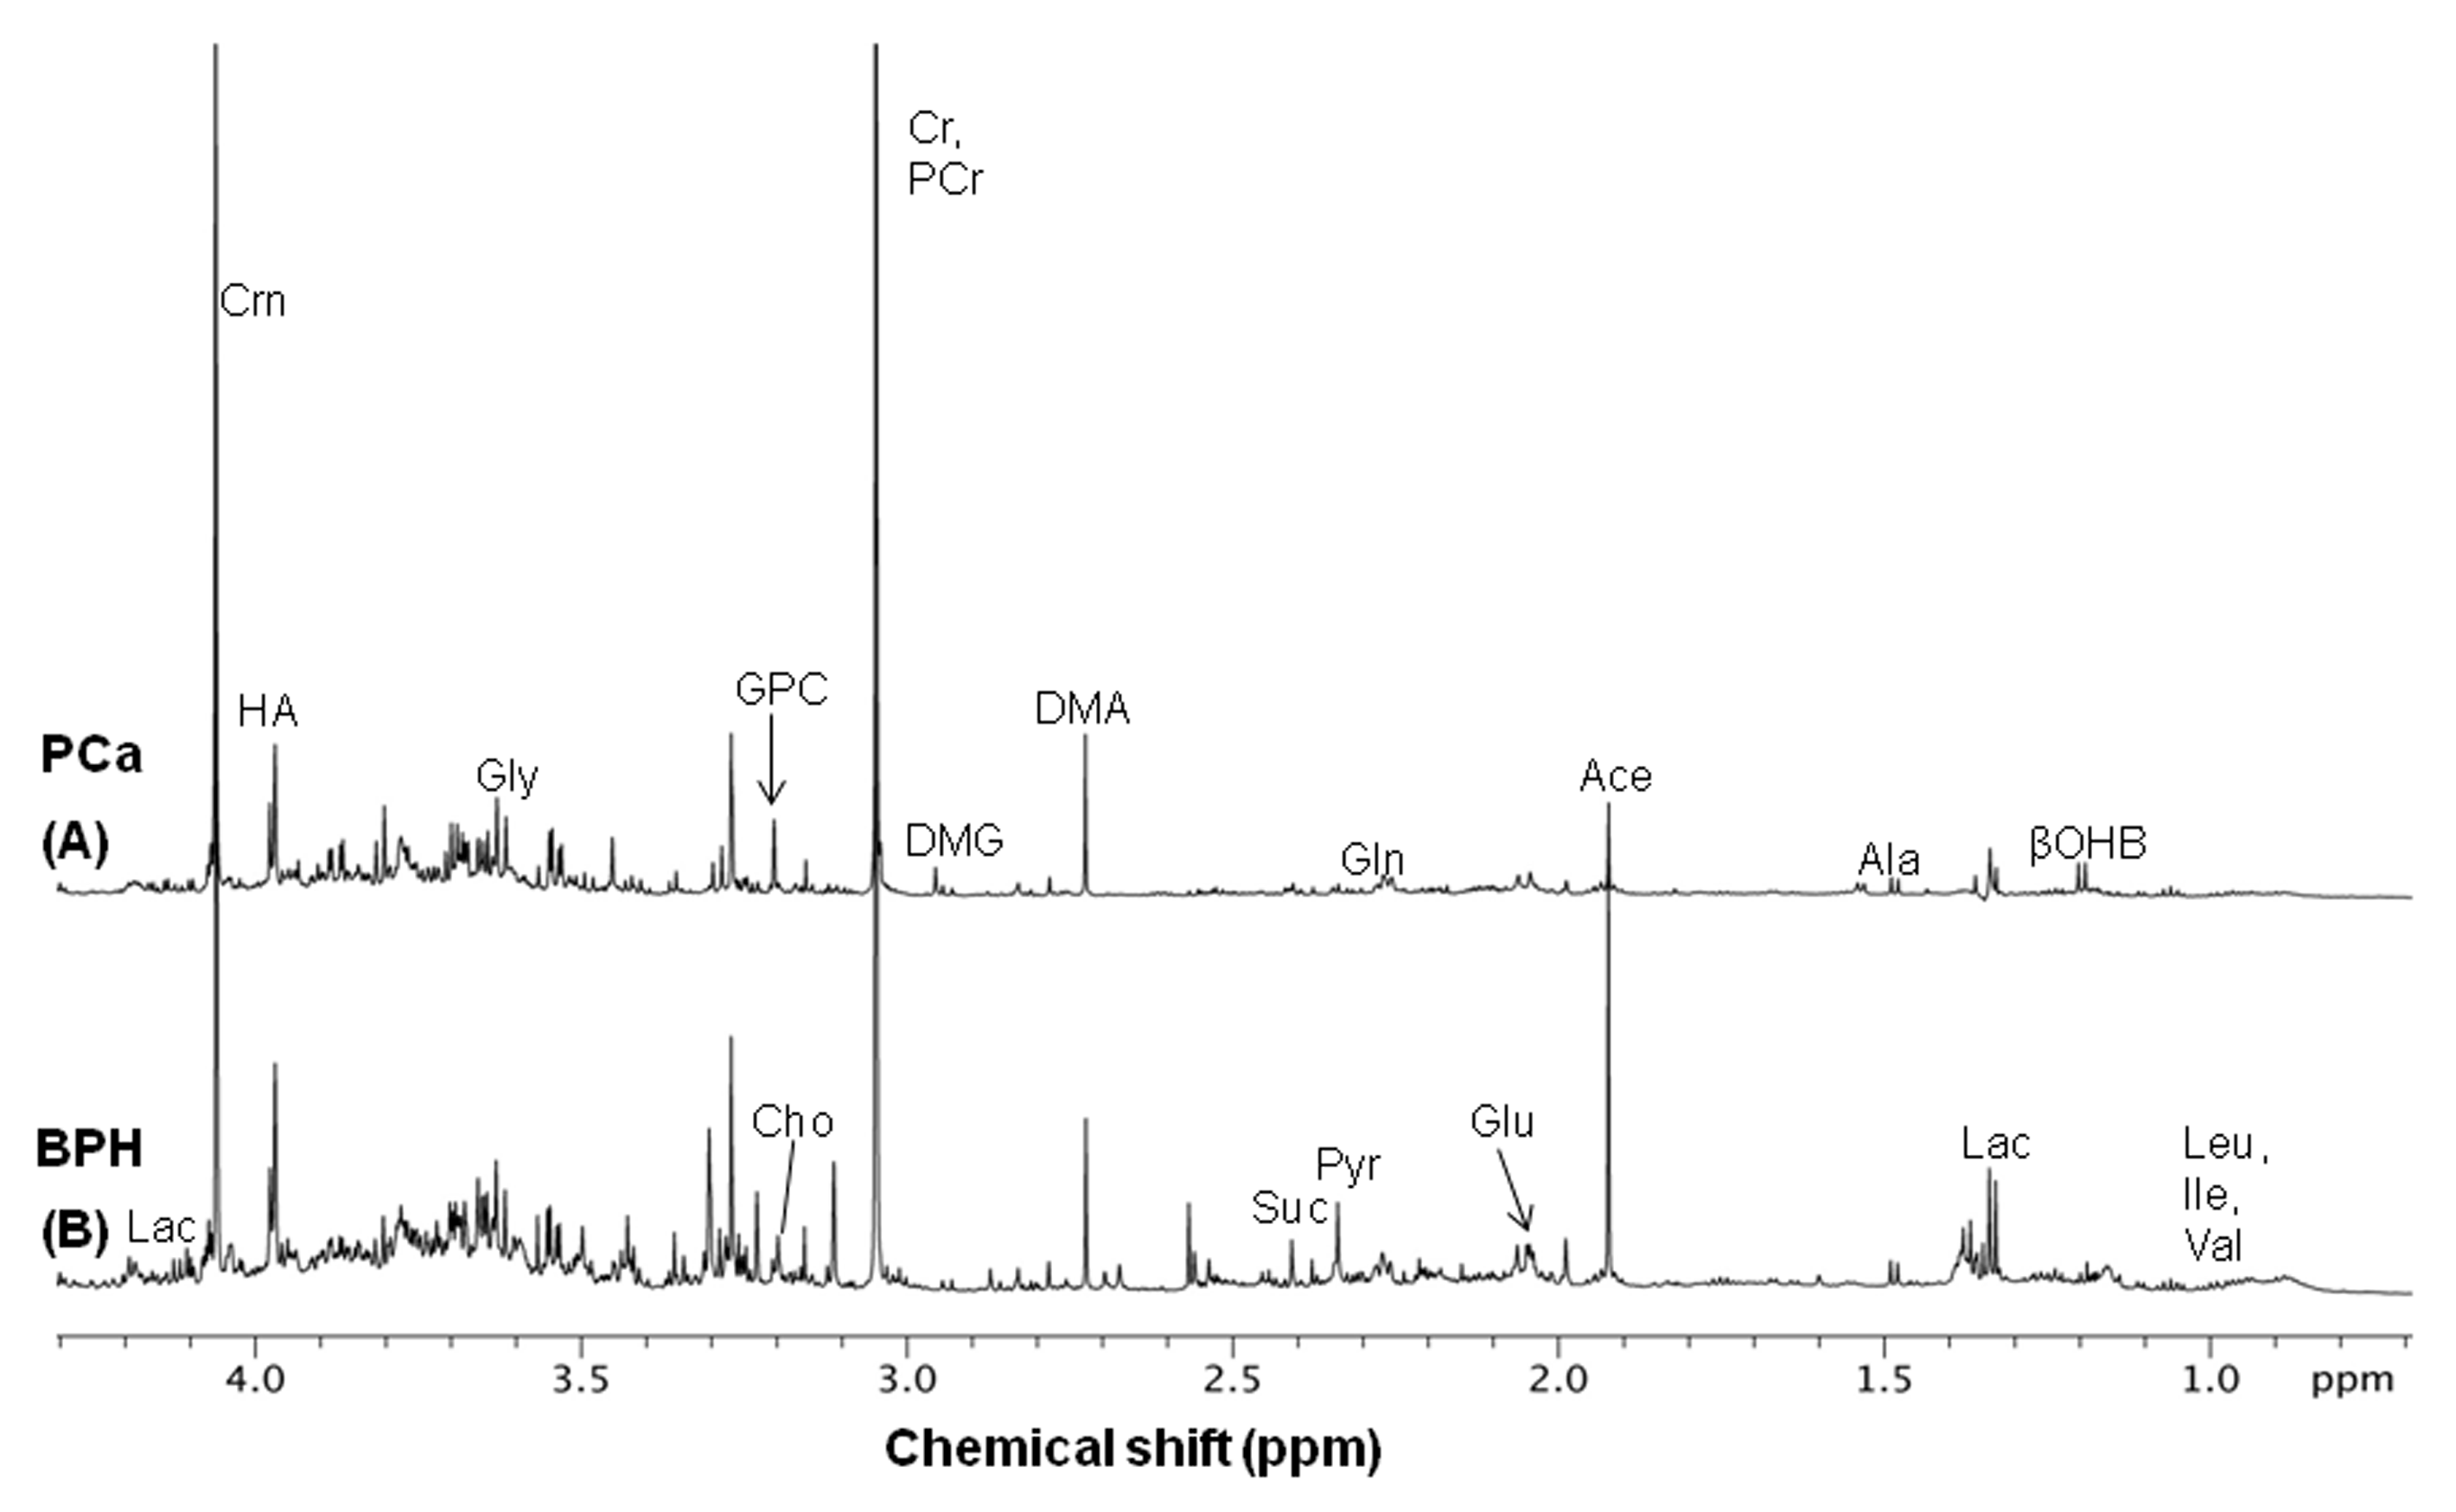
Results: Figure 1 shows the representative aliphatic region of 1D 1H-NMR spectrum of urine sample of a PCa patient (A) as compared to BPH (B). The concentration [μM (mean, range)] of 9 metabolites that showed significant (p< 0.05) differences, the AUC values and the VIP scores (>1) between PCa patients and BPH were calculated and presented in Table 1. Figure 2 shows the OPLS-DA score plot which discriminated between PCa patients and patients with BPH.
Discussion: A significantly lower concentration of branch chain amino acids such as isoleucine leucine (Leu) and valine (Val) was observed in urine of PCa patients as compared to BPH patients, indicating increased protein turnover in cancer cells1. Also, a significant decrease in the concentration of glycine (Gly) and dimethylglycine (DMG) in PCa patients was seen which may be due to cancer cell transformation and tumorgenesis2. Concentration of creatinine (Crn) was lower in patients, a waste product of muscle metabolism and therefore lower concentrations of urinary Crn may be associated with the energy demand3. Lower concentration of glycerophosphocholine (GPC) seen in urine of PCa patients compared to BPH. GPC is an important constituent in phospholipid metabolism for cell membranes. Thus, lower concentration GPC in urine of PCa patients may indicate a higher proliferation rate of cancer cells4. In addition, our data showed a lower concentration of hippurate indicating the association of this metabolite with the metabolomic of gut microfluora5. Glutamine (Gln) was a lower in PCa patients. Proliferating cancer cells uptake Gln and convert it to glutamate (Glu) by enzyme glutaminase. Glu is subsequently transformed into α-ketoglutarate through glutaminolysis that contribute to replenish depleted intermediates of the TCA cycle2. Taurine is an important metabolite in osmoregulation. Decreased levels of taurine in urine samples of PCa patients may be associated with a relatively higher proliferative activity and cell density of tumors6. The univariate ROC curve analyses indicated that in urine, the metabolites such as Lue, Val and GPC show high AUC values (0.841, 0.801and 0.789 respectively). Table 1 show the 9 urinary metabolites with high VIP score, which contributes to the progression of the PCa and further indicate that these metabolites may a play an important role in distinguishing between PCa patients and BPH patients. Figure 2 shows an OPLS-DA classification score plot that presents the differentiation of PCa patients from patients with BPH in separate quadrant.
Conclusion: The present study revealed that the analysis of urinary its NMR metabolomics provides a non-invasive tool for characterizing PCa associated biomarker/s and also provide a better understanding of the pathophysiological process involved in the progression of PCa comparison to BPH.
Acknowledgements
NRJ acknowledges SERB, Government of India for the J.C. Bose Fellowship, while PK for UGC fellowship.References
(1). Dereziński P, Klupczynska A, Sawicki W et al. Int J Med Sci. 2017;14:1-122). (2). Pérez-Rambla C, Puchades-Carrasco L, García-Flores M et al. Metabolomics. 2017; 13:52. (3). Eisner R, Stretch C, Eastman T et al. Metabolomics. 2011; 7: 25–34. (4). Glunde K, Bhujwalla ZM, Ronen SM. Nat Rev Cancer. 2011; 11:835-48. (5). Struck-Lewicka W, Kordalewska M, Bujak R et al. J Pharm Biomed Anal. 2015;111:351-61. (6). Chatzakos V, Slätis K, Djureinovic T, Helleday T et. al. Lipids. 2012; 47:355-61.Figures