2283
Metabolic profiling discriminates between BRAFi sensitive and BRAFi resistant melanoma cellsStefania Acciardo1, Lionel Mignion1, Florian Gourgue1, Céline Schoonjans1, Nicolas Joudiou2, Bernard Gallez1, and Bénédicte F Jordan1
1Biomedical Magnetic Resonance Research Group, Université catholique de Louvain, Louvain Drug Research Institute, Brussels, Belgium, 2NEST Nuclear and Electron Spin Technologies Platform, Université catholique de Louvain, Louvain Drug Research Institute, Brussels, Belgium
Synopsis
The aim of this work is to identify a marker of response or resistance to BRAF inhibition in melanoma. BRAF inhibition resulted in a decrease of 13C label exchange between hyperpolarized [1-13C]pyruvate and lactate in sensitive, but not in resistant, melanoma cells. Such effect is likely to be mediated by a reduction of the lactate pool due to (i) decreased flux through glycolysis, (ii) reduced MCT1-mediated lactate uptake and (iii) increased lactate efflux via MCT4. The lactate/pyruvate ratio may help to discriminate between sensitive and resistant melanoma cells, by reflecting the different metabolic alterations that the cells undergo.
Introduction
Nearly all melanoma patients with a BRAF-activating mutation after an initial clinical benefit from BRAF inhibition (BRAFi) will develop resistance, which is suggested to be accompanied by precise metabolic changes. The aim of this work is to identify the metabolic changes associated with the onset of BRAFi resistance and to identify metabolic markers allowing to discriminate between responding and resistant melanomas, right after treatment initiation.Methods
Sensitive (A375) and resistant (A375/R) melanoma cells were treated for 24h with 2µM of the BRAFi vemurafenib or DMSO. The resistant cell line was generated via exposure to increasing concentration of the drug1. For hyperpolarization experiments, 13C spectra were acquired every 3s for 210 seconds, starting right after the addition of hyperpolarized (HP) [1-13C]pyruvate into cells (25x106/sample). 13C label exchange between HP pyruvate and lactate was measured as the ratio between the corresponding areas under the curve (AUC), via a homebuilt Matlab routine (The MathWorks Inc., USA). For 13C-glucose flux experiments, cells were incubated in DMEM containing 2mM glutamine and 10mM [U‑13C]glucose, 13C spectra of the aqueous fraction of cell extracts and cell growth medium were processed using MestRenova (Mestrelab Research SL, Spain). The effects of BRAFi on GLUT1, HKII, MCT1, MCT4, LDHA and MPC1 were determined by quantitative real-time PCR in mRNA extracted from A375 and A375/R cells.Results
BRAF inhibition resulted in a decrease of 13C label exchange between HP pyruvate and lactate in A375, but not in A375/R cells (Fig.1A). 13C signal arising from alanine was observed in all but one sample. The label distribution between alanine and lactate was also significantly modified by BRAFi in A375, but not in A375/R cells (Fig.1B). 13C NMR studies of cells incubated with [U‑13C]glucose were in line with the hyperpolarization studies: we observed a trend, even though not significant, towards a decrease in the intracellular lactate/glucose ratio, accompanied by an augmentation in the intracellular alanine/lactate ratio in BRAFi-treated A375 cells (Fig.1C-D). Following incubation with [U-13C]glucose, we observed substantial 13C enrichment in lactate, alanine and glutamate and minor enrichment in glutamine (Fig.2). 13C signal arising from bicarbonate, glycine and serine was also occasionally observed.Discussion
The HP lactate/pyruvate ratio was significantly reduced by BRAFi in A375, but not in A375/R, cells. Such effect is likely to be mediated by a depletion of the endogenous lactate pool as a consequence of decreased flux through glycolysis, reduced MCT1-mediated lactate uptake and increased lactate efflux via MCT4, as evidenced by the changes in mRNA levels of GLUT1, HKII, MCT1 and MCT4. Interestingly, GLUT1, LDH, MCT1 and MCT4 levels were affected by BRAFi even in A375/R cells; however, the lactate/pyruvate ratio remained unchanged. This was probably due to the fact that mRNA levels were altered to a lesser extent in A375/R cells, compared to A375 (such as in the case of MCT4 and LDHA), or because the reduction in mRNA levels was counteracted by a higher baseline level (GLUT1). It has recently been suggested that the alanine/lactate ratio may be preferred over the lactate/pyruvate ratio since several factors affect the absolute signal arising from HP pyruvate2. In our hyperpolarization experiments, the alanine/lactate ratio was significantly altered by BRAFi in A375 cells, but not in the resistant counterpart.Conclusion
BRAFi affects glycolysis at several points, such changes globally converge towards a decrease in the 13C label exchange between HP pyruvate and lactate in sensitive, but not in resistant, melanoma cells.Acknowledgements
This work was supported by grants from the Télévie-FNRS (Fonds national de la Recherche Scientifique)References
- Acciardo S, Mignion L, Joudiou N, Bouzin C, Baurain J-F, Gallez B, Jordan BF. Imaging markers of response to combined BRAF and MEK inhibition in BRAF mutated vemurafenib-sensitive and resistant melanomas. Oncotarget. 2018; 9: 16832-46.
- Serrao EM, Kettunen MI, Rodrigues TB, Dzien P, Wright AJ, Gopinathan A, Gallagher FA, Lewis DY, Frese KK, Almeida J, Howat WJ, Tuveson DA, Brindle KM. MRI with hyperpolarised [1-13C]pyruvate detects advanced pancreatic preneoplasia prior to invasive disease in a mouse model. Gut. 2016; 65: 465-75.
Figures
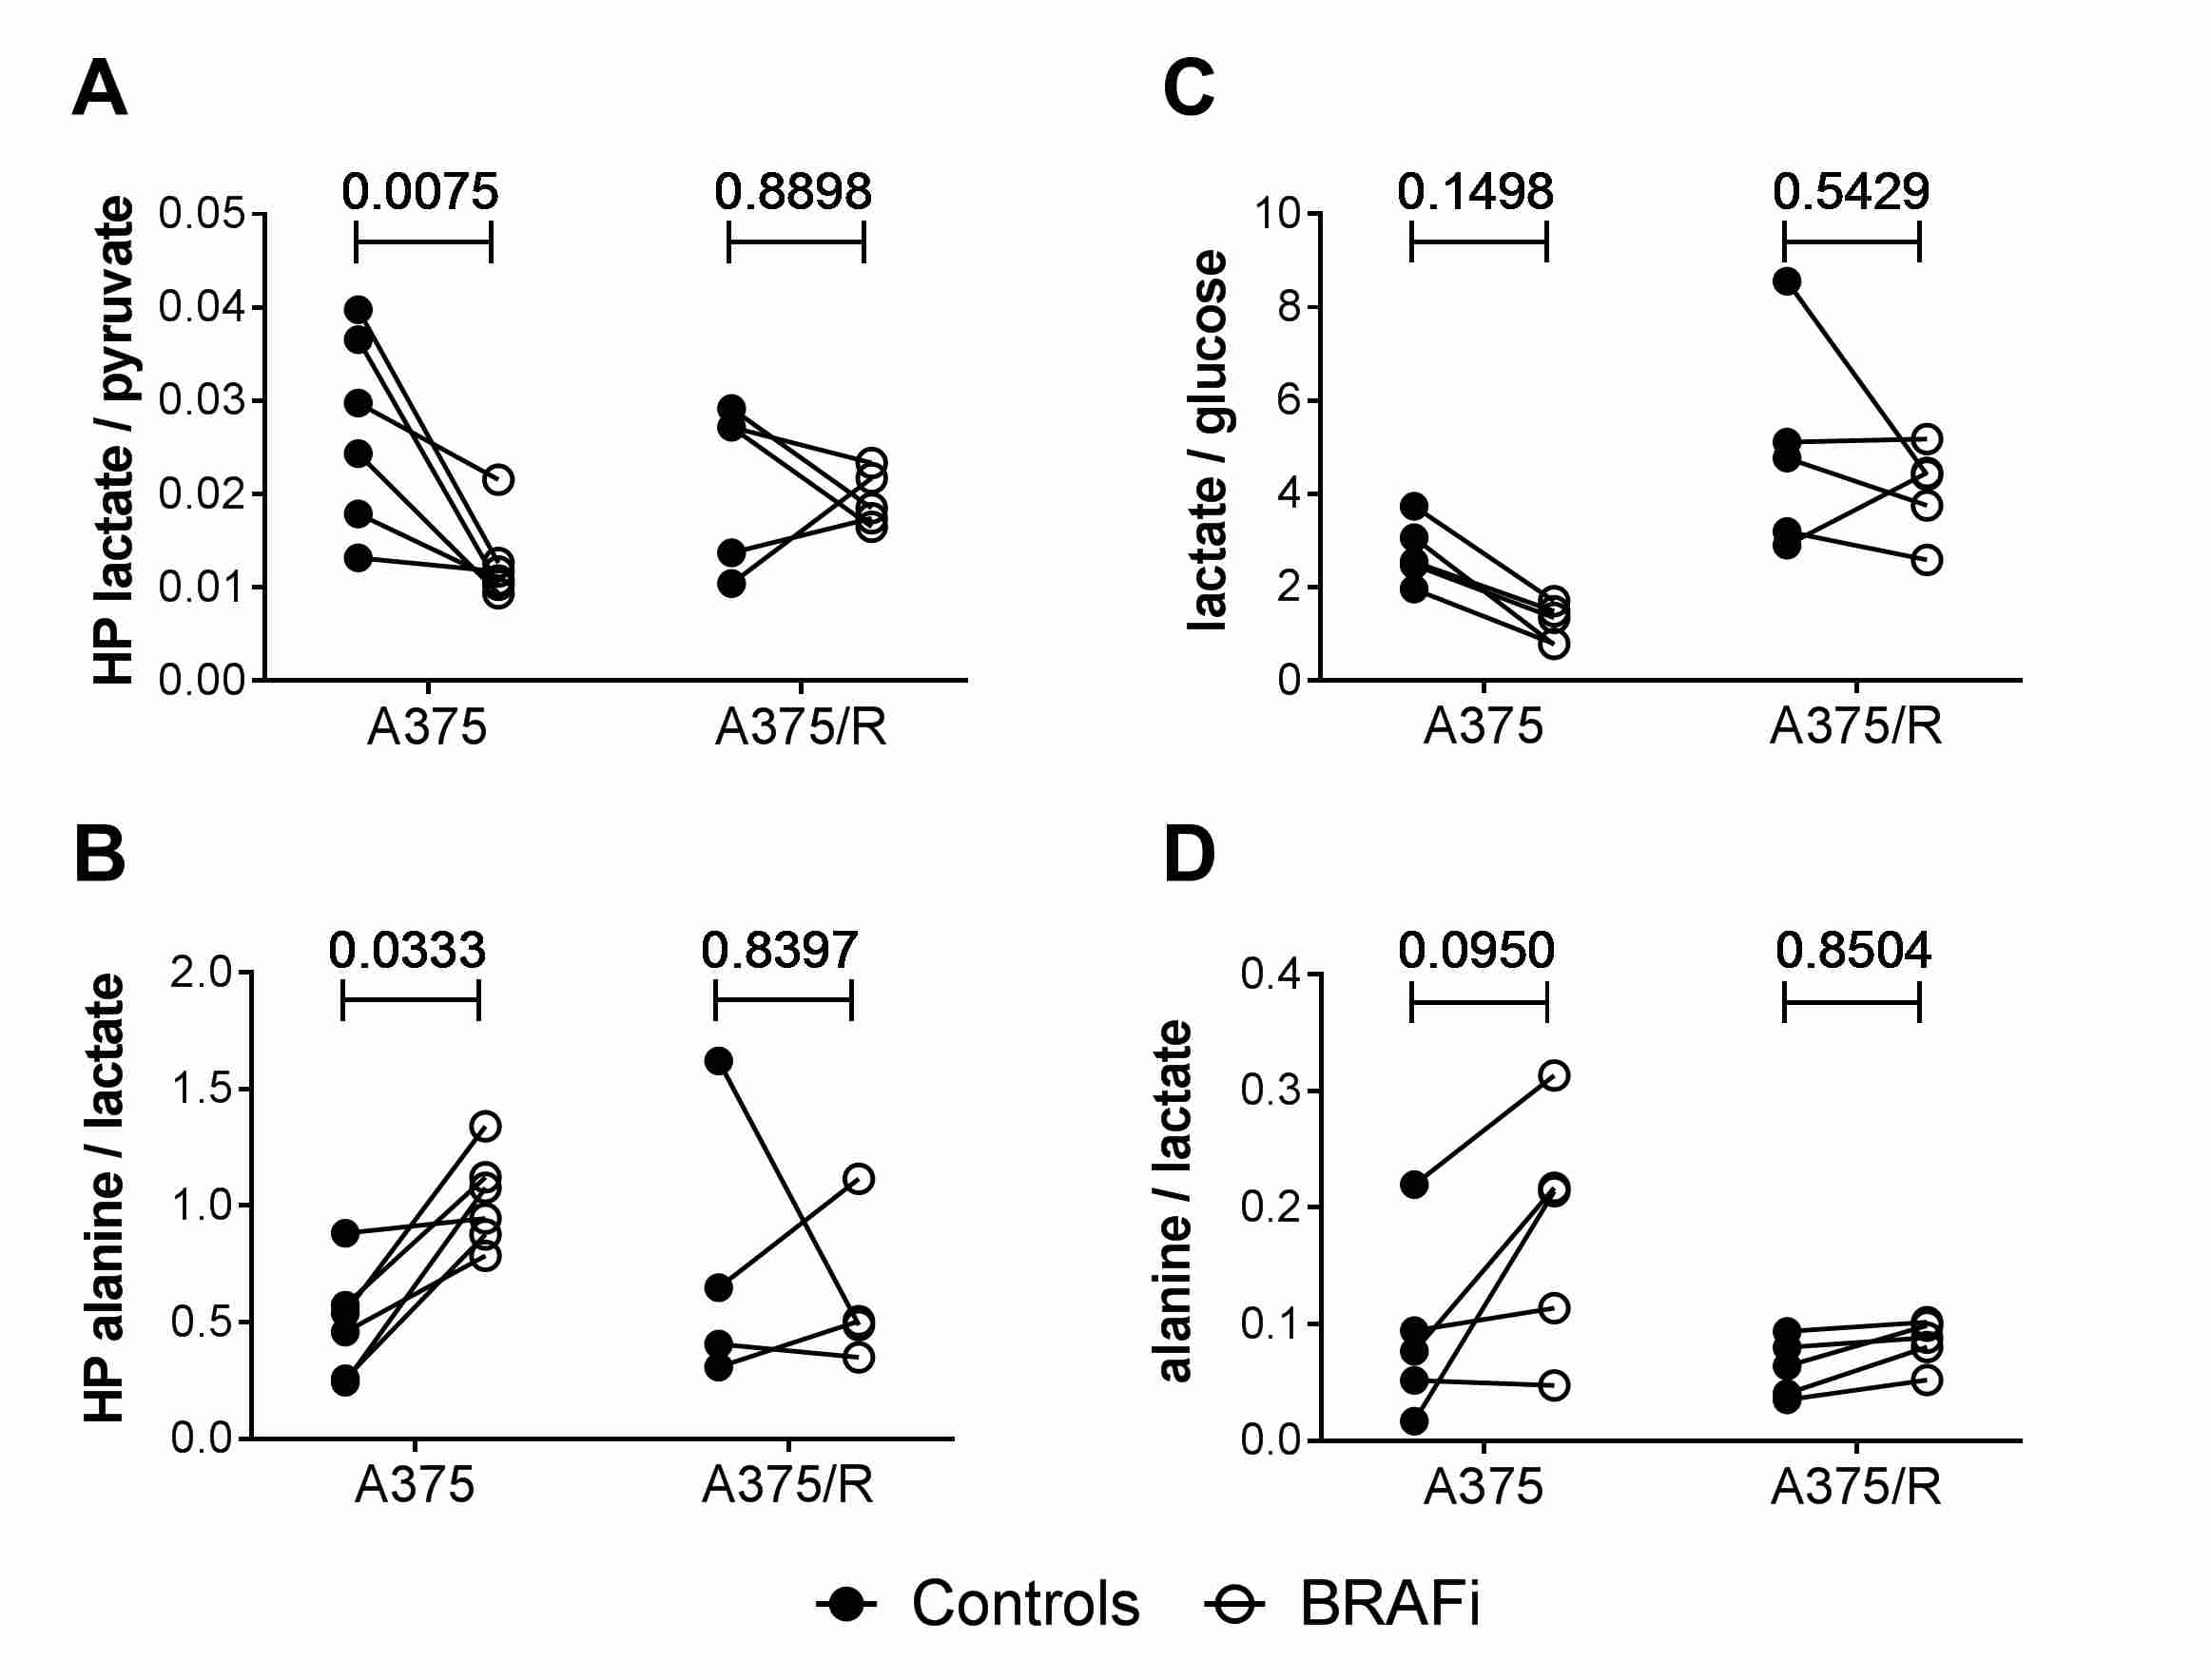
Figure 1. A) 13C label exchange
between HP pyruvate and lactate (AUC of [1-13C]lactate/AUC of [1-13C]pyruvate) measured in sensitive and resistant
melanoma cells treated for 24h with 2µM vemurafenib or DMSO. B) Ratio between AUC
of [1‑13C]alanine and AUC of [1‑13C]lactate in the same samples (n=6 and n=5 or 4 for A375 and A375/R, respectively, two-way analysis of variance ANOVA, followed by Sidak’s
test for multiple comparisons). C-D) Changes in the relative pools of intracellular metabolites that
are enriched by the [U-13C]glucose label (n=5, two-way analysis of variance ANOVA, followed by
Sidak’s test for multiple comparisons; ongoing experiments)
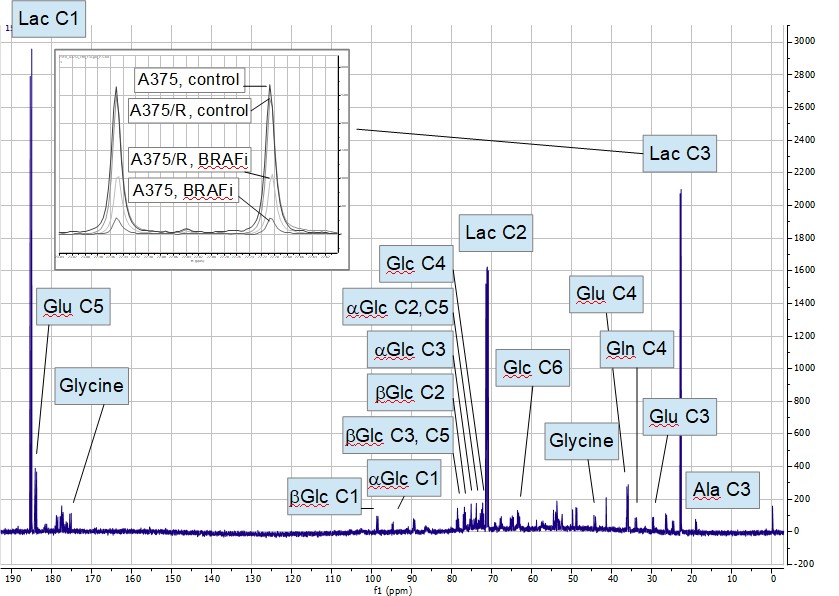
Figure 2. Typical 13C NMR spectra from A375 cell
extracts. Ala=
alanine, Glc= glucose, Gln= glutamine, Glu= glutamate, Lac= lactate. Inset: expansion of the lactate
signal from the C3 position, showing a decrease in the lactate signal in
treated cells. The lactate signal includes a singlet from the
carbon in the C3 position and a doublet from coupling between the carbons in C2
and C3 positions.
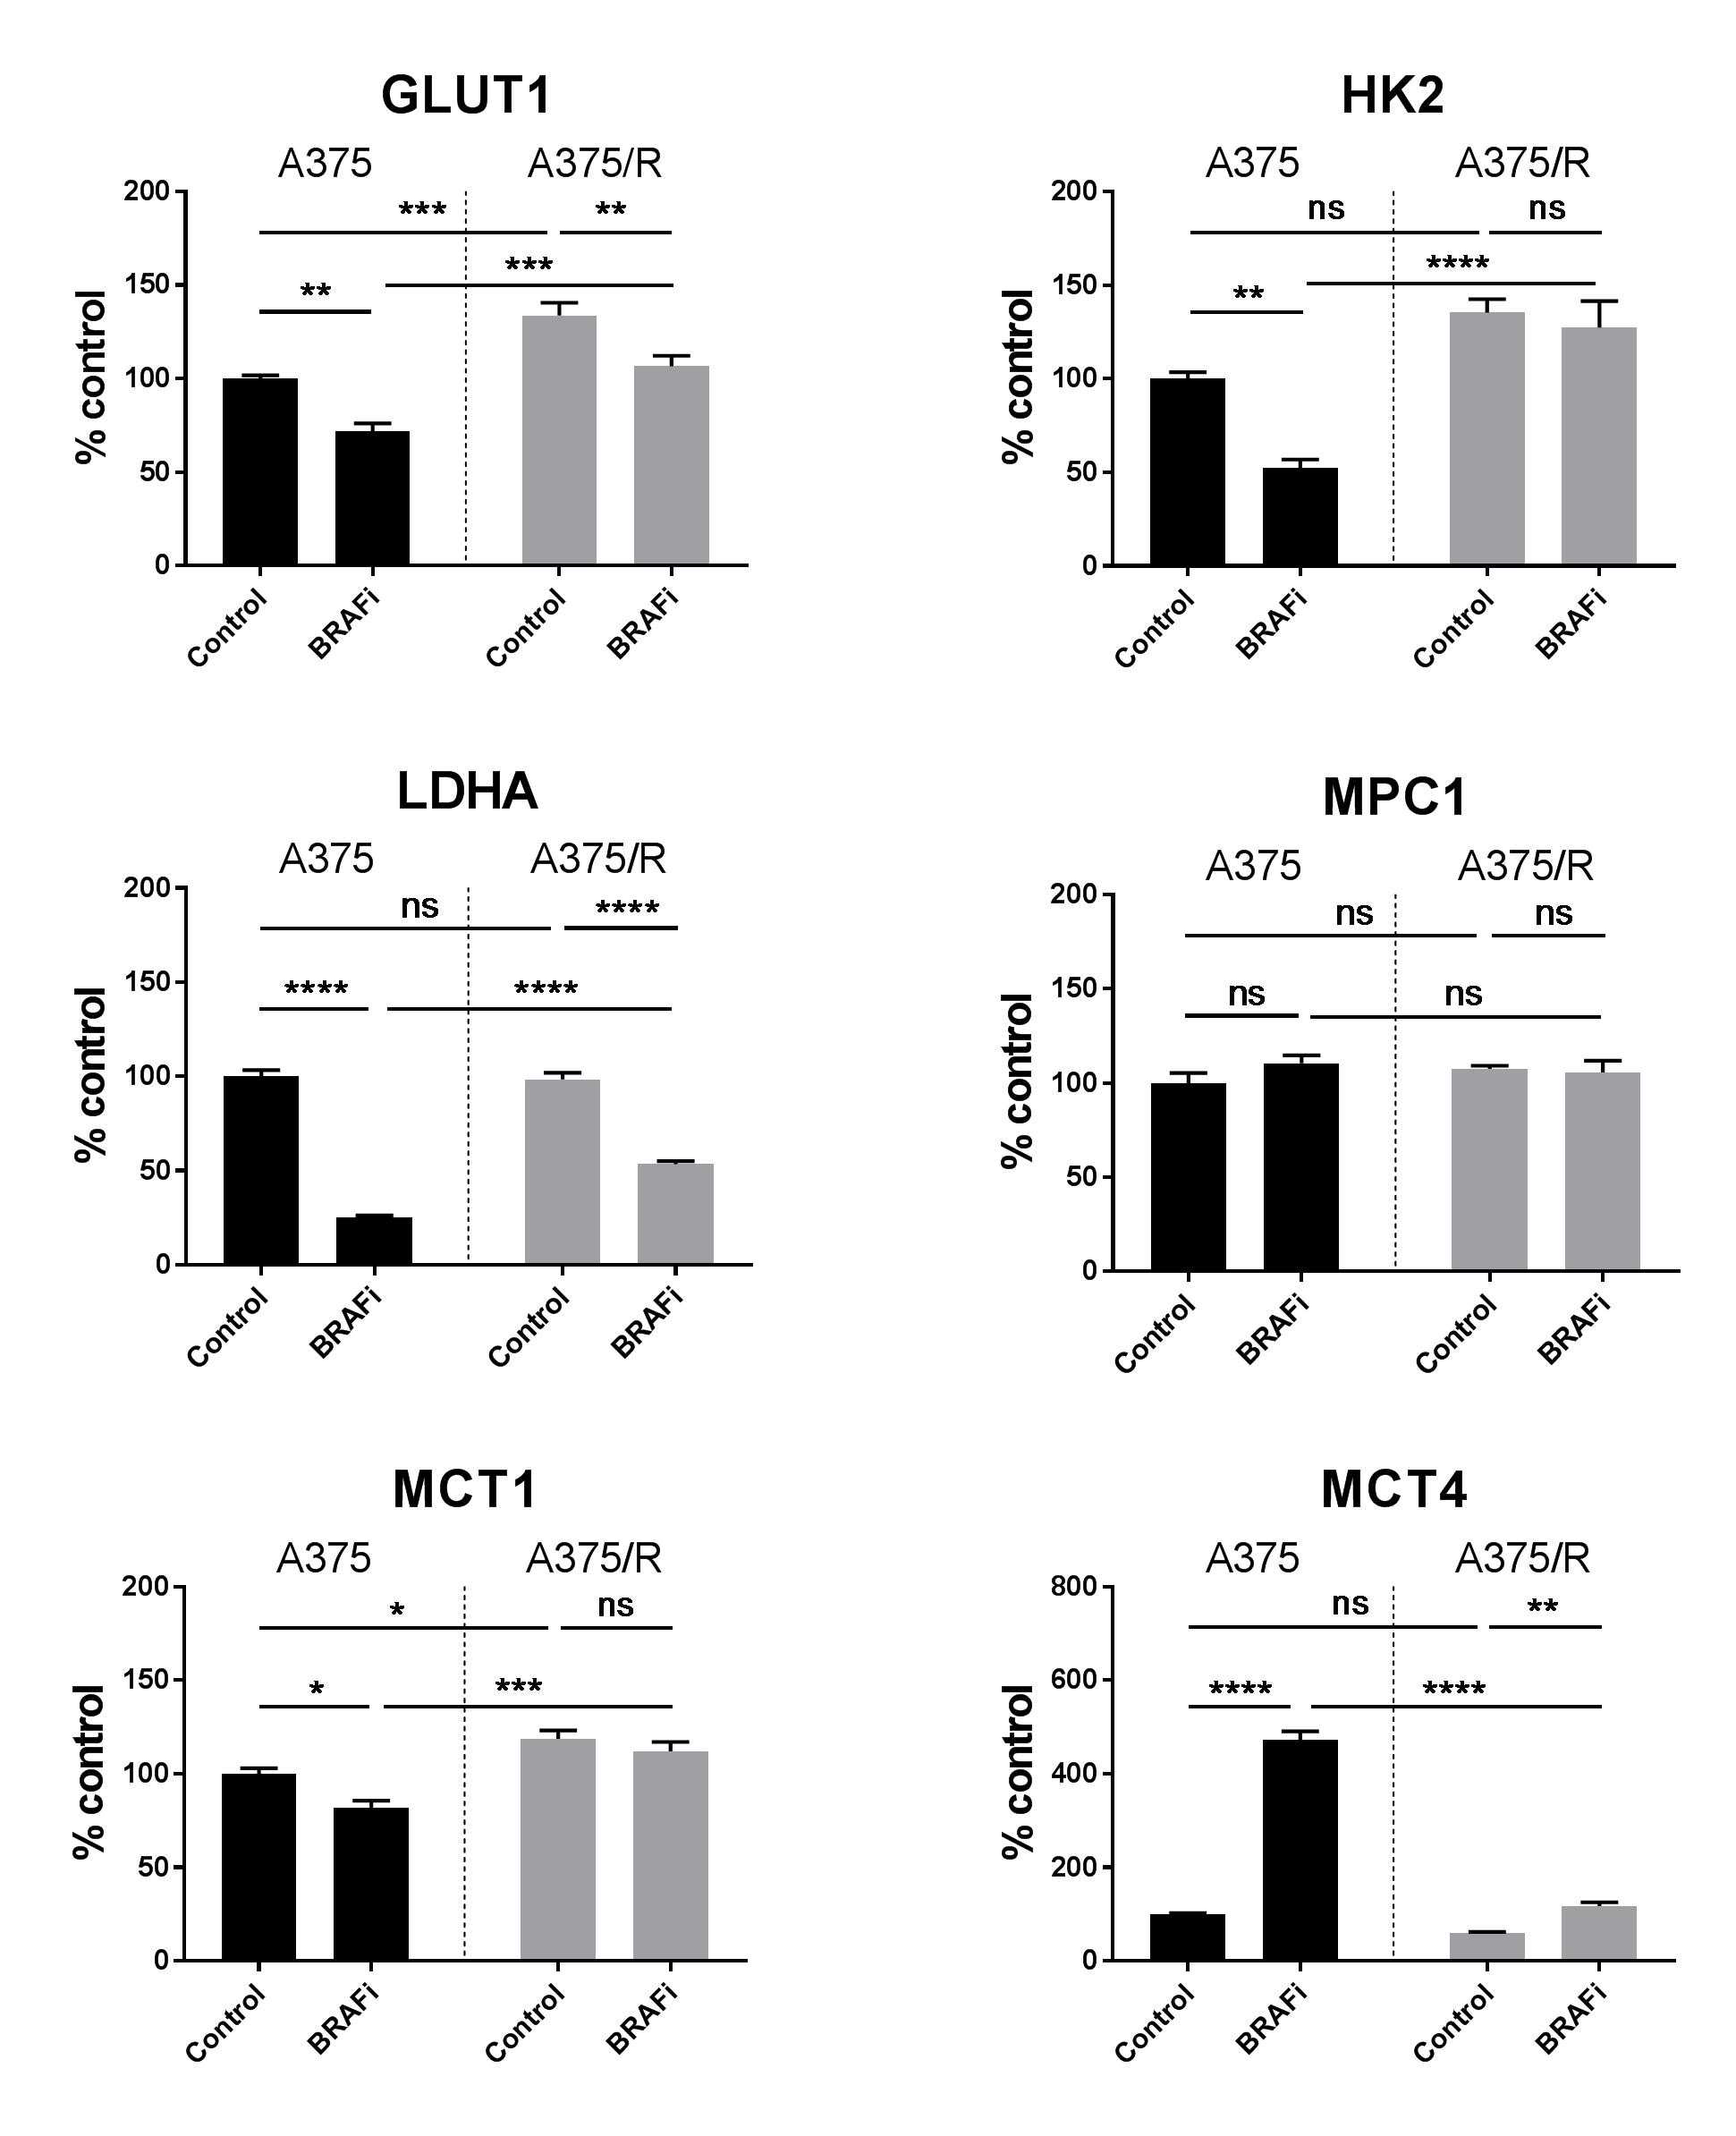
Figure 3. mRNA
expression of key enzymes/transporters involved in cellular metabolism
evaluated in A375 and A375/R cells treated with 2µM vemurafenib or DMSO for
24h (N=2, n=3, two-way analysis of variance ANOVA, followed by Sidak’s test for
multiple comparisons, *p < 0.05. ** p < 0.01, *** p < 0.001, ****
p < 0.0001).