2274
Distribution pattern of neurotransmitters and antioxidants in human brain: a 1H-MRS study at 7 T1Graduate School of Frontier Biosciences, Osaka University, Osaka, Japan, 2Center for Information and Neural Networks (CiNet), National Institute of Information and Communications Technology (NICT), Osaka, Japan, 3Endowed Research Department of Clinical Neuroengineering, Global Center for Medical Engineering and Informatics, Osaka University, Osaka, Japan, 4Department of Neurology, Osaka University Graduate School of Medicine, Osaka, Japan, 5Institute for Open and Transdisciplinary Research Initiatives, Osaka University, Osaka, Japan
Synopsis
The concentrations of some neurotransmitters (N–acetylaspartylglutamate (NAAG), glutamate (Glu), and γ-aminobutyric acid (GABA)) and some antioxidants (glutathione (GSH), ascorbic acid (Asc), and taurine (Tau)) were measured in human brain gray and white matters by using 1H-MRS at 7 T. The distribution patterns of NAAG, Glu, and GABA were completely different from each other. The distribution patterns of the antioxidants had a relatively similar tendency. The concentrations of Asc and Tau were significantly higher in gray matters than in white matters, although there was no significant difference in GSH concentration between the gray and white matter.
Introduction
Neurotransmitters play a key role in brain activity. Antioxidants are essential for brain protection against oxidative stress. MRS is a promising tool to evaluate these brain metabolites simultaneously in vivo. However, their distribution patterns in human brain is not fully investigated by MRS. This is probably attributed to low signal-to-noise ratios and low signal separations of these metabolites. This study aimed at revealing the distribution patterns of some neurotransmitters (N–acetylaspartylglutamate (NAAG), glutamate (Glu), and γ-aminobutyric acid (GABA)) and some antioxidants (glutathione (GSH), ascorbic acid (Asc), and taurine (Tau)) in human brain by using MRS at 7 T, where signal-to-noise ratio and signal separation are expected to be improved.Methods
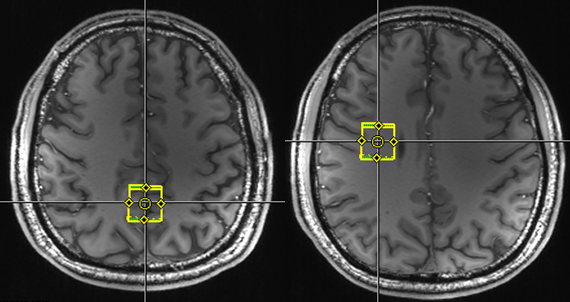
All experiments were performed on a 7-T whole-body MRI scanner (Magnetom 7T; Siemens Healthcare, Erlangen, Germany) with a 32-channel receiver head coil and a single-channel transmitter coil. Ten healthy volunteer (8 males and 2 females; mean age, 40 years; age range, 23-64 years) were examined. Proton MR spectra were acquired with a stimulated echo acquisition mode (STEAM) sequence (TE=10 ms, TR=7000 ms, 64 averages). 2.0-cm cubic regions of interest (ROIs) were positioned on the posterior cingulate cortex and the white matter (Figure 1). The number of 1H-MRS measurements was 24 and 30 for posterior cingulate cortex and white matter, respectively. Shimming in the ROIs was performed using the FASTMAP technique. Water-unsuppressed spectra in the ROIs were also acquired. The acquired spectra were analyzed using LCModel version 6.3-1L (LA Systems Inc., Tokyo, Japan). The basis set including Asc was supplied by the software vendor. Eddy-current correction and water-scaling were carried out using the water-unsuppressed spectra. The concentrations of the metabolites were scaled by that of total creatine (creatine (Cr) and phosphocreatine (PCr)), in order to correct for the underestimation of the concentration due to CSF contamination in the ROIs.Results
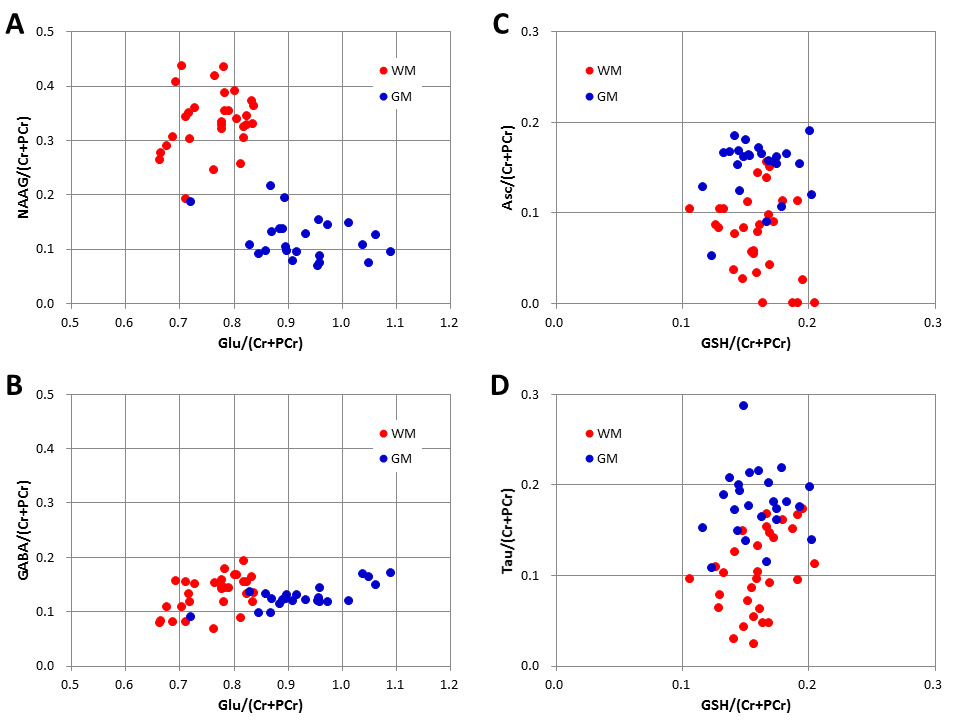
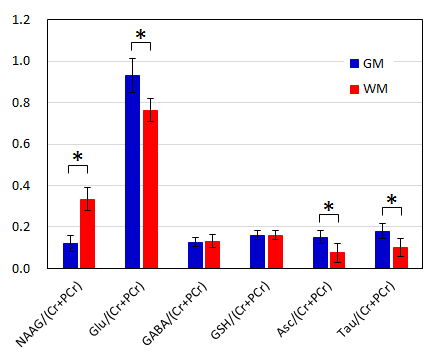
Figure 2 shows the scatter plots of the neurotransmitter concentrations and the antioxidant concentrations. The distributions of NAAG, Glu, and GABA between the gray and white matter were completely different from each other. The concentration of NAAG was significantly higher in white matters than in gray matters, that of Glu was significantly higher in gray matters than in white matters, and there was no significant difference in the concentration of GABA between the gray and white matter (Figure 3). On the other hand, the distributions of the antioxidants between the gray and white matter had a relatively similar tendency. The concentrations of Asc and Tau were significantly higher in gray matters than in white matters, although there was no significant difference in the concentration of GSH between the gray and white matter (Figure 3).Discussion
The concentrations of GABA, GSH, and Asc have been separately measured by using spectral editing techniques, such as MEGA-PRESS. In the present study, the concentrations of these metabolites were simultaneously measured by using STEAM at 7 T. Furthermore, both glutamine (Gln) and Glu concentrations were simultaneously determined with reliable accuracy. The same is true for the N-acetylaspartate (NAA) and NAAG concentration. At 3 T and lower static magnetic field, the separation of Glu from Gln and that of NAAG from NAA are not straightforward. The concentrations of many metabolites can be simultaneously measured by using STEAM at 7 T. Our results showed that the concentration of NAAG was higher in white matters than in gray matters. This is consistent with the results of previous human studies1,2 and a previous animal study3. However, the difference in the concentration of NAAG between the gray and white matter is still unexplained. The distribution patterns of three neurotransmitters (NAAG, Glu, and GABA) were completely different from each other. The distribution patterns of neurotransmitters may depend on the roles of the neurotransmitters (excitatory or inhibitory neurotransmitter), but the reason of these different distributions is still unclear. The concentrations of two antioxidants (Asc and Tau) were higher in gray matters where there are more cell bodies and the metabolism is more active than in white matters. But GSH was distributed equally between the gray and white matter. Further studies are needed to elucidate the reason why the neurotransmitters and the antioxidants have such distribution patterns.Conclusion
The concentration of some neurotransmitters and some antioxidants were measured simultaneously in human brain gray and white matter by using 1H-MRS at 7 T. The distribution patterns of the metabolites were revealed, but the reason of the distributions is still unclear. More detailed measurements of the distributions may leads to better understanding of the reason why the metabolites are distributed in human brain with such patterns.Acknowledgements
We acknowledge Dr. Hirokazu Kawaguchi (Siemens Healthcare K. K.) for his technical support. This study was performed using the pulse sequence programs and the FASTMAP program provided by University of Minnesota.References
1. Pouwels PJ, Frahm J. Regional metabolite concentrations in human brain as determined by quantitative localized proton MRS. Magn Reson Med. 1998;39(1):53-60.
2. Pouwels PJ, Frahm J. Differential distribution of NAA and NAAG in human brain as determined by quantitative localized proton MRS. NMR Biomed. 1997;10(2):73-78.
3. Miyake M, Kakimoto Y. Developmental changes of N-acetyl-L-aspartic acid, N-acetyl-alpha-aspartylglutamic acid and beta-citryl-L-glutamic acid in different brain regions and spinal cords of rat and guinea pig. J Neurochem. 1981;37(4):1064-1067.
Figures