2273
1H MRS assessment of lipid composition at 3T and 7T1NIHR Nottingham Digestive Diseases Biomedical Research Centre, Nottingham University hospitals NHS trust and University of Nottingham, Nottingham, United Kingdom, 2Sir Peter Mansfield Imaging Centre, School of Physics, University of Nottingham, Nottingham, United Kingdom, 3School of Sport, Exercise and Health Sciences, Loughborough University, Louhgborough, United Kingdom
Synopsis
MRI and MRS provides a powerful tool to non-invasively assess lipid deposition in vivo. In addition to fat fraction measurements, recent studies have shown that lipid composition may play an important role in health outcomes. 1H MRS at high field strength provides good SNR of individual fat peaks and can be used to asses lipid composition (saturation, poly-unsaturation etc.). In this study a number of edible oils were scanned at 3T and 7T and MR spectra used to compare measurements of lipid composition with predicted values. An in vivo dataset was also acquired for comparison.
Introduction
Ectopic lipid deposition leads to a number of poor health outcomes1 and is an increasing burden on health care services globally . Whilst most research has focused on the quantity of lipid accumulation, recent studies indicate that lipid composition also plays a key role2. Advanced MR techniques have been developed to evaluate fat deposits in vivo3 and used in many patient studies. MRS in particular offers high SNR of individual fatty acid protons which allows for a non-invasive measure of composition4 in addition to proton density fat fraction (PDFF).
In this study, various edible oils with known lipid profiles were scanned and 1H MRS used to analyse fatty acid composition at 3T and 7T, with the aim to use these measurements in future studies.
Methods
Fat emulsions were produced at 4 different fat fractions (5, 10, 20 and 40%) using 5 different edible oils with varying fatty acid composition (figure 1). Emulsions were injected in spherical phantoms which were laid out in a grid and submersed in water.
Phantoms were scanned at room temperature using a 3T Philips Ingenia MRI system with XL body coil. Single Voxel Spectroscopy was acquired for each emulsion (STEAM, 10x10x10mm, TE=15, 30, 45, 80ms,TR=2000ms, PB shim). Spectra were pre-processed using jMRUI and peaks fitted using AMARES with prior knowledge from previous studies4. T1 correction was applied to the water peak, and the T2 corrected peak amplitudes were used to calculate PDFF%. Data were also acquired using the same protocol from the liver in one subject with elevated liver fat. For preliminary comparisons at higher field strength, the most and least saturated oil (coconut and linseed respectively) were scanned on a 7T Philips system using an 8 channel multi-transmit body coil (MR Coils, Utrecht).
Saturated fat indices (SI) and poly-unsaturated fat indices (UI) were calculated as previously described5. In addition, a novel short-chain fat acid index (SCI) was introduced by taking the ratio of end (methyl) to mid-chain hydrogens whilst also considering the number of carbons associated with each hydrogen as follows: [1/3 Methyl] / [1/3 Methyl + 1/2 (Methylene + β-Carboxyl + α-Olenfinic) + α-Carboxyl + Diacyl].
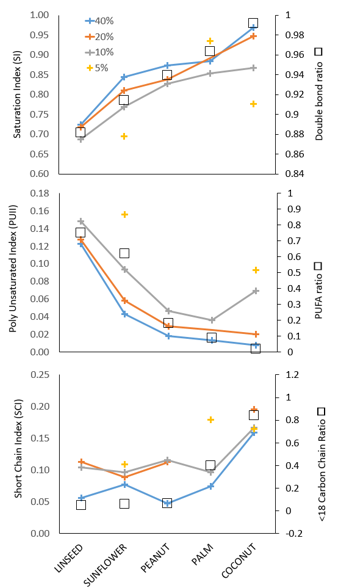
PDFF values were compared with expected values using linear regression. Fat T2 values were also measured and compare across oils. SI, PUI and SCI were calculated for each oil at each fat fraction, and compared with previously published fatty acid compositions 6,7,8 (figure 1).
Results
Figure 2 shows the spectra of the varying oils acquired at 3Tand 7T and in vivo data, which were well shimmed and showed good resolution for lipid index determination.
SI, PUI and SCI calculated for each oil at each PDFF is shown in figure 3 (some values could not be calculated at small PDFFs due to low SNR). At 7T, SI was 0.57 and 0.91; PUI was 0.07 and 0.02; and SCI was 0.11 and 0.08 for linseed and coconut oil respectively. The in vivo lipid indices were SI = 0.91, PUI = 0, SCI = 0.78 and no Diacyl peak was detected.
The measured and actual PDFFs were well correlated (R2 > 0.9) across all oils (figure 4), with a gradient close to unity for all except coconut (gradient=1.24). The total fat T2 values (measured at 40% fat fraction) were 46, 31, 35, 31 and 33 ms for coconut, linseed, palm, peanut and sunflower oils respectively.
Discussion
SI, PUI and SCI were as expected from figure 1 6,7,8, and appear to give stronger agreement for 40% emulsion. Values at 5% were more variability due to poor individual peak SNR, indicating that in vivo studies of lipid composition below 5% are not viable. SCI results were as expected with coconut oil alone having shorter chain (carbon < 16) fatty acids, and Introducing this term may also prove useful, as medium and short chain fatty acids are considered to have more health benefits.
PDFF remained stable across different lipid compositions, although coconut oil PDFF was slightly elevated. The T2 of fat in coconut oil was also greater than the other oils.
In vivo lipid is stored as triglycerides and can be made up of saturated or unsaturated fats. The subject in this study had lipid indices that indicate highly saturated, long-chain triglyceride content. The 7T spectra from this study provided pilot data that should be developed in future work.
Conclusion
This study showed the potential of using high field MRS to measure varying lipid composition. MRS provides unique insight into fatty acid composition, and may have a range of applications in liver fat, adipose tissue and stomach content measurements.Acknowledgements
No acknowledgement found.References
1. Zelber-Sagi, S., V. Ratziu, and R. Oren. Nutrition and physical activity in NAFLD: An overview of the epidemiological evidence. World Journal of Gastroenterology, 2011, 17(29), 3377-3389;
2. Luukkonen, P.K., et al., Saturated Fat Is More Metabolically Harmful for the Human Liver Than Unsaturated Fat or Simple Sugars. Diabetes Care, 2018. 41(8): p. 1732-1739.
3. Reeder, S.B., H.C.H. Hu, and C.B. Sirlin, Proton density fat-fraction: A standardized mr-based biomarker of tissue fat concentration. Journal of Magnetic Resonance Imaging, 2012. 36(5): p. 1011-1014
4. Hamilton, G., et al., In vivo characterization of the liver fat H-1 MR spectrum. Nmr in Biomedicine, 2011. 24(7): p. 784-790.
5. Johnson, N.A., et al., Noninvasive assessment of hepatic lipid composition: Advancing understanding and management of fatty liver disorders. Hepatology, 2008. 47(5): p. 1513-1523.
6. Orsavova, J., et al., Fatty Acids Composition of Vegetable Oils and Its Contribution to Dietary Energy Intake and Dependence of Cardiovascular Mortality on Dietary Intake of Fatty Acids. International Journal of Molecular Sciences, 2015. 16(6): p. 12871-12890.
7. Lewinska, A., et al., Fatty Acid Profile and Biological Activities of Linseed and Rapeseed Oils. Molecules, 2015. 20(12): p. 22872-22880.
8. Taufik, M., H.N. Lioe, and N.D. Yuliana, Evaluation of Major Fatty Acids Determination in Palm Oil by Gas Chromatography-Flame Ionization Detection. Agritech-Jurnal Teknologi Pertanian, 2016. 36(3): p. 308-316.
Figures