2270
Neurochemical measurement in the thalamus: a test-retest study at 7T1Laboratory for functional and metabolic imaging (LIFMET), Ecole Polytechnique Fédérale de Lausanne, Lausanne, Switzerland, 2Laboratory of functional and metabolic imaging, McGill University, Montreal, QC, Canada, 3Center for Biomedical Imaging (CIBM), Ecole Polytechnique Fédérale de Lausanne, Lausanne, Switzerland
Synopsis
Thalamus has been known as a critical hub through which bidirectional neural signals are transmitted between
Introduction
Thalamus plays a key role in neuronal connectivity between cortical and subcortical regions and is functionally related to cognitive ability and emotion. Its abnormalities have been implicated in psychiatric disorders such as schizophrenia, bipolar disorder, and mood disorder [1]. Although neurochemical measurement in thalamus has been attempted at 1.5 or 3T [2], limitations in sensitivity and spectral dispersion hampered the report of metabolites such as GABA and glutathione and glutamate, which are known as important neurochemicals involved in the neuropathology of psychiatric disorders. High magnetic field strength enables us to achieve improved sensitivity and spectral resolution. Therefore, we aim to measure the neurochemical profile in the thalamus at 7T and then to evaluate the measurement reproducibility by a test-retest study for future clinical research.Methods
6 healthy volunteers (23 – 29 years old, 1F/5M) gave informed consent prior to the study and participated in MR measurements twice at 7T (Siemens, Erlangen, Germany). MP2RAGE sequence was used to acquire images for the voxel positioning (TR = 6000 ms; TI1/TI2 = 800/2700 ms; TE = 4.94 ms; FOV = 192×192 mm2; Slice thickness = 0.6 mm; Matrix size = 256×256). B0 field shimming was performed using first- and second-order shims with FAST(EST)MAP. A semi-adiabatic SPECIAL sequence was used to acquired spectra from the thalamus region (TR = 6500 ms; TE = 16 ms; VOI = 20×18×16 mm3; bandwidth = 4000 Hz; Average = 118, number of data points = 4096). Spectral quantification was processed using LCModel. Metabolites with CRLB of 999% were considered as non-detected. Reproducibility of the measurements was tested using coefficients of variance (CoV). An unpaired two-tailed Student’s t-test was used to compare the metabolic concentrations between 1st and 2nd scans. All data were expressed as mean ± SD unless stated otherwise.Results
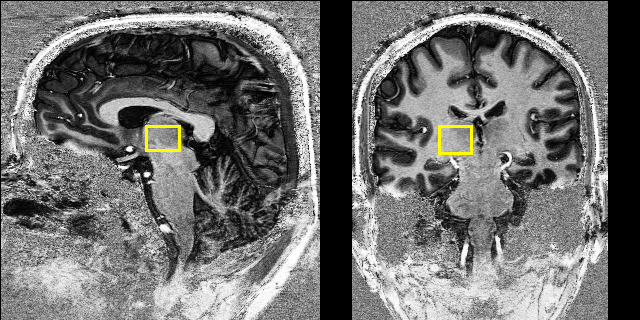
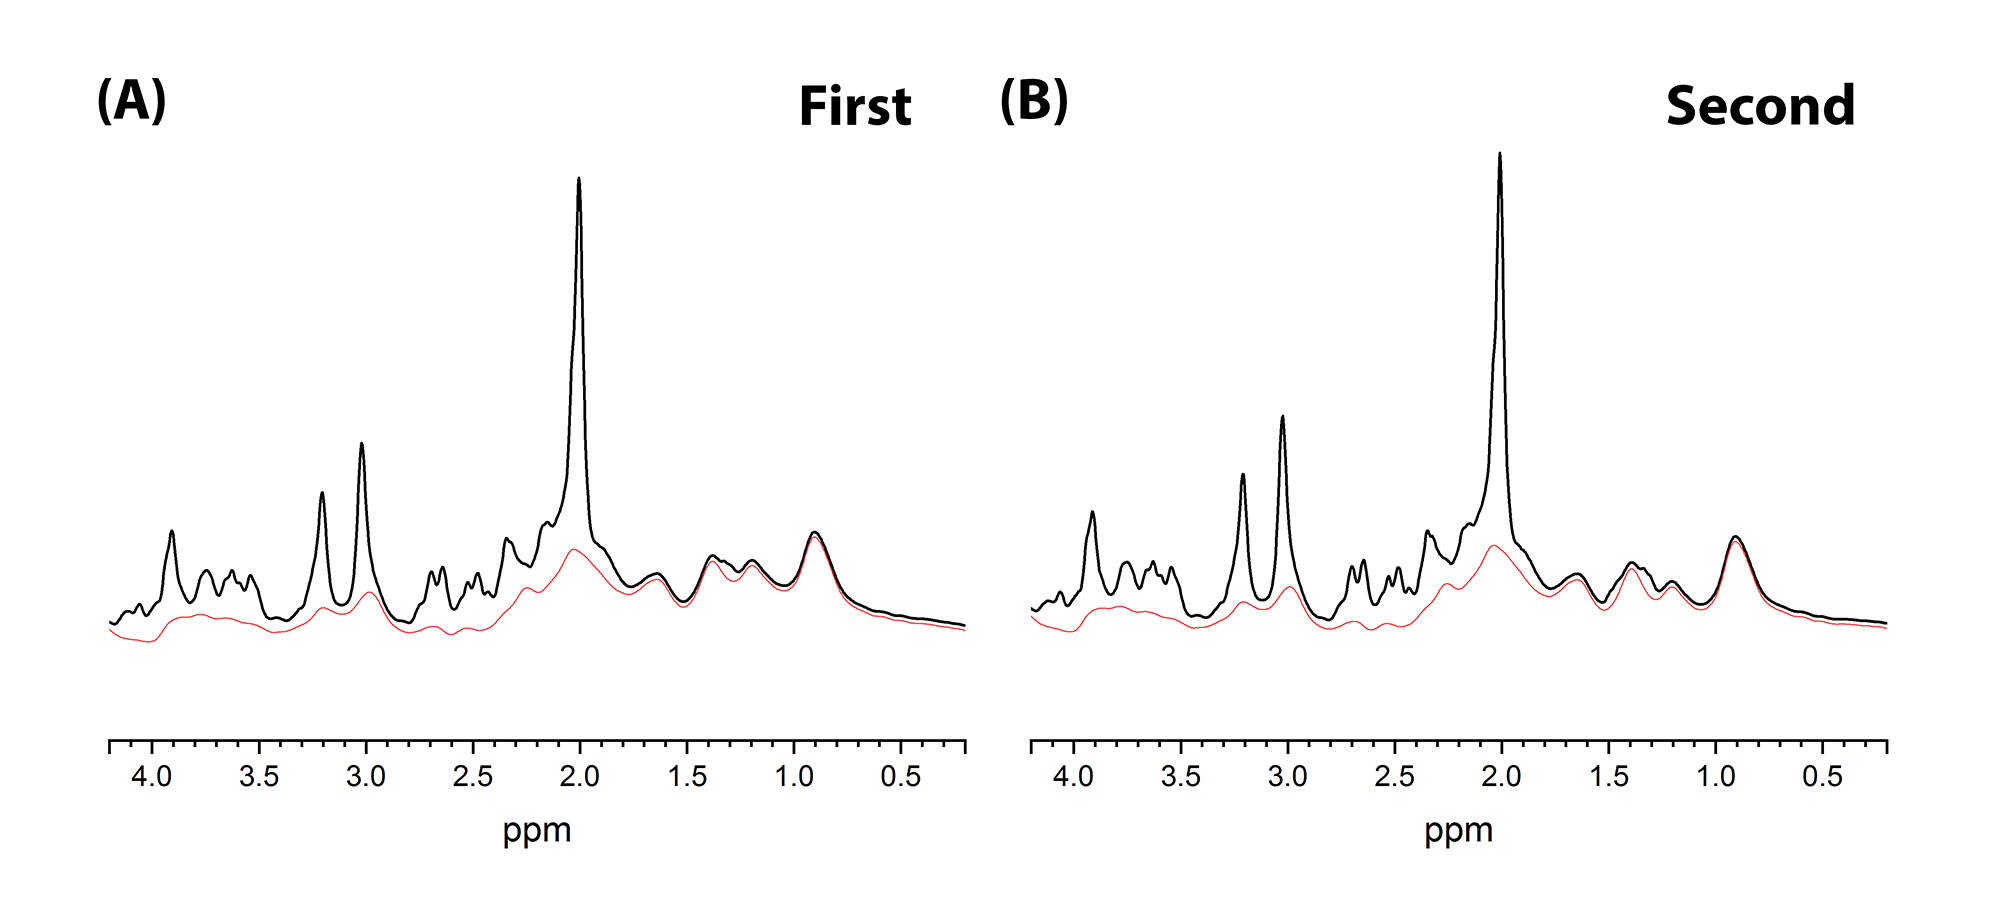
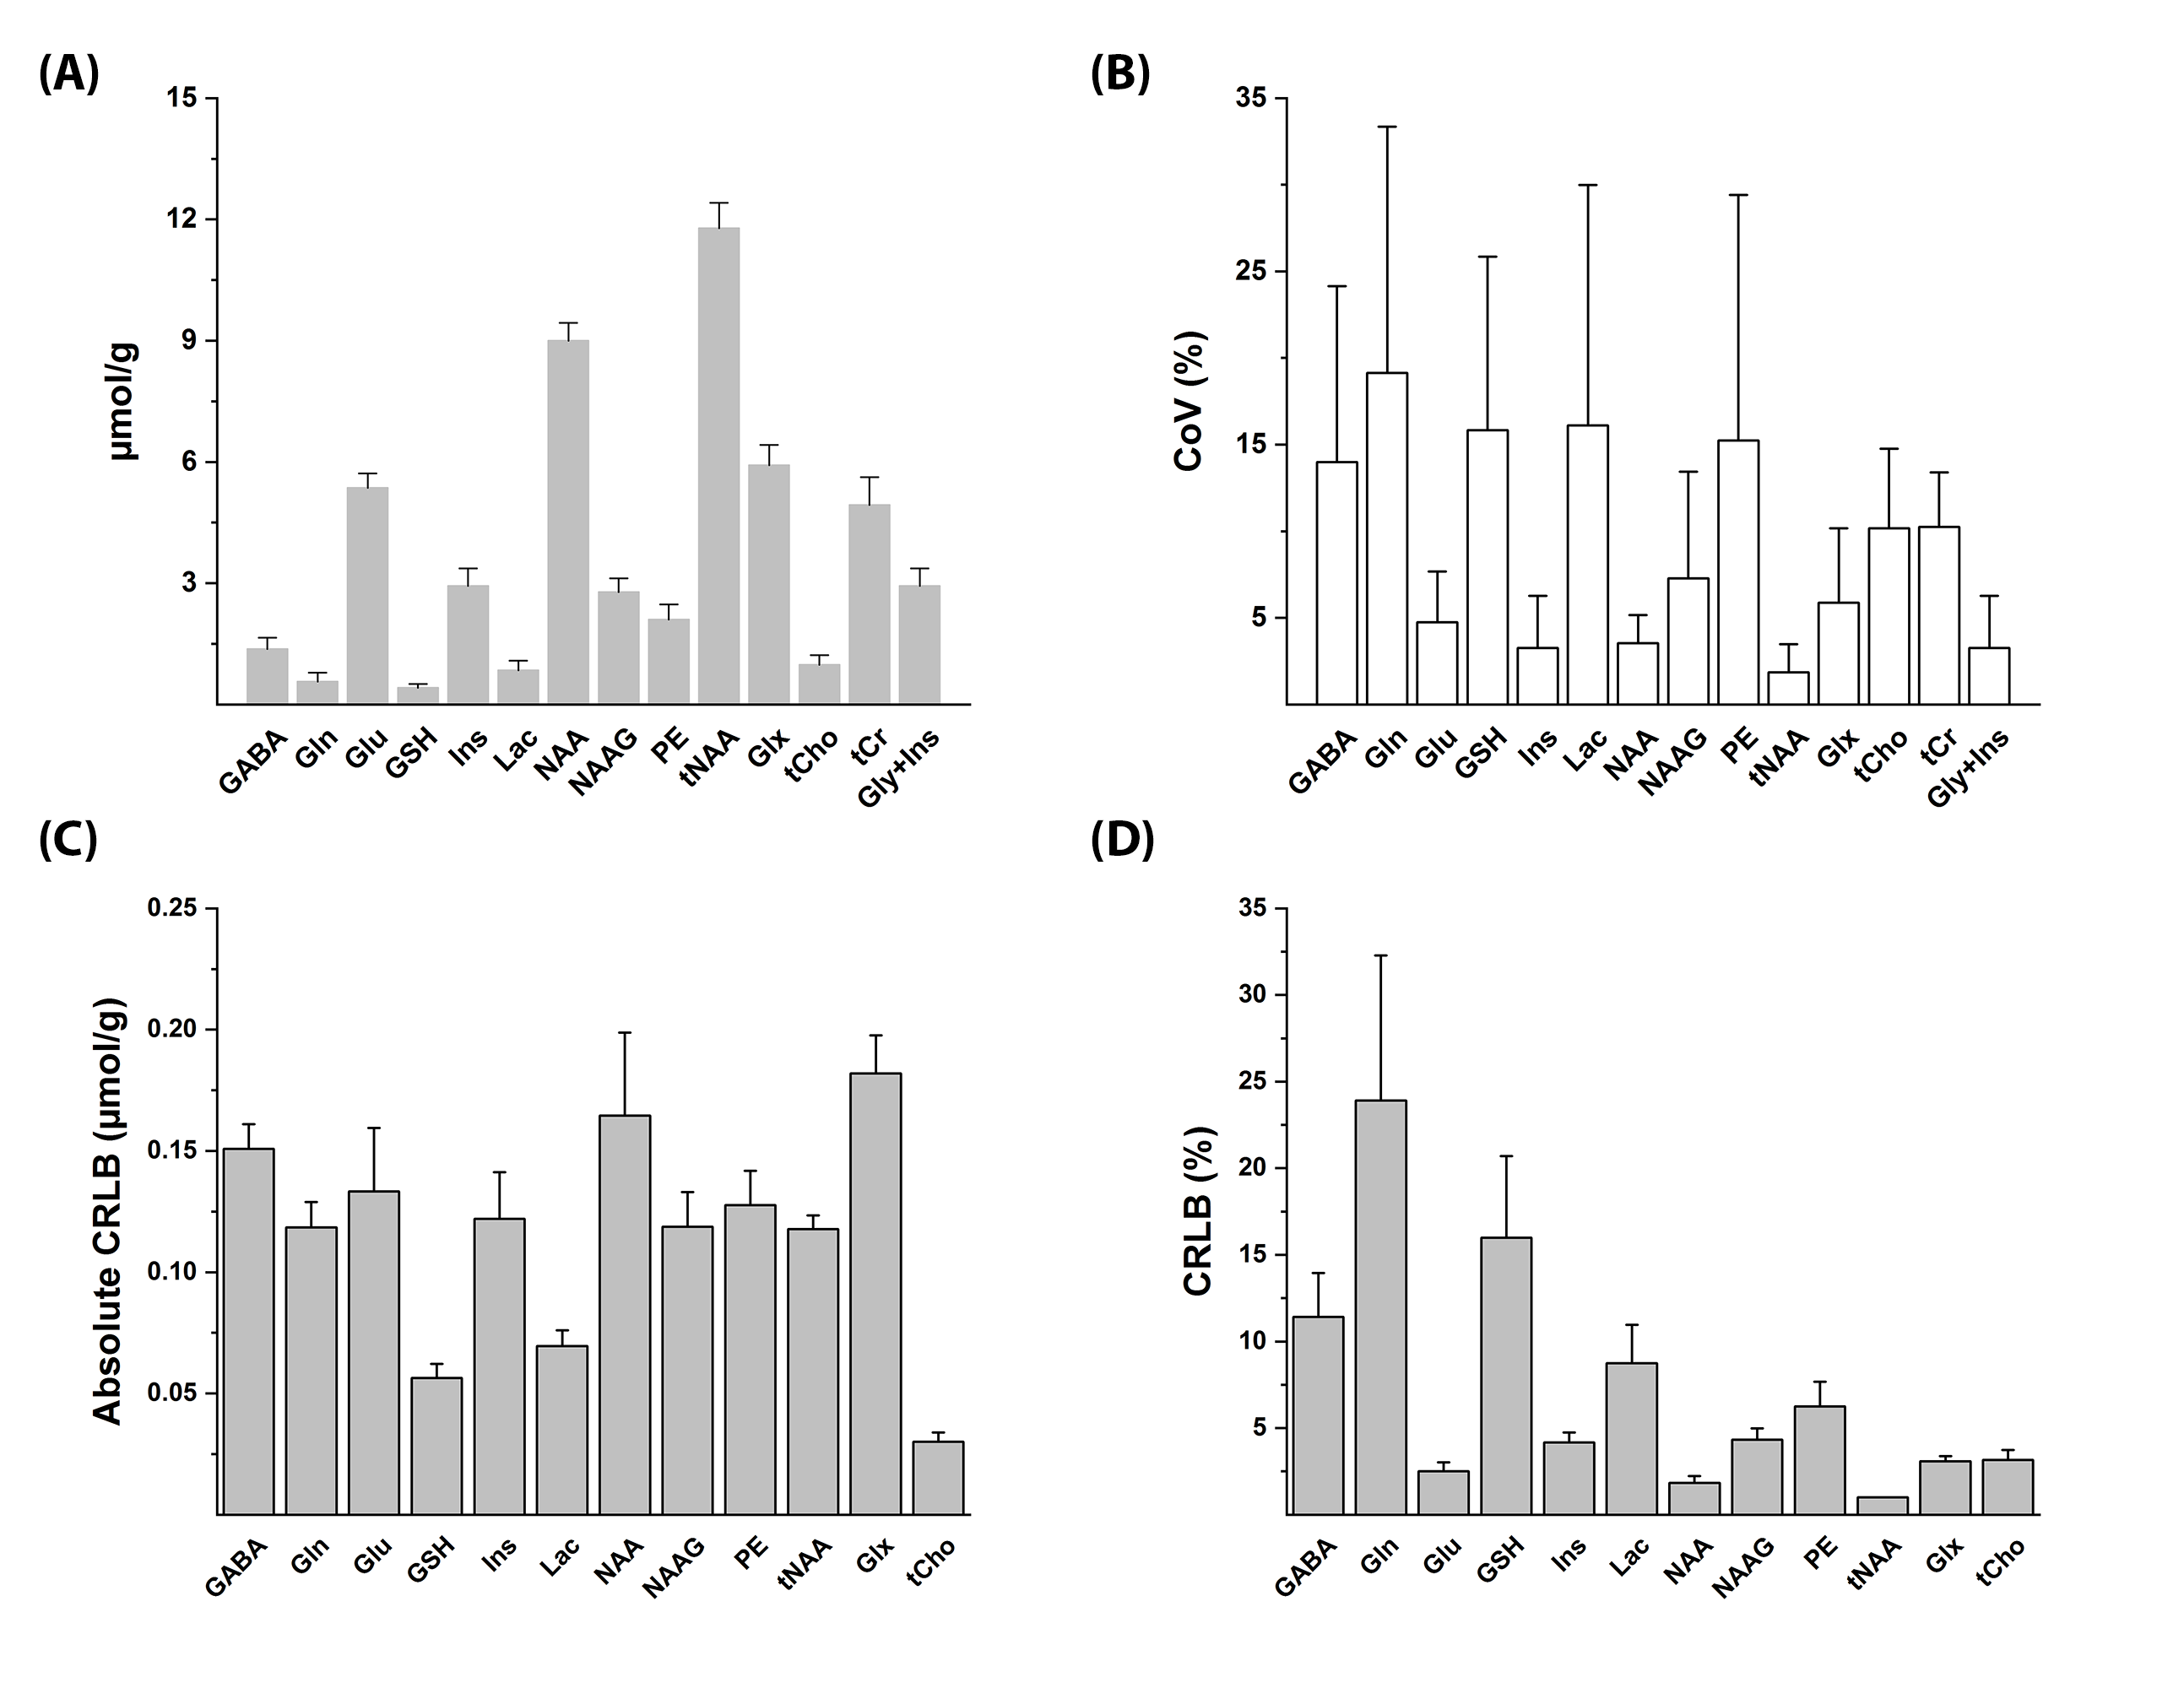
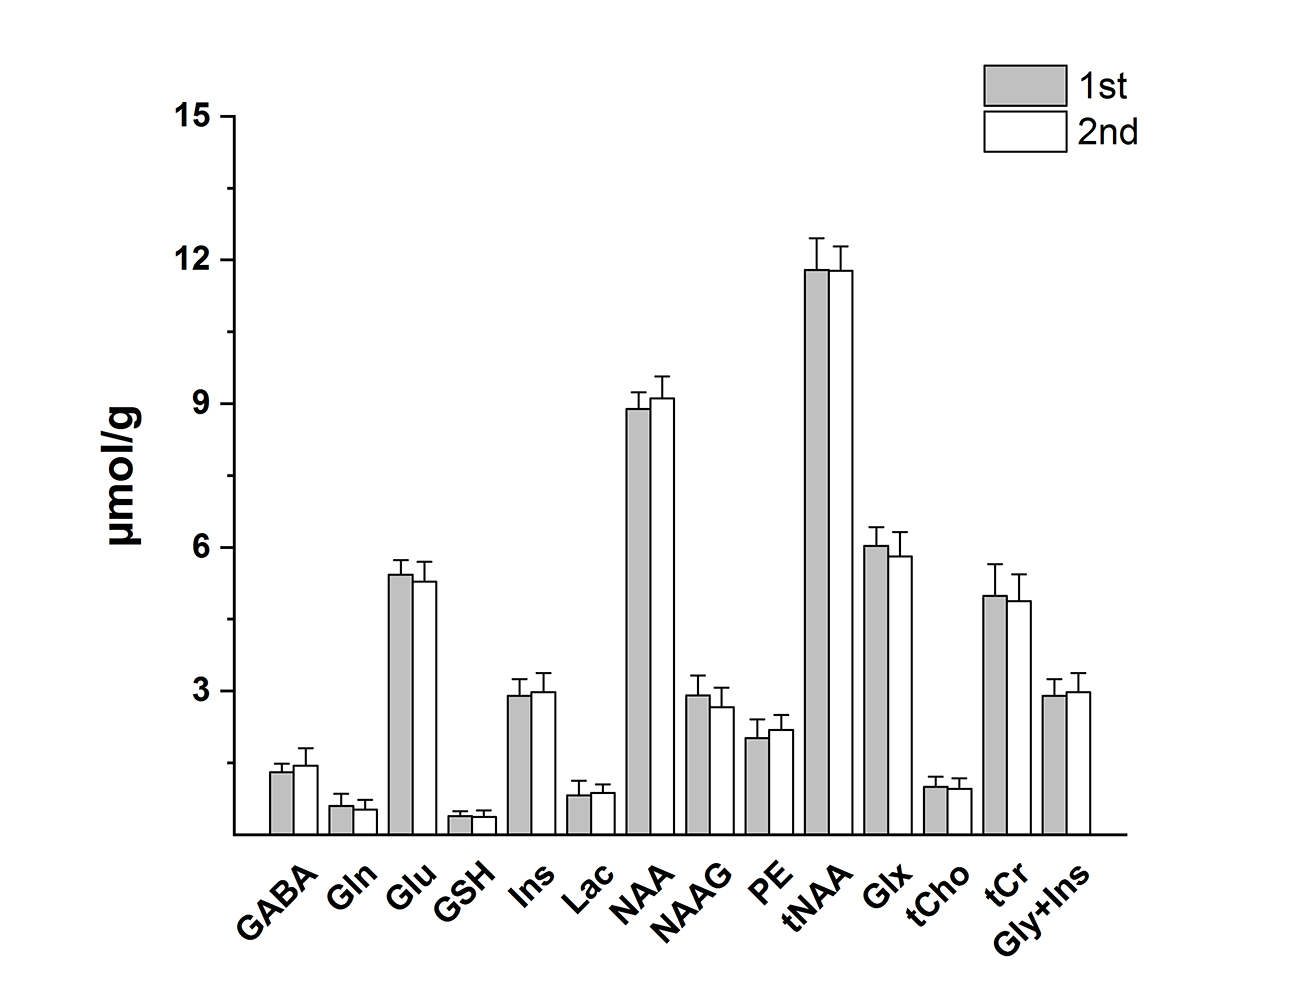
The mean water linewidths achieved in the thalamus were 15 ± 2 Hz (1st scan) and 15 ± 1 Hz (2nd scan). The mean SNRs were 89 ± 17 (1st scan) and 92 ± 14 (2nd scan), respectively. No significant difference was observed between scans. Figure 1 shows the representative images of the volunteers with the MRS voxel in yellow. Figure 2 presents the representative spectra from (A) the first and (B) second sessions on the same subject with macromolecule spectra in red respectively. Figure 3 (A) shows mean metabolites levels with SD, (B) mean CoV (%) of the metabolites with SD, (C) mean absolute CRLB (mmol/g) and (D) relative CRLB (%). Figure 4 shows mean metabolite levels in each session. There is no significant difference in the measurements between scans.Discussion and Conclusion
This is the first reproducibility study in the thalamus at 7T. 10 metabolites can be quantified with a mean CRLB < 30% in the thalamus using a short TE MRS method. The high local susceptibility gradient leads to broader spectral linewidth relative to other cortical regions. Furthermore, the thalamus is located in the middle of the brain and far away from the array coil, which suffers from low sensitivity. Mean CoVs are around 5% for the metabolites with high concentration (NAA, Glu, Ins), suggesting an excellent reproducibility. The mean CoVs of other metabolites with low concentration were around 10%. For GABA (14%) and GSH (16%), the measurement variability is rather large, which may require larger sample size in a future application study. We conclude that short TE MRS in thalamus at 7T allows the detection of 10 metabolites with good reproducibility for abundant metabolites and moderate reproducibility for less abundant metabolites. This study provides a reference for future neurological studies in the thalamus.Acknowledgements
Supported by Centre d’Imagerie BioMédicale (CIBM) of the UNIL, UNIGE, HUG, CHUV, EPFL, and the Leenards and Jeantet Foundations.References
[1] Pergola G, Selvaggi P, Trizio S, Bertolino A, Blasi G. The role of the thalamus in schizophrenia from a neuroimaging perspective. Neurosci. Biobehav. Rev. 2015;54:57–75. doi: 10.1016/j.neubiorev.2015.01.013.
[2] P. Delamillieure, J.M. Constans, J. Fernandez, P. Brazo, K. Benali, P. Courthéoux, F. Thibaut, M. Petit, S. Dollfus, Proton magnetic resonance spectroscopy (1H MRS) in schizophrenia: Investigation of the right and left hippocampus, thalamus, and prefrontal cortex, Schizophr. Bull. 28 (2002) 329–339. doi:10.1093/oxfordjournals.schbul.a006942.
Figures