2268
The association between plasma and brain glutamine and glutamate in healthy volunteers probed by LC-MS and 1H-MRS1Department of Molecular Imaging and Theranostics, National Institutes for Quantum and Radiological Science and Technology, Chiba, Japan, 2Department of Functional Brain Imaging Research, National Institutes for Quantum and Radiological Science and Technology, Chiba, Japan, 3CIBM, École polytechnique fédérale de Lausanne, Lausanne, Switzerland, 4Department of Psychiatry, McGill University, Montreal, QC, Canada, 5Department of Radiological Sciences, Komazawa University, Tokyo, Japan, 6National Institutes for Quantum and Radiological Science and Technology, Chiba, Japan
Synopsis
The present study aimed to evaluate the association between the plasma and brain glutamine (Glu) and glutamate (Gln) using proton magnetic resonance spectroscopy (1H-MRS) and liquid chromatography-electrospray ionization-tandem mass spectrometry (LC-MS), respectively, in 20 participants. A positive correlation between Gln to
Background
Glutamine (Gln) and Glutamate (Glu) are the major molecules associated with the pathophysiology of brain diseases such as Alzheimer’s disease and schizophrenia. Both these molecules are known to be present in the plasma and brain. To understand the association between the plasma or brain molecule and pathophysiology, understanding the relationship between the plasma and brain molecule is essential.Aim
The present study evaluated the association between the plasma and brain Glu and Gln using proton magnetic resonance spectroscopy (1H-MRS) and liquid chromatography-electrospray ionization-tandem mass spectrometry (LC-MS), respectively.Methods
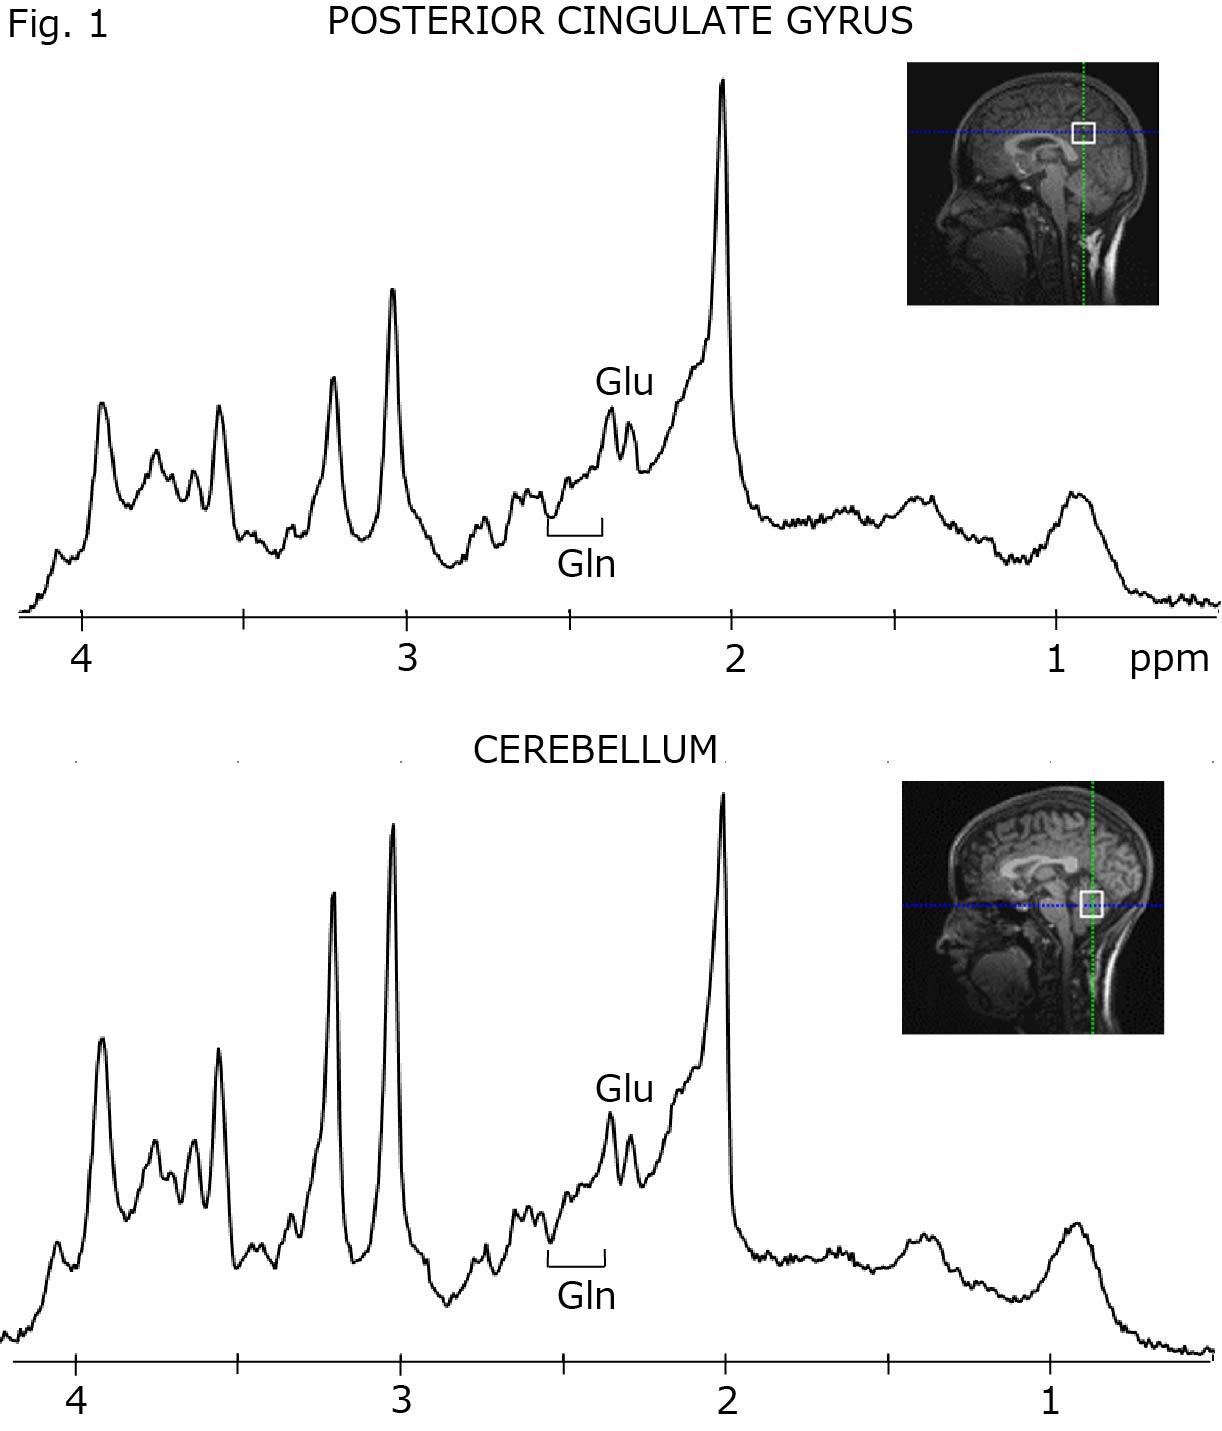
1H-MRS: A total of 10 men and 10 women volunteers (age: 20-29 years) were scanned on a 3 T scanner (Siemens Verio) with a 32-channel receive head coil. In all the participants, 1H-MRS was performed twice sequentially in the same day at 15-min interval. The voxels of interest (VOIs) of 1H-MRS were localized at the posterior cingulate gyrus (PCC) and cerebellum (Cbll) (Fig. 1), and the short echo time ‘SPECIAL’ sequence was used for the measurement. LCModel, with a simulated basis set including simulated macromolecule signal was used to analyze the MRS data. The test-retest reliability of Glu, Gln and creatine + phosphocreatine (total Cr, tCr) measurements were investigated using 2 separate 1H-MRS examinations on 1 day. LC-MS: Blood samples were collected at 02:00 PM after 5-h fasting. The concentrations of Glu and Gln in the plasma were measured by LC-MS. The measurement was conducted at a commercial laboratory (SRL Co., Ltd., Japan). Statistics: The results are presented as the mean ± standard deviation (SD). Data were analyzed in IBM SPSS 20 (IBM Corp, Armonk, USA) with t-test, followed by Bonferroni-adjusted p values (0.015) whenever appropriate. Associations between the plasma and brain Gln and Glu were examined using Spearman’s correlation coefficient with adjusted p value<0.025.Results and Discussion
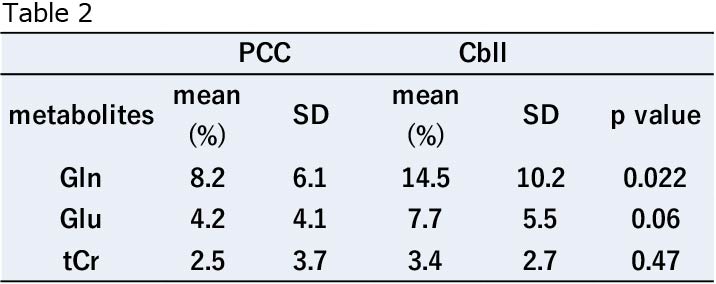
Cramér–Rao Lower bound (CRLB) in PCC and Cbll: Both in PCC and Cbll, the mean CRLB of each metabolite (Gln, Glu and tCr) was <15% (Table 1). The typical spectra and VOIs are shown in Fig. 1. We acquired the spectra of sufficient quality from all participants. Test-retest reliability of 1H-MRS measurements: We investigated test-retest reliability of 1H-MRS measurements for Glu, Gln and tCr in both PCC and Cbll. Using 2 separate measurements, the percent coefficient of variance (%CoV) was calculated for Glu, Gln and tCr in PCC and Cbll. %CoV of tCr was acquired since we used tCr as the internal reference for Glu and Gln concentrations in brain. The results are summarized in Table 2. Regarding Gln measurements, %CoV in PCC showed a smaller trend than %CoV in Cbll (p = 0.022). Neither Glu nor tCr showed significantly different %CoV in both the regions. Correlations between plasma and cerebral Glu/Gln: We investigated the association between the plasma and brain Glu and Gln, resulting in a significant positive correlation between cerebral Gln/tCr in PCC and plasma Gln (r = 0.56, p < 0.001). The correlation in our work agrees with that in a previous report which has claimed that a significant association exists between the levels of Gln in the plasma and extracellular space (1). Glu did not show any significant correlations between the brain and plasma that might be attributed to the limited transport at blood brain barrier (BBB) (2). No significant correlation was noted between the plasma Gln and Cbll Gln/tCr, which may suggest that the degree of correlation between the plasma and brain may vary depending on the brain regions. Considering a smaller trend of %CoV in PCC than in Cbll for Gln measurements, no significant correlation in Cbll may also be attributed to the lower reliability in Cbll than in PCC.Conclusions
A positive correlation between Gln/tCr in PCC and the plasma Gln may suggest that Gln can be transferred effectively by Gln transporters at the BBB, but further work is needed to investigate this possibility. No correlation of Gln in Cbll may be attributed to either regional difference of Gln transport or lower reproducibility in Cbll than in PCC. No correlation in Glu may suggest that the Glu transport is strictly regulated at the BBB in healthy subjects. Given the influence of the plasma Gln to the brain Gln, we need to be aware of fasting conditions for the measurements of brain glutamatergic metabolites by 1H-MRS.Acknowledgements
This research is partially supported by the Strategic Research Program for Brain Sciences from Japan Agency for Medical Research and development, AMED.References
1. J Nutr. 136: 218S-226S, 2006 2. J Nutr. 139:1016S-1022S, 2000
Figures