2267
Initial observations of position-dependent B0 distortions in a concurrent TMS/MRS phantom experiment1Physics & Astronomy, University of British Columbia, Vancouver, BC, Canada, 2International Collaboration on Repair Discoveries, Vancouver, BC, Canada, 3Philips Healthcare, Markham, ON, Canada, 4Radiology, University of British Columbia, Vancouver, BC, Canada, 5Mechatronic Systems Engineering, Simon Fraser University, Vancouver, BC, Canada, 6Psychiatry, Non-Invasive Neurostimulation Therapies, University of British Columbia, Vancouver, BC, Canada, 7Pathology & Laboratory Medicine, University of British Columbia, Vancouver, BC, Canada
Synopsis
There is interest in using MRS to study the effects of transcranial magnetic stimulation (TMS), but a major challenge is B0 inhomogeneities introduced by the TMS coil. Phantom work showed increasing B0 inhomogeneity as the MRS voxel was moved closer to the TMS coil. Distortions in the metabolite signals included increased noise fluctuations and spectral linewidth by ~50% when the voxel center was < 6cm away from the TMS coil B0 inhomogeneity effects were similar whether the TMS coil was pulsing prior to the PRESS sequence or not. Our results suggest TMS/MRS may be able to resolve spectra in vivo.
Background
Magnetic resonance spectroscopy (MRS) allows for non-invasive quantification of in vivo brain metabolites, including n-acetyl-aspartate (NAA), creatine, choline, glutamate, and myo-inositol. MRS can study the effects of transcranial magnetic stimulation (TMS)1–3, a non-invasive procedure used to treat neuropathic pain4 and major depression5 by stimulating targeted regions in the brain. Using an electromagnetic coil, TMS creates a strong and rapidly changing magnetic field, inducing an electric field that depolarizes the targeted neurons, initiating an action potential6. While TMS has been used concurrently with other MR modalities like fMRI7–9, to our knowledge no studies have reported results using concurrent TMS/MRS. A major challenge in implementing TMS/MRS is the B0 inhomogeneities introduced by the presence of the TMS coil, which may be too great to be completely corrected by shimming.Goals
- To characterize the spatial dependence of B0 distortions introduced by the TMS coil.
- To determine whether TMS pulses affect B0 inhomogeneity.
Methods
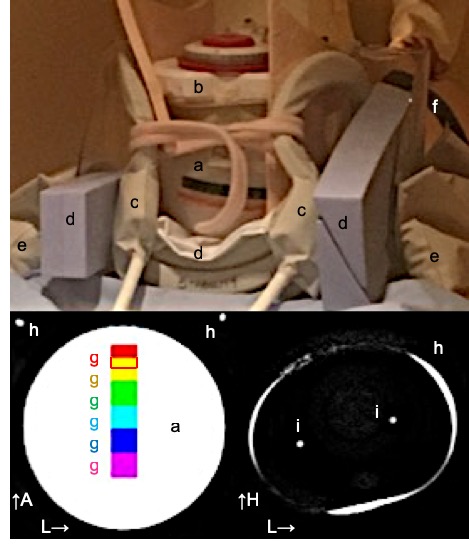
MR Experiments: All 1H-MR spectra were collected from a “Braino” phantom (GE Medical Systems), using the setup depicted in Figure 1. Experiments were performed on a 3T Philips Achieva with a 2 channel Sense Flex L surface coil array. MR spectra were acquired from 20×20×20cm3 voxels aligned with the central axis of the TMS coil (PRESS sequence, TR/TE=4000/30ms, 16 non-water-suppressed acquisitions using phase cycling) at six distances away from the centre of the TMS coil (centre of the voxel ranged from 37-126mm away). The minimal distance from the corner of any voxel to the surface of the phantom was 11.4mm. Using a sync box, experiments were performed using a pulse delay of either 100ms or 200ms between the TMS pulse and 90° excitation pulse, or with no TMS pulse. Second order shimming was repeated between all experiments. To calculate TMS coil to voxel distances, T1-weighted images with 1mm3 isotropic resolution (inversion time=1052ms, shot interval=3000ms, TE/TR=3.5/8.1ms, FOV (ap/fh/rl)=256/256/165mm) were acquired.
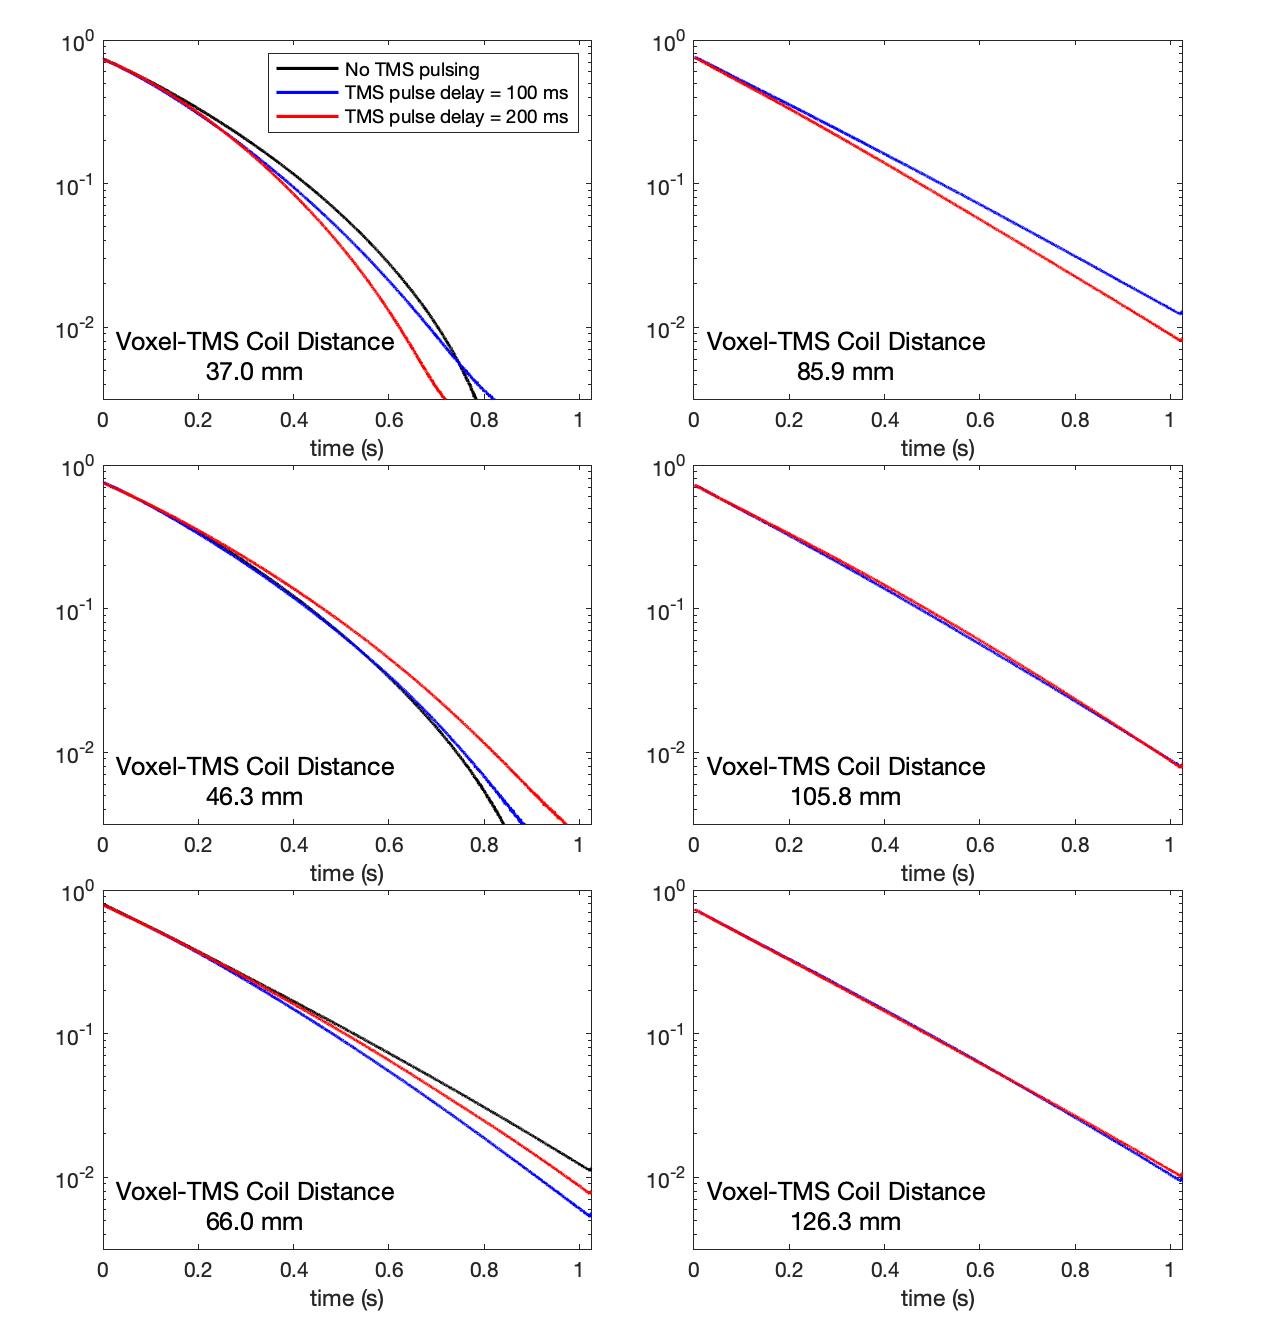
Data Analysis: Raw free induction decays were processed by averaging all 16 phase cycled acquisitions, followed by zero order phase correction and frequency alignment. B0 inhomogeneity was assessed by measuring the spectral full-width-half-maximum (FWHM) calculated by fitting the time domain signal to a specified function, and calculating that function’s FWHM in the frequency domain. In a highly homogeneous B0 field, the magnitude of the signal can be fit to a function of the form $$$s(t)=A\exp(-t/T_2^*)$$$. However, in regions of higher inhomogeneity, the signal decays more rapidly than a pure exponential function. In our experiments, fitting the signal to an exponential/sinusoidal function $$$s(t)=A\exp(-t/T_2^*)\cos(2\pi f t + \phi)$$$ was found to improve the residual RMS by a factor of ~15.
Results
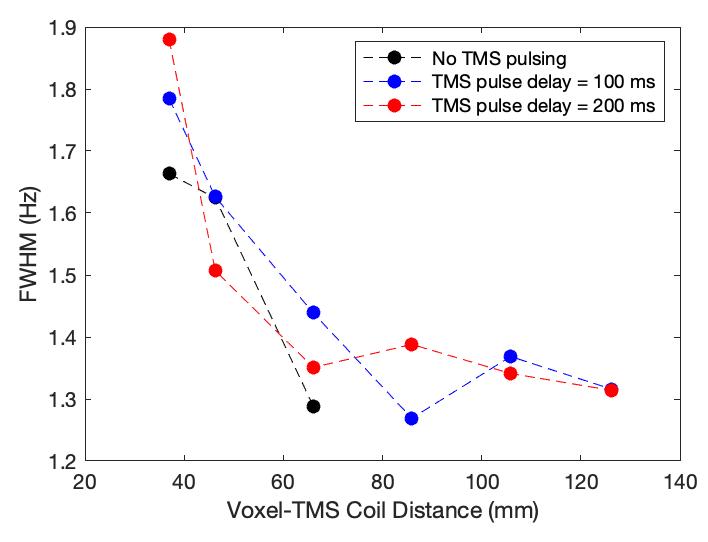
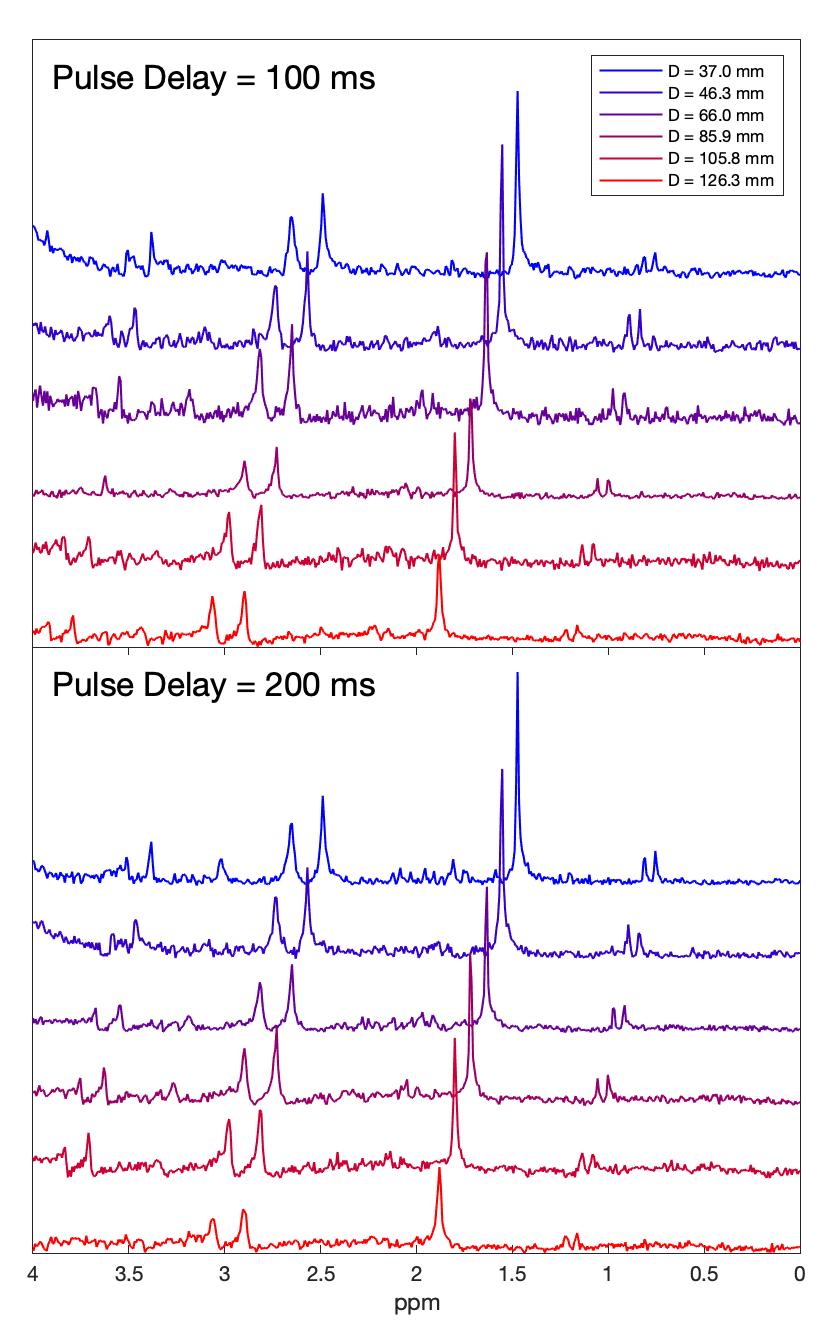
The B0 inhomogeneity increased with decreasing distance between the TMS coil and the voxel, as is evident in the free induction decays (FIDs) which was increasingly distorted from a pure exponential decay (Figure 2). The increase in B0 inhomogeneity closer to the TMS coil was also reflected in the spectral linewidth (Figure 3), which increased by about 50% for voxels closer than 6cm. The FID distortions and FWHM were similarly increased closer to the TMS coil, regardless of the TMS pulse delay prior to the PRESS sequence or if the TMS coil was not pulsing at all. Metabolite spectra from voxels closer to the TMS coil appeared noisier, and exhibited lower NAA peak areas when spectra were scaled by the water amplitude (Figure 4). The decrease in NAA peak area was more pronounced when the TMS pulse was closer to the PRESS sequence, with NAA peak area in voxels closer than 6cm to the TMS coil decreasing by 53% and 19% for pulse delays of 100ms and 200ms respectively.Discussion and Conclusion
To the best of our knowledge, this abstract presents the first application of concurrent TMS and MRS in a phantom. Initial observations demonstrated increasing B0 inhomogeneity as the MRS voxel was moved closer to the TMS coil. Linewidth increased by about 50% when the voxel centre was less than 6cm away from the TMS coil. In this initial observation, it appeared that NAA peak areas were decreased and noise fluctuations were increased in voxels closer to the TMS coil and when the TMS pulse was closer to the PRESS sequence. Future goals include investigating how eddy current effects on the MRS lineshape change with distance from the TMS coil and attempting a concurrent TMS/MRS experiment in vivo.Acknowledgements
This study was funded by Brain Canada. Erin L MacMillan receives salary support from Philips, Canada.References
1. Stagg CJ, Bestmann S, Constantinescu AO, et al. Relationship between physiological measures of excitability and levels of glutamate and GABA in the human motor cortex. J Physiol. 2011. doi:10.1113/jphysiol.2011.216978.
2. Tremblay S, Beaule V, Proulx S, et al. Relationship between transcranial magnetic stimulation measures of intracortical inhibition and spectroscopy measures of GABA and glutamate+glutamine. J Neurophysiol. 2013. doi:10.1152/jn.00704.2012.
3. Hone-Blanchet A, Salas RE, Celnik P, et al. Co-registration of magnetic resonance spectroscopy and transcranial magnetic stimulation. J Neurosci Methods. 2015. doi:10.1016/j.jneumeth.2014.12.018.
4. Perera T, George MS, Grammer G, Janicak PG, Pascual-Leone A, Wirecki TS. The Clinical TMS Society Consensus Review and Treatment Recommendations for TMS Therapy for Major Depressive Disorder. Brain Stimul. 2016. doi:10.1016/j.brs.2016.03.010.
5. Bersani FS, Minichino A, Enticott PG, et al. Deep transcranial magnetic stimulation as a treatment for psychiatric disorders: A comprehensive review. Eur Psychiatry. 2013;28(1):30-39. doi:10.1016/j.eurpsy.2012.02.006.
6. Hallett M. Transcranial Magnetic Stimulation: A Primer. Neuron. 2007;55(2):187-199. doi:10.1016/j.neuron.2007.06.026.
7. Ruff CC, Driver J, Bestmann S. Combining TMS and fMRI. Cortex. 2009. doi:10.1016/j.cortex.2008.10.012.
8. Leitao J, Thielscher A, Tunnerhoff J, Noppeney U. Concurrent TMS-fMRI Reveals Interactions between Dorsal and Ventral Attentional Systems. J Neurosci. 2015;35(32):11445-11457. doi:10.1523/JNEUROSCI.0939-15.2015.
9. Jung J, Bungert A, Bowtell R, Jackson SR. Vertex Stimulation as a Control Site for Transcranial Magnetic Stimulation: A Concurrent TMS/fMRI Study. Brain Stimul. 2016;9(1):58-64. doi:10.1016/j.brs.2015.09.008.
Figures