2260
Effects of Anaesthetic Duration and Time of Day on Metabolite Levels in Long Evans Rat1Physical Sciences Platform, Sunnybrook Research Institute, Toronto, ON, Canada, 2Medical Biophysics, University of Toronto, Toronto, ON, Canada, 3Department of Neurosurgery and Pediatric Neurosurgery, Medical University of Lublin, Lublin, Poland
Synopsis
The type and dose of anaesthesia affects both cerebral blood flow and metabolism. For experiments which involve measuring small changes in neuro-chemical levels either between groups, or following treatment, any differences in experimental conditions which increase the amount of variability can either mask or alter the results. Using 1H MRS, metabolites were quantified hourly in hippocampus and thalamus over the course of 5 hours under light isoflurane anaesthetic, in rats exposed to either a normal or a reversed light cycle. Both anaesthesia duration and light cycle had statistically significant effects on some, but not all, metabolites.
Introduction
It is well known that the type and dose of anaesthesia affects both cerebral blood flow and metabolism1–3. For experiments which involve measuring small changes in neuro-chemical levels either between groups, or following treatment, any differences in experimental conditions which increase the amount of variability can either mask or alter the results of those experiments. Quantifying the variability in metabolites based on duration of anaesthesia or time of day allows experiments to be designed for maximum sensitivity and can also improve comparison of data acquired under different experimental conditions.Methods
Male Long Evans rats, weighing 150-250 g were housed on either a normal light cycle (5 rats) with lights on from 6am until 6pm or a reverse light cycle (5 rats) with lights on from 6pm to 6am. Scanning was performed using a 7T Bruker BioSpec MRI. Anaesthesia was induced using 5% isoflurane and maintained using 0.75-2.5% isoflurane as required to sustain respiration in the range of 30-60 breaths per minute. Temperature was kept at 37°C using either water or hot air heating (SA Instruments, Stonybrook, NY). Data acquisition began between 9 and 10am, and MRS data was acquired alternately in the hippocampus and thalamus for 5 hours using a PRESS sequence with TE 16ms, TR 2.5s, 725 averages, a spectral width of 3005 Hz, RF bandwidth of 5400Hz, and 4096 complex data points. Data was analyzed using LCModel (Stephen Provencher Inc., Oakville, Ontario, Canada)4. Univariate ANOVA was used with voxel location, number of hours under anaesthetic, and light cycle as fixed factors and metabolite concentration as dependent factor.Results
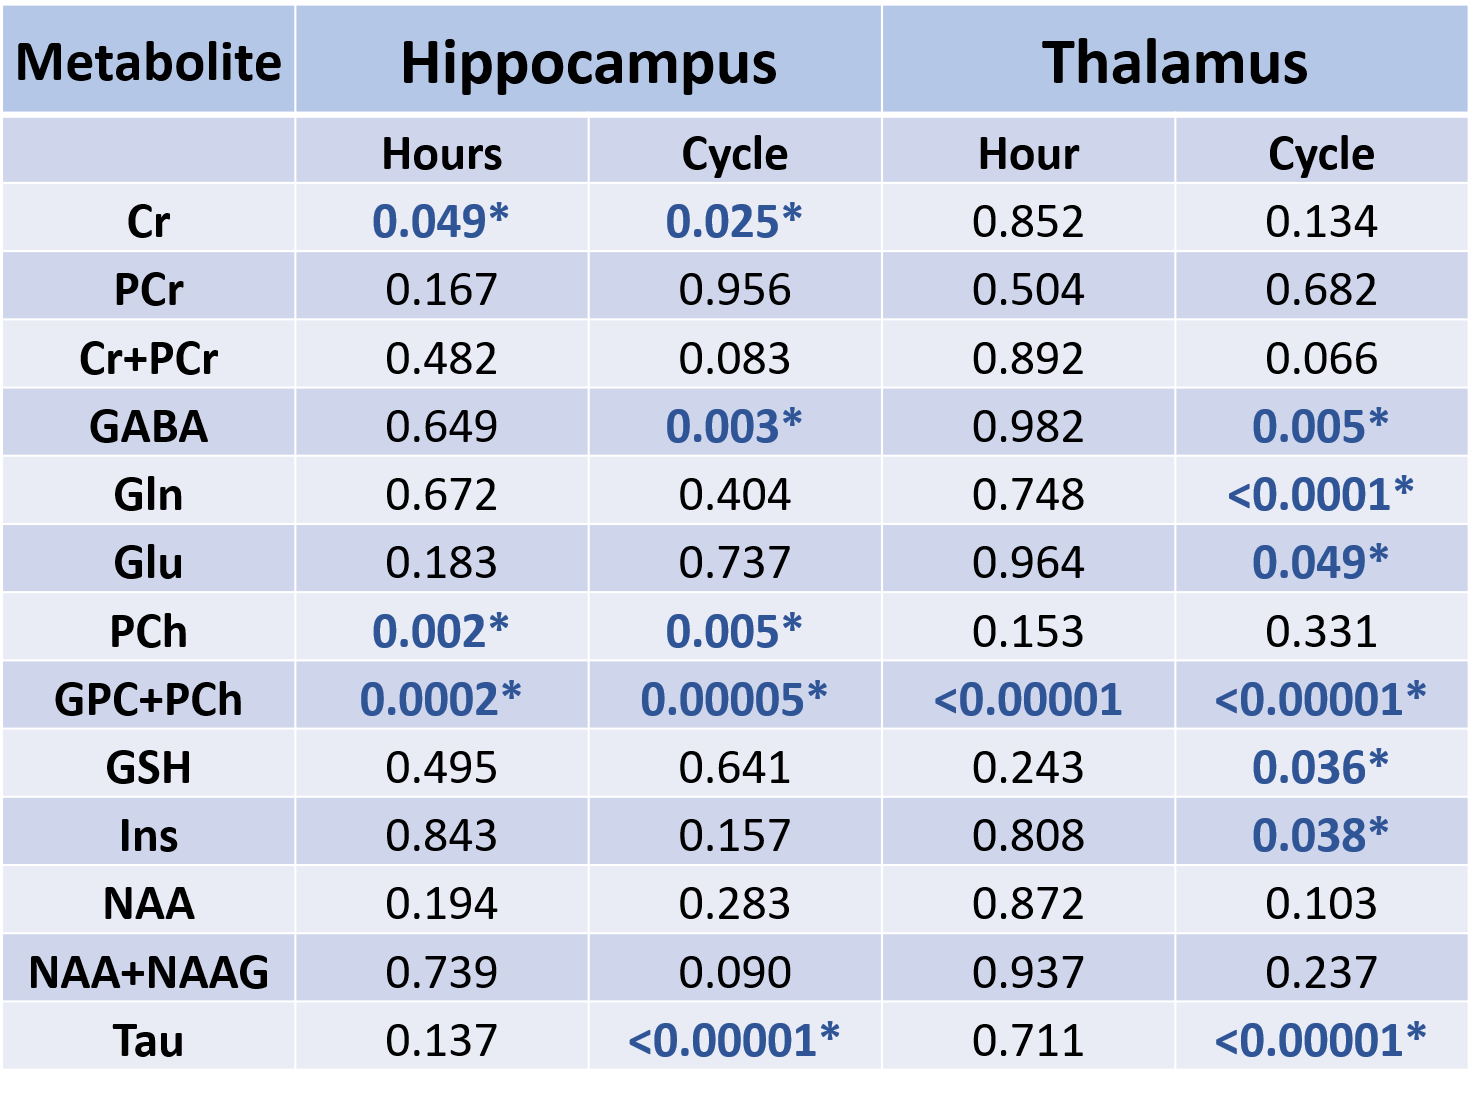
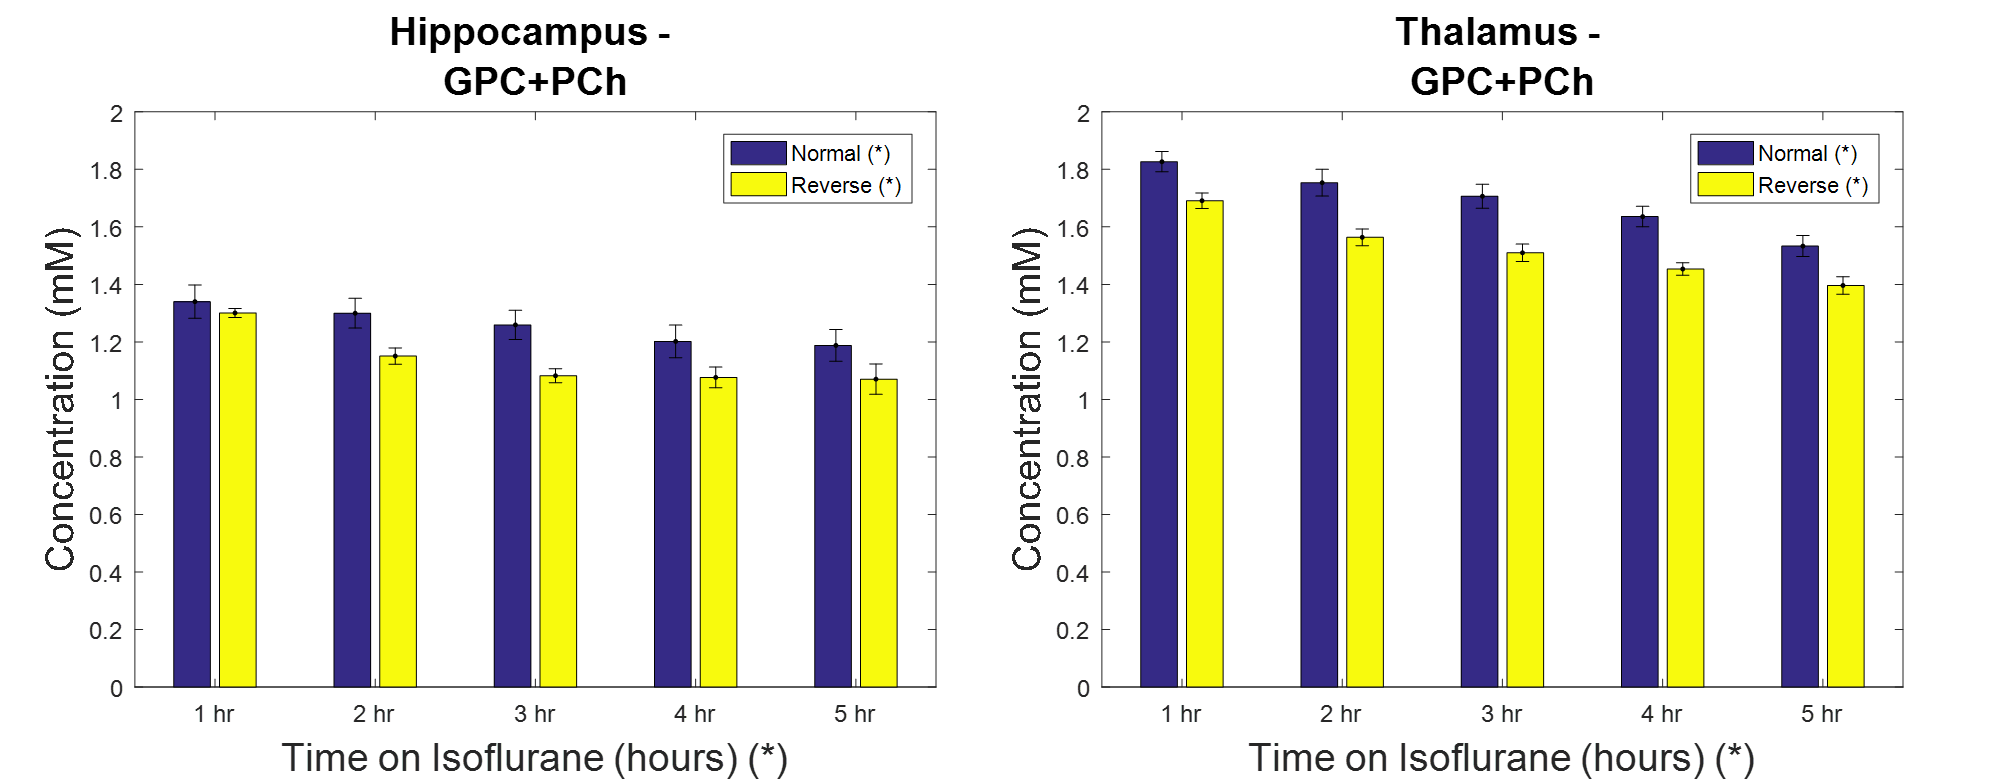
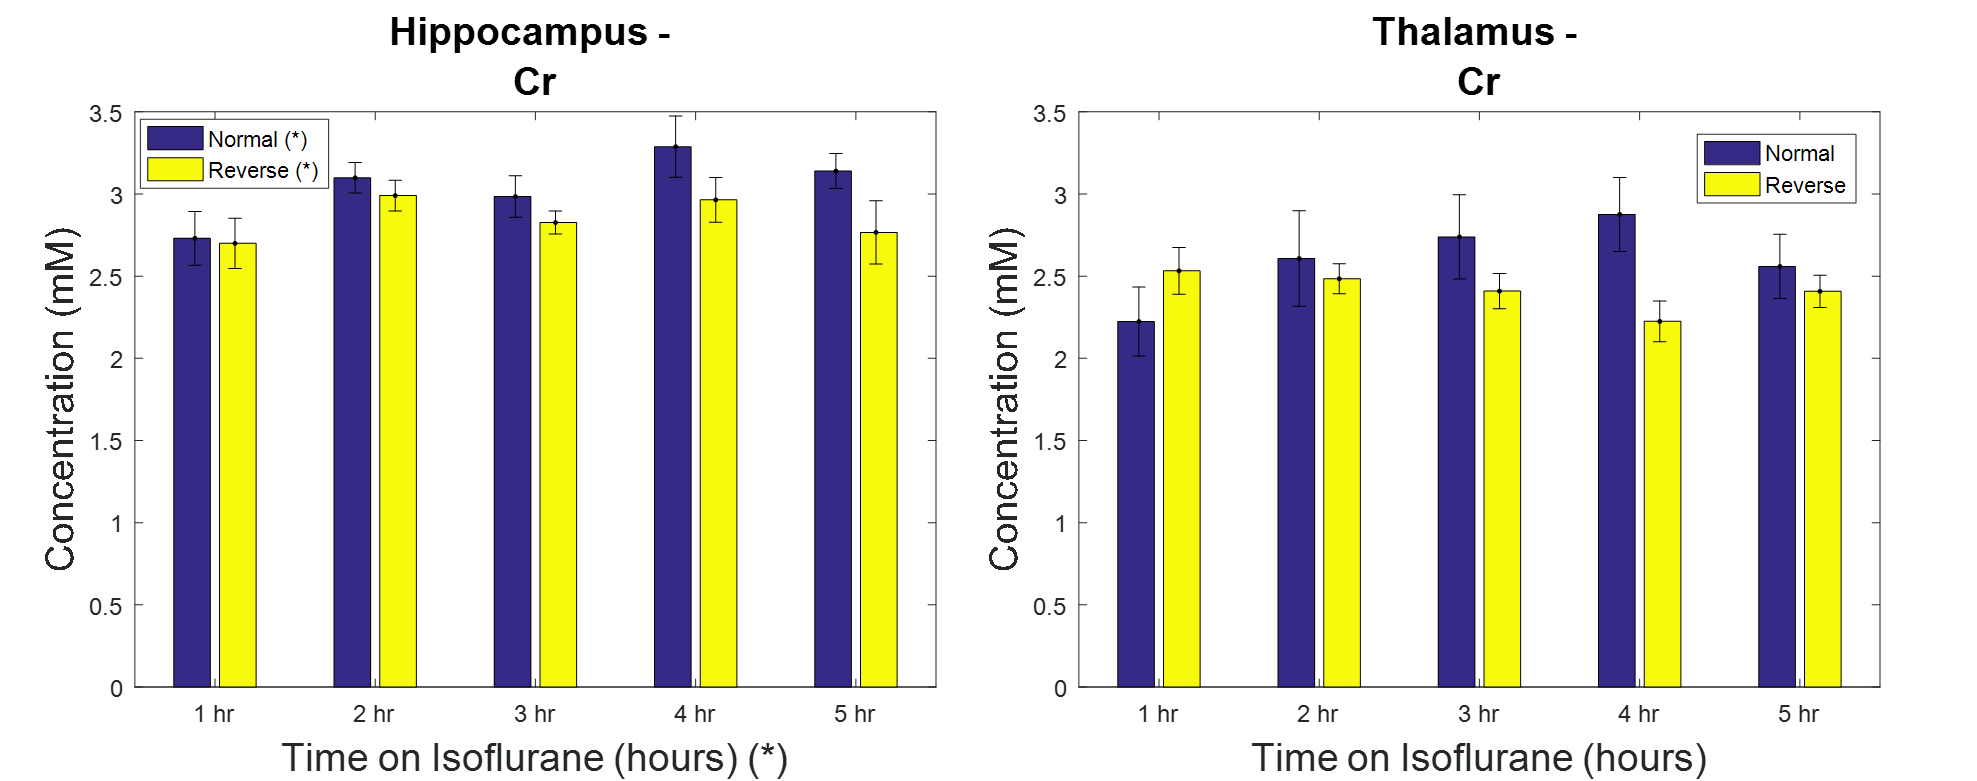
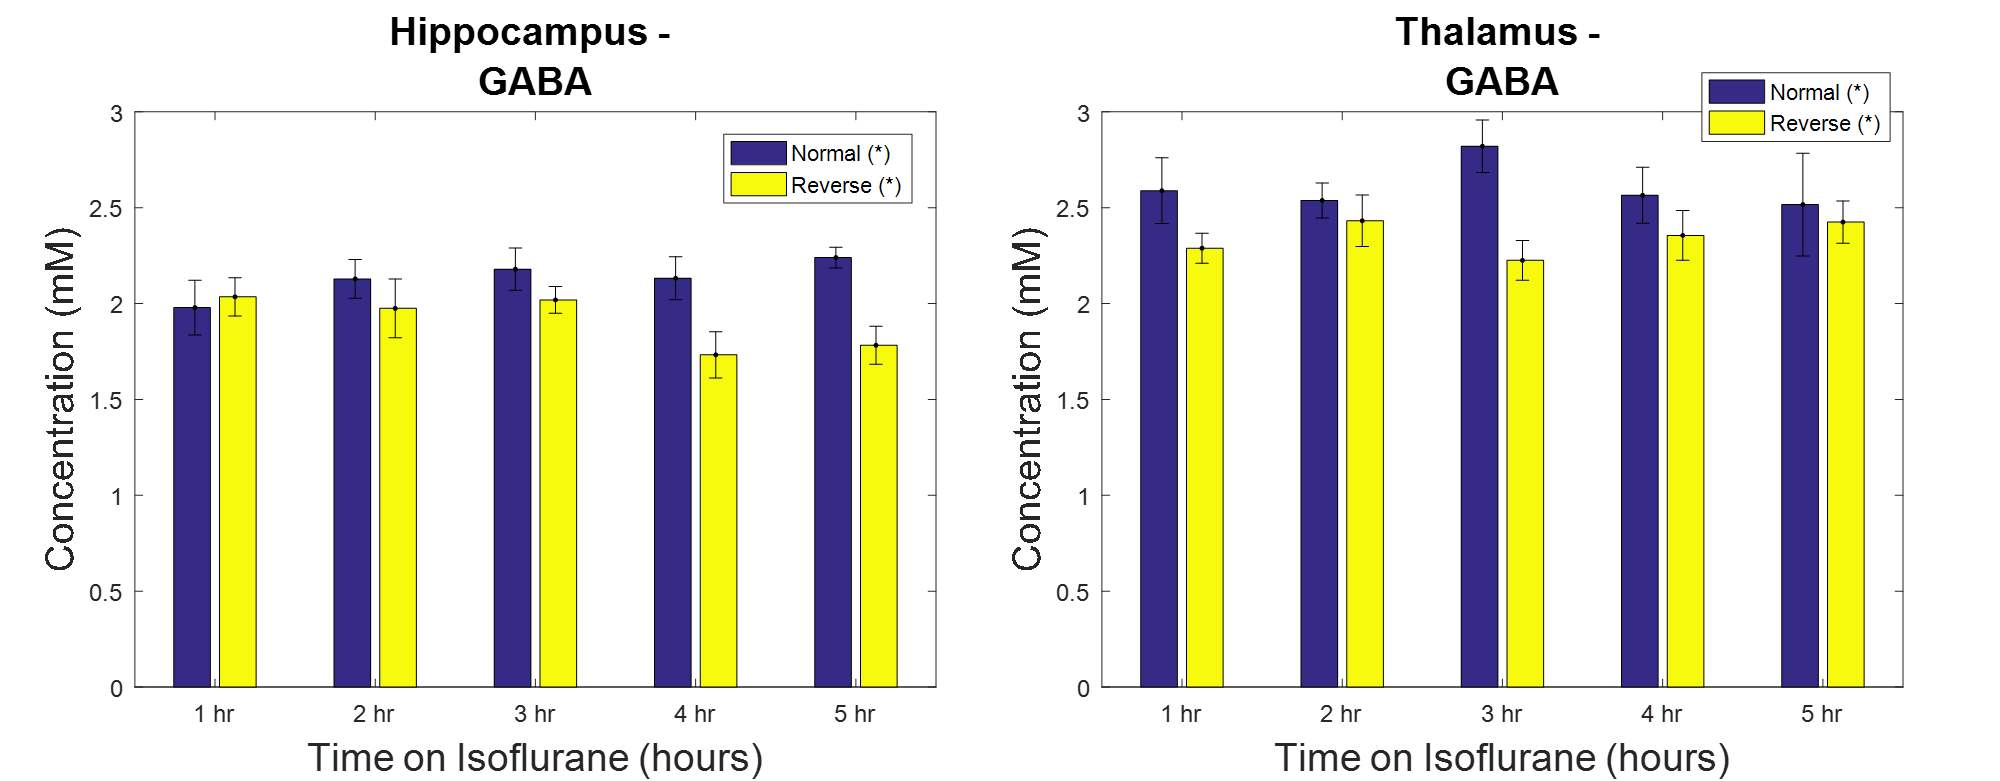
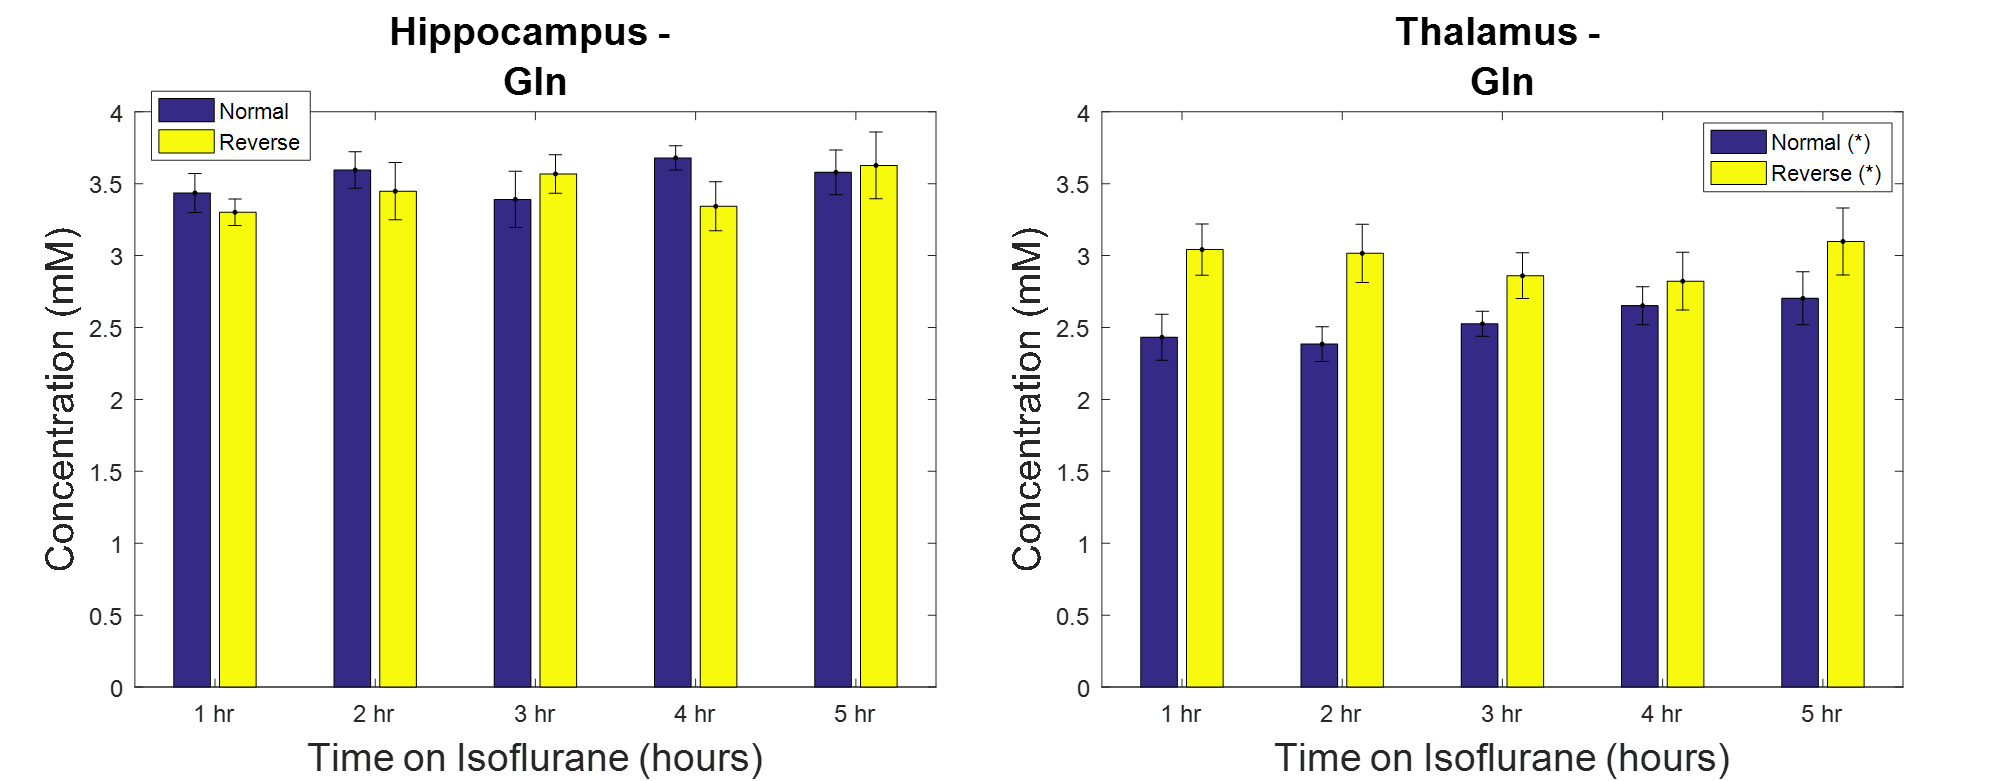
Of the 17 metabolites included in the LCModel basis set, 10 had Cramer-Rao bounds < 20% and were included in the analysis along with three metabolite combinations. Based on the ANOVA analysis, there were several metabolite concentrations which were significantly affected by either the duration of anaesthesia or light cycle (Figure 1). GPC+PCh (Figure 2) showed a linear decrease over time, with a consistent pattern in both brain regions studied. Other metabolites did not display such clear relationships to anaesthetic duration, eg. Cr (Figure 3) and GABA (Figure 4), or similarities between hippocampus and thalamus, eg. Gln (Figure 5).Discussion
Duration of anaesthetic contributed significantly to the variability in Cr and PCh in hippocampus, as well as the combination of GPC+PCh in both regions. The time of day, whether the rats were scanned during their night cycle or day cycle affected Cr, GABA, Glu, Gln, PCh, GSH, Ins, Tau, and GPC+PCh. These effects were also dependent on brain region, and while the effects were linear for GPC+PCh (Fig. 1) this was not the case for all metabolites.Conclusion
Both duration of anaesthesia and light cycle can affect the metabolite concentrations in the brain. Care must be taken when designing experiments so that these effects do not decrease the sensitivity of the experiment or lead to mistaken conclusions.Acknowledgements
No acknowledgement found.References
1. Söbbeler, F. J. et al. Effects of isoflurane, sevoflurane, propofol and alfaxalone on brain metabolism in dogs assessed by proton magnetic resonance spectroscopy ((1)H MRS). BMC Vet. Res. 14, 69 (2018).
2. Makaryus, R. et al. The metabolomic profile during isoflurane anesthesia differs from propofol anesthesia in the live rodent brain. J. Cereb. Blood Flow Metab. 31, 1432–1442 (2011).
3. Du, F. et al. In vivo proton MRS to quantify anesthetic effects of pentobarbital on cerebral metabolism and brain activity in rat. Magn. Reson. Med. 62, 1385–1393 (2009).
4. Provencher, S. W. Estimation of metabolite concentrations from localized in vivo proton NMR spectra. Magn. Reson. Med. 30, 672–679 (1993).
Figures