2259
Detection of NAD+ in human brain is possible even at 3T and in spite of water pre-saturation when using a large voxel size1University of Bern, Departments of Radiology and Biomedical Research, Bern, Switzerland, 2Center for Magnetic Resonance Research and Department of Radiology, University of Minnesota, Minneapolis, MN, United States
Synopsis
The detection of Nicotinamide adenine dinucleotide (NAD+) proved to be challenging in 1H Magnetic Resonance Spectroscopy, as standard water presaturation showed to lead to a strong suppression of NAD+ signals due to the polarization exchange between NAD+ and water. For the detection of such low-concentration metabolites, a high Signal-to-Noise-Ratio (SNR) is crucial. One possibility to increase the SNR is to choose a large voxel size (VS). In this study we show that optimizing acquisition parameters focusing on high SNR and increasing the VS to 75 cm3 allows the detection of NAD+ at 3T with a semi-LASER sequence despite water presaturation.
Introduction
Nicotinamide adenine dinucleotide (NAD+) and its reduced form NADH play an important role in the regulation of metabolism1. The detection of NAD+ and NADH, however, proved to be challenging. In 1H Magnetic Resonance Spectroscopy (MRS), standard water presaturation was shown to lead to a strong suppression of NAD+ signals due to the polarization exchange between NAD+ and water. Recently, frequency-selective excitation was proposed to overcome this issue and make in-vivo detection of NAD+ possible in human brain at 7T2,3.
For the detection of low-concentration metabolites, a high Signal-to-Noise-Ratio (SNR) is crucial. One possibility to increase the SNR is to choose a large volume of interest (VOI). In a previous study4, the optimal voxel size (VS) for such cases, which is a compromise between maximizing SNR and minimizing linewidth and outer volume artefacts, has been found to be at around 75 cm3 for the specific experimental settings in that study. Using a semi-LASER sequence5 with optimized acquisition parameters, allows recording of spectra at this VS with high SNR and high quality.
In this study we show that with this sequence and the proposed optimized experimental settings the detection of NAD+ is possible in human brain even at 3T and in spite of VAPOR water suppression.
Methods
3 healthy human volunteers (supraventricular VOI), measured on a 3T MR Scanner (Prisma, Siemens), 64 channel receive head coil, semi-LASER localization sequence5 using a sequence specific optimization process for flip angle and water suppression (VAPOR, bandwidth 135 Hz); second order shimming (manufacturer’s “Brain” mode) and partial outer-volume suppression; VS of 50x75x20 = 75 cm3; 5 measurements with 256 averages = 1280 averages; TE=35 ms; TR=2500 ms; transmit frequency set to 7.3 ppm; additional single-shot acquisition of the non-suppressed water signal for each measurement. Data processing with jmrui6 and MATLAB; fitting in FiTAID7. Simulation of semi-LASER metabolite responses in VESPA8.
Results and Discussion
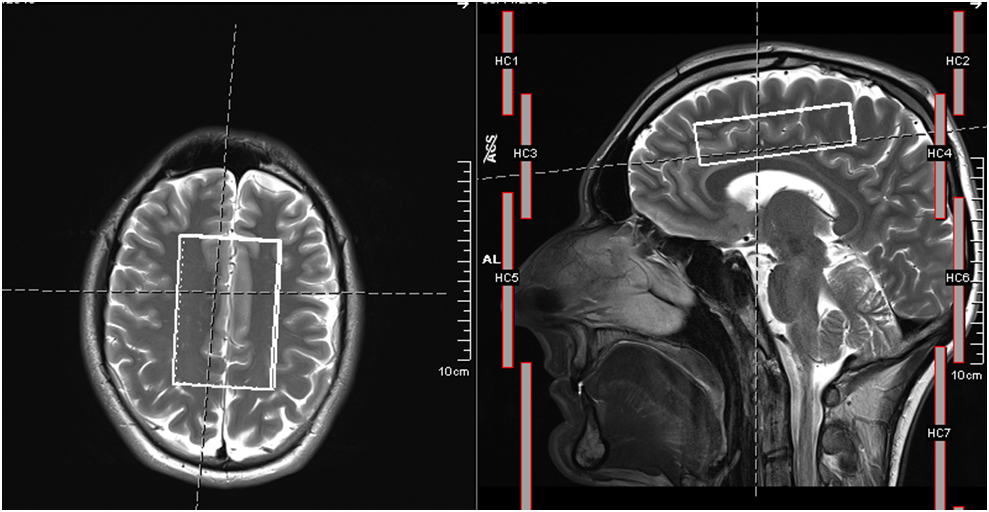
Figure 1 shows the positioning of the voxel and demonstrates the extent of the VS. In Figure 2 the spectrum at full spectral range (upfield and downfield) is presented for a representative subject, both as a single shot and after averaging of 1280 acquisitions, illustrating the high SNR that is obtained regularly using the chosen VS.
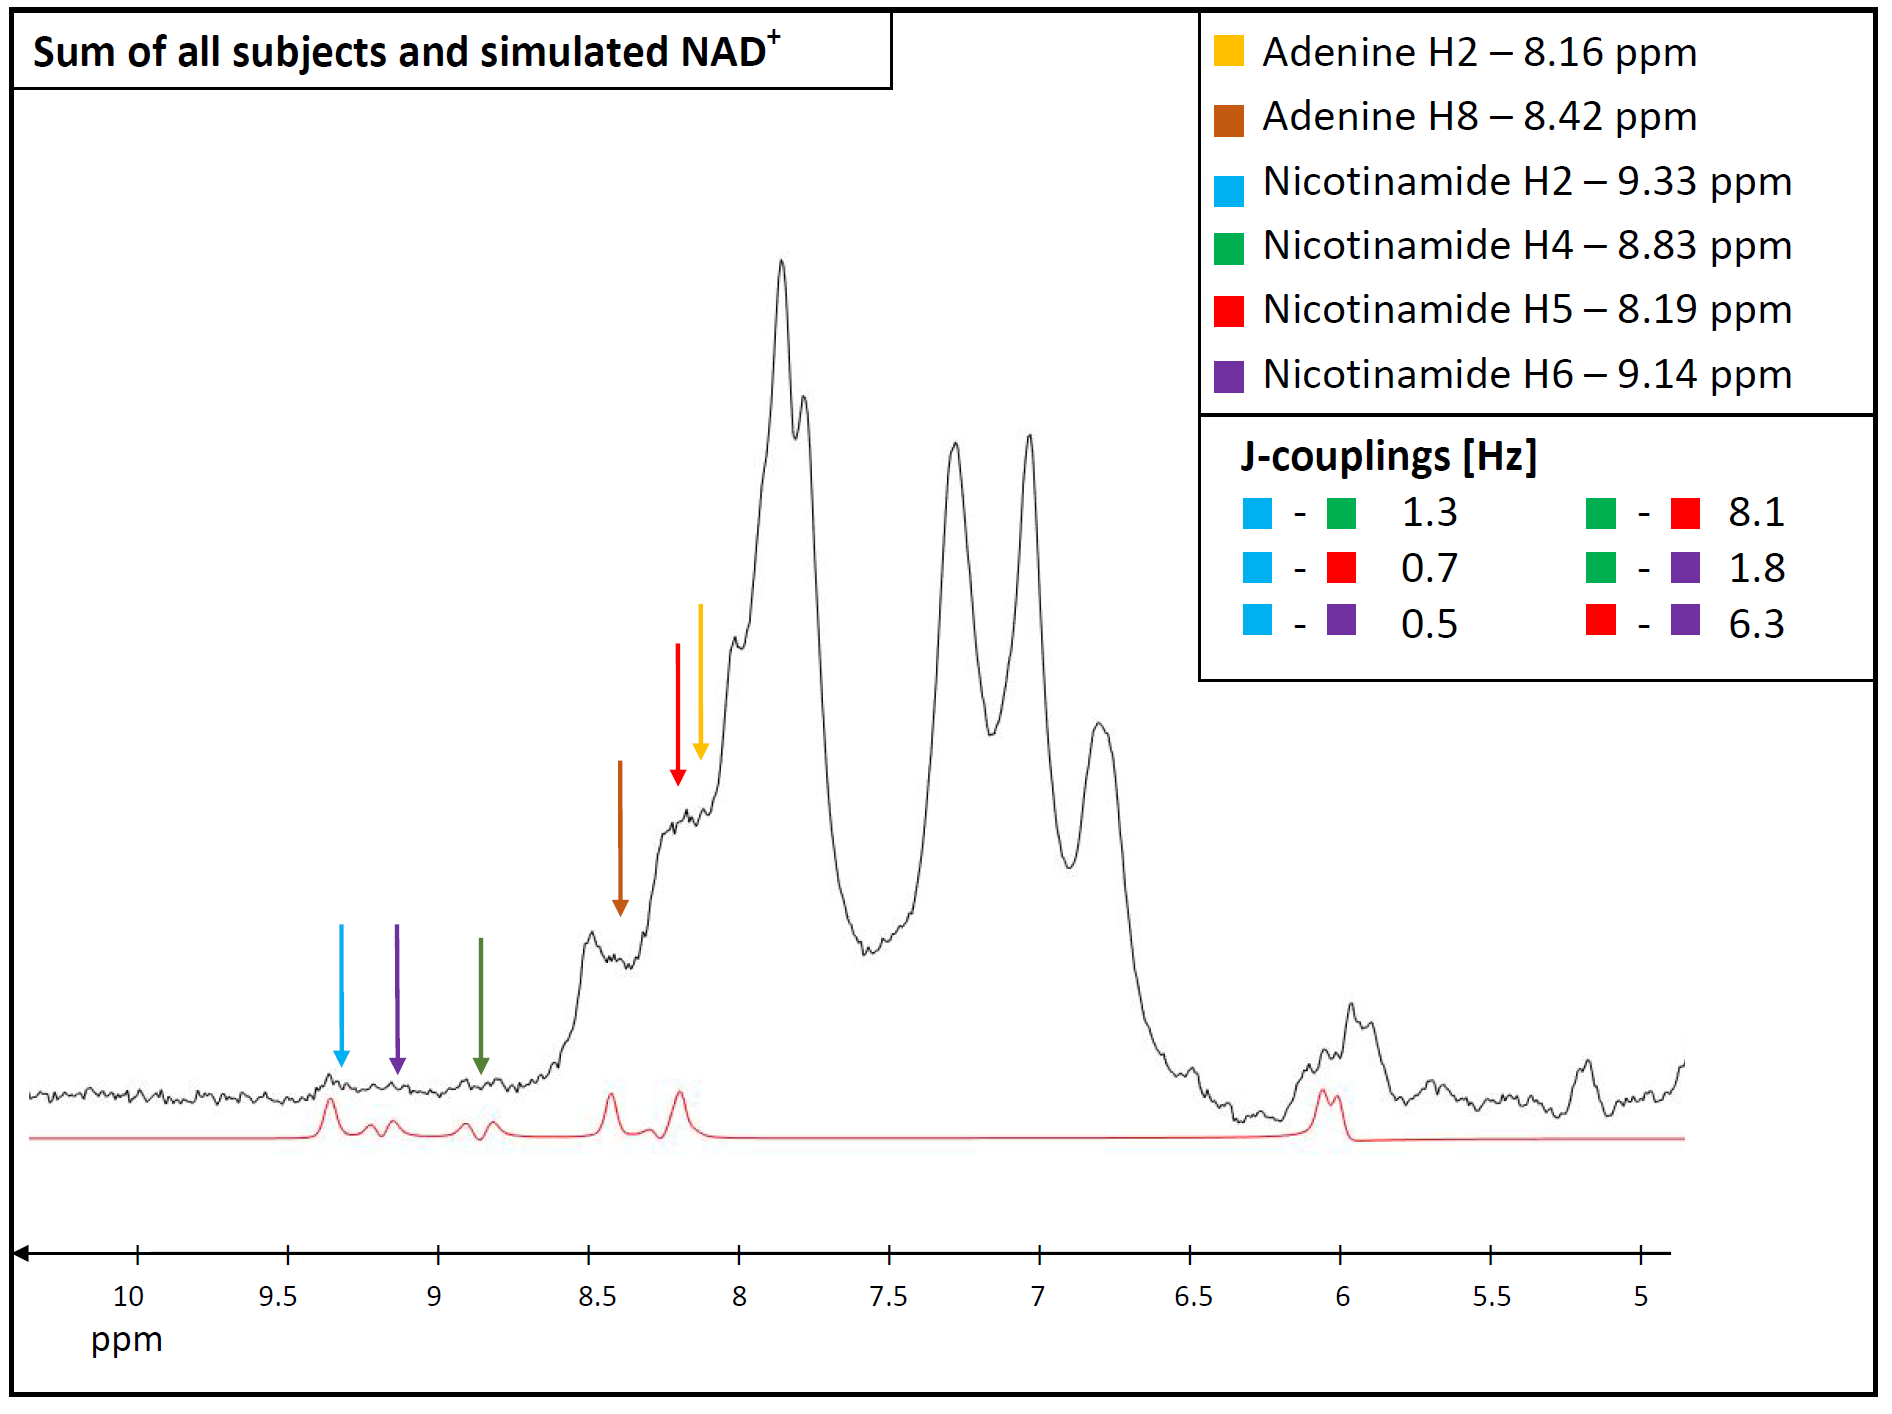
In Figure 3 the sum spectrum over all three volunteers is shown in the range between 5 and 10 ppm and compared to a simulated response of NAD+, indicating the visible peaks, including the doublet of H4 at 8.8 ppm. It is noteworthy that detection at 3T allows the unique identification of the NAD+ signal contributions by its H4 resonance as a doublet, which was unresolved in earlier studies - all from higher fields. The sum spectrum even shows spectral features that are compatible with the H5 proton and contributions from the adenine moieties – though overlapped with stronger peaks from other compounds. An overview of the known chemical shifts and couplings9 is included in Figure 3.
Figure 4 shows a preliminary approach for quantifying the finding of NAD+. The upfield part of the spectrum was fitted with simulated metabolite responses to get a reference from the amount of total creatine (tCr). The downfield part was fitted with various Voigt lines and two of them were used to fit the NAD+ doublet at 8.8 ppm, assuming the same Gaussian as well as Lorentzian broadening and therefore T2 decay as the upfield metabolites. This method yields a rough estimation for the NAD+ concentration of approximately 35 µM when assuming equal T1 and T2 effects as for upfield creatine signals. This is ~3 times lower than reported for humans2 and ~10 times lower than found for rat brain9. The underestimation is well in line with the proposed MT effect due to water presaturation and potentially short T2.
Conclusions
Optimizing acquisition parameters focusing on high SNR and increasing the VS to 75 cm3 allows the detection of NAD+ at 3T with a semi-LASER sequence despite water presaturation. A preliminary quantification of the finding was possible and showed a concentration that agrees with expectation. Further studies are necessary to confirm the results and more advanced methods are needed for correct quantification. Furthermore, it remains to be elucidated whether the MT effect is a nuisance only causing lower SNR or possibly an opportunity for sensitive detection of changes of NAD+’s microenvironment.Acknowledgements
This work is supported by the Swiss National Science Foundation (SNSF #320030‐175984).
MM and EJA acknowledge support from following National Institutes of Health grants: BTRC P41 EB015894 and P30 NS076408.
References
1. Imai, The NAD World: a new systemic regulatory network for metabolism and aging - Sirt1, systemic NAD biosynthesis, and their importance. Cell Biochem Biophys (2009) 53: 65-74
2. De Graaf et al., Detection of Cerebral NAD+ in Humans at 7T. Magn Res in Med (2017) 78: 828-835
3. Bagga et al., A new pulse sequence for single-voxel 1H MRS measurement of cerebral Nicotinamide adenine dinucleotide (NAD+) in humans at 7T using 32-channel volume coil. Proc. Intl. Soc. Mag. Reson. Med. 25 (2017) 25: #1057
4. Hoefemann et al., What is the optimal ROI size for single voxel MRS in global brain pathology? Proc. Intl. Soc. Mag. Reson. Med. (2018) 26: #1278
5. Marjanska and Auerbach, Center for Magnetic Resonance Research, University of Minnesota, USA; https://www.cmrr.umn.edu/spectro/
6. Stefan et al., Quantitation of magnetic resonance spectroscopy signals: the jMRUI software package. Measurement Science & Technology (2009) 20: 104035
7. Chong et al., Two-dimensional linear-combination model fitting of magnetic resonance spectra to define the macromolecule baseline using FiTAID, a Fitting Tool for Arrays of Interrelated Datasets. Magn Reson Mater Phy (2011) 24: 147-164
8. Smith et al., Computer Simulations in Magnetic Resonance. An Object-Oriented Programming Approach. J Magn Reson (1994) 106: 75-105
9. De Graaf et al., Detection of cerebral NAD+ by in vivo 1H NMR spectroscopy. NMR in Biomedicine (2014) 27: 802-809
Figures