2258
Behavior of the signal components of collagen solutions in vitro using UTE-MRI and MRS sequences1Section on Experimental Radiology, University Hospital of Tübingen, Tuebingen, Germany, 2Department of Internal Medicine, University Hospital of Tübingen, Tuebingen, Germany, 3Application Development, Siemens Healthcare GmbH, Erlangen, Germany
Synopsis
Collagen is a protein physiologically abundant in cartilage, tendons, and ligaments. Pathological processes in many organs might lead to accumulation of collagen in the extracellular space (eg, in hepatic, muscular or renal fibrosis), and non-invasive assessment of fibrotic changes in parenchyma is of high clinical interest. Ultrashort echo-time (UTE) sequences provide direct assessment of the fast decaying signals of collagen. In this work collagen solutions were analyzed in vitro with inversion recovery FID and spin echo spectroscopy sequences to get a better understanding of the different spectral components of collagen signals and their behavior using a 3T whole-body scanner.
Introduction and purpose
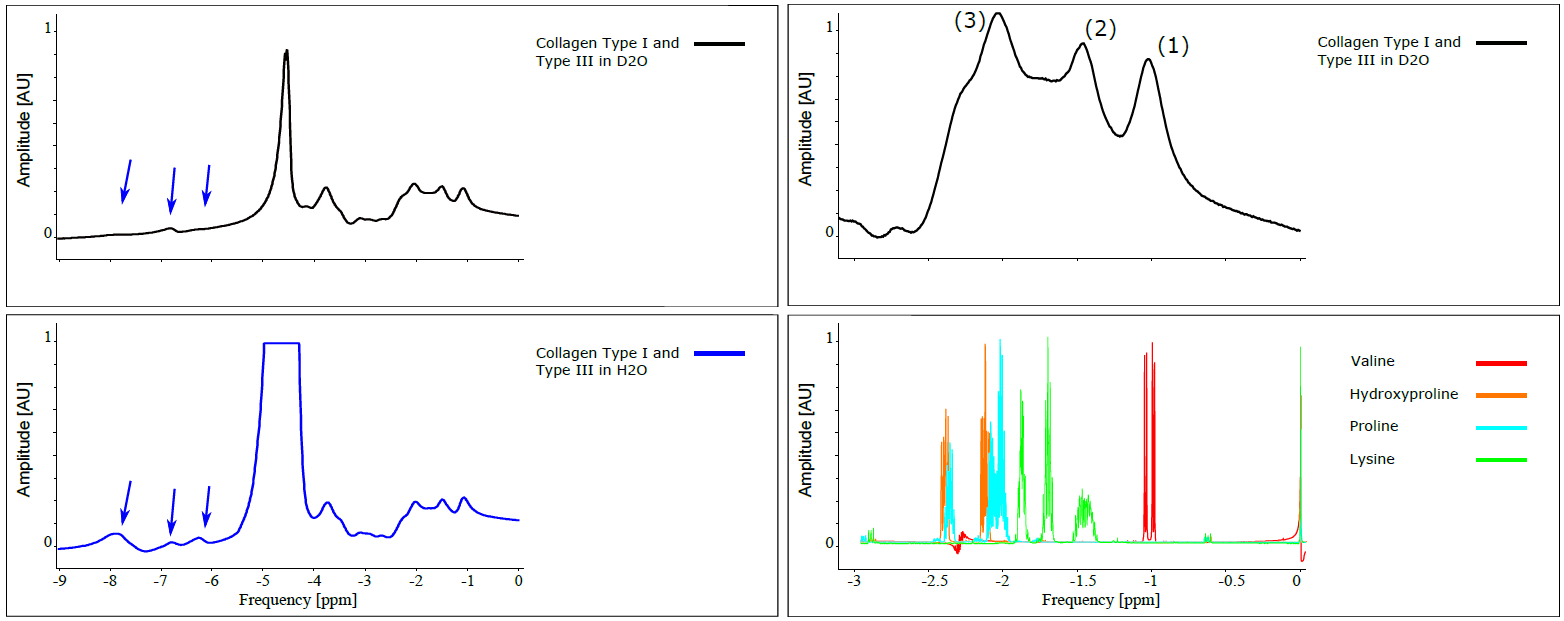
Collagen is one of the most abundant proteins in the human body. It is found in the extracellular matrix (ECM) of all tissues and in high concentration in tendons, ligaments and cartilage. Many chronic organ diseases cause a remodeling of the ECM with an increased fiber deposition (fibrosis). Degenerative changes in collagenous tissues as tendons could also change the spatial arrangement and reduce the amount of fibers. Tissues with high collagen concentrations show short T2 values and therefore nearly lacking signal intensity in images recorded by conventional MRI sequences. The development of UTE sequences makes it possible to directly measure fast decaying collagen signals1. However, the signal behavior of collagen is convoluted (Fig.1) due to contributions in a wide range of chemical shifts2. Furthermore, it is not fully clear, which signal portions originate from protons with permanent chemical bonds and which are exchangeable with protons from the surrounding solvent.
The aim of this work was to measure T1 relaxation times and echo-time dependent signal yield of different collagen components in vitro by using UTE imaging and non-selectiove spectroscopic sequences.
Methods
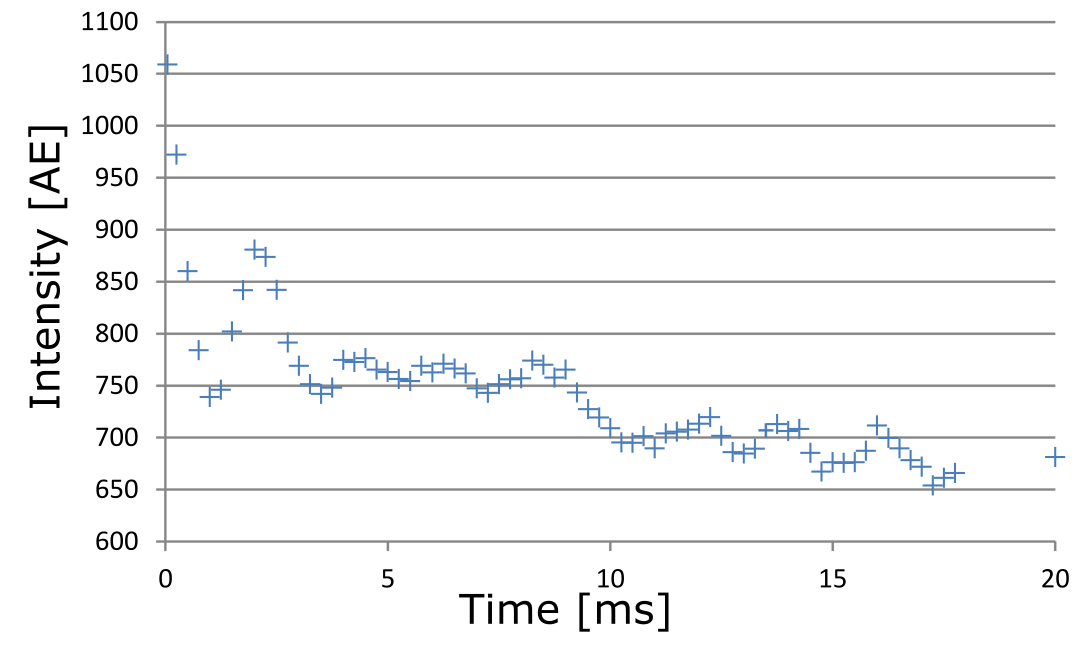
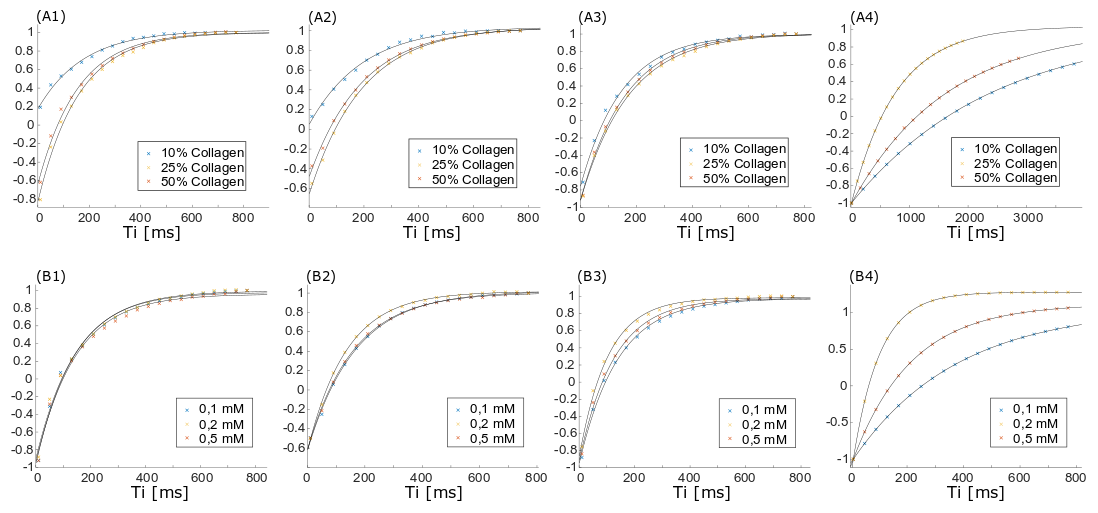
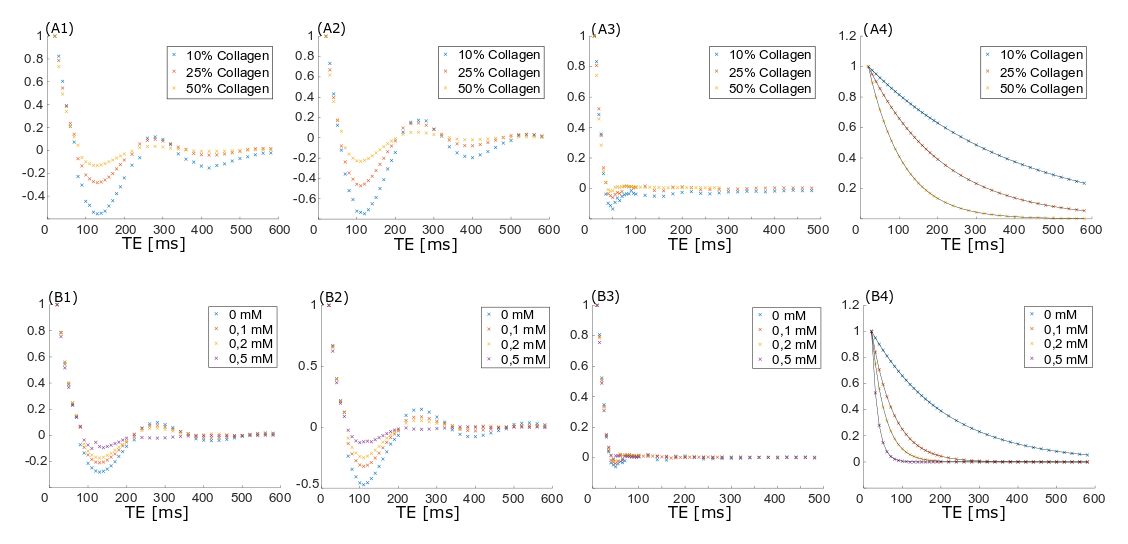
Measurements were performed on a clinical 3T MR scanner (MAGNETOM Prismafit, Siemens Healthcare, Erlangen, Germany) using a 15-channel transmit-receive knee coil. For phantom preparation, commercially available, powdered, bovine collagen Type I and Type III (NeoCell Super Collagen Type I and III Powder, NeoCell, Irvine, CA, USA) was dissolved in H2O, D2O and MnCl2 solutions ranging from 0 to 0.5 mM. MnCl2 was used to change the T1 and T2 times of the free water without contributing to the measured spectra. The collagen solutions (10-50%) were placed inside a plastic sphere in the isocenter of the scanner. The overall signal magnitude was measured using a prototype UTE Spiral Vibe sequence with a minimal TE of 0.05 ms, TR of 22 ms, 136 spiral interleaves with a spiral readout duration of 1120µs, a 0.8 mm isotropic resolution and flip angle of 5°. T1 relaxation times of different spectral components were measured using an inversion recovery FID spectroscopy sequence. Transverse signal decay was assessed using a non-selective spin-echo spectroscopy sequence. The signal was acquired by both sequences using a readout time of 512ms and a vector size of 2048. Series of variable TI (10-4000ms) and TE (4-600ms) were used for measuring T1 and the transverse signal decay, respectively, of the three major spectral components separately. The data was analyzed using jMRUI3,4 and Matlab (MathWorks, Natick, MA, USA). Since the different components in collagen spectra could not be fully resolved, the measurable maximum signal amplitude was used (instead of the integral) for quantitative evaluations (as indicated in Figure 2, top right).Results
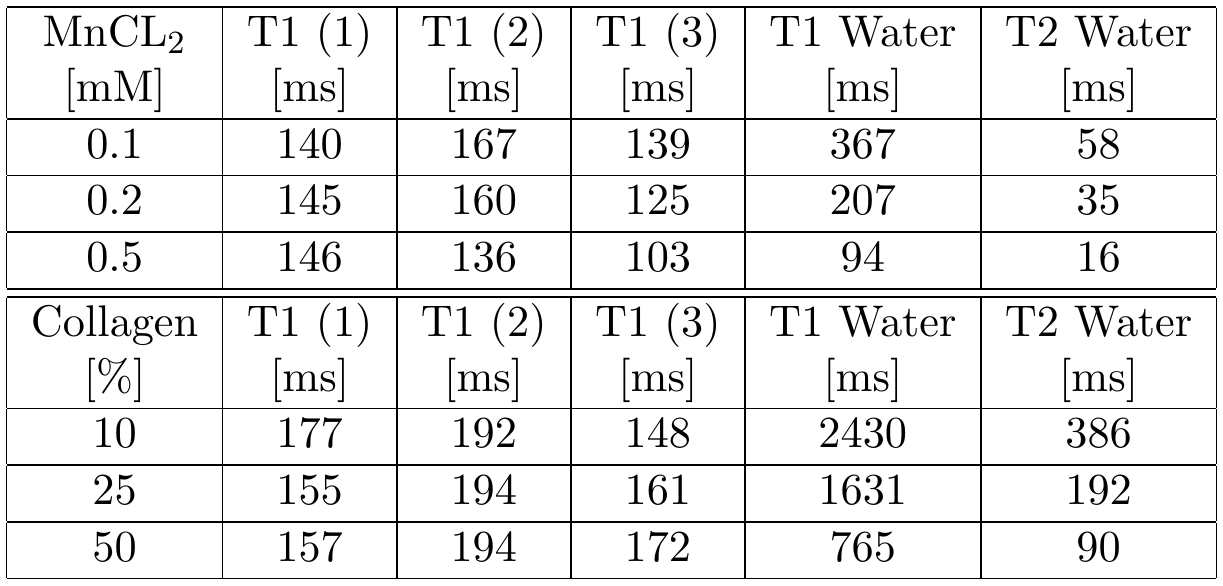
The measured signal components of the collagen solution agree well with chemical shift components of single amino acids (Fig.2) contained in collagen. When D2O is used as a solvent, the collagen signals downfield of the water signal decrease or disappear completely while the three major signal components upfield the water remain unchanged (Fig.2). The T1 and T2 times of the solvent water decrease with increasing collagen and MnCl2 concentration (Tab.1). T1 of the three major collagen signal components shows no correlation with the MnCl2 concentration or collagen concentration (Fig.3). Determination of T2 values of collagen signals is strongly affected by distinct J-coupling effects (Fig.4). The signal portion closest to water (3) shows a fast and almost linear decay. The two other signal portions ((1) and (2)) oscillate with a frequency of approx. 4 Hz in the time domain when using a spin echo sequence. The decay of the oscillating signals of all components was found faster with increasing collagen and MnCl2 concentration while the frequency of the oscillation remained constant.Discussion
The signal contributions upfield of water remained unchanged in the spectrum when changing the solvent from H2O to D2O. These signals originate from the aliphatic protons of the amino acids. The signal contributions downfield of water partly disappear when using D2O as solvent and therefore those signals probably originate in exchangeable protons of Amine/Amide, and OH groups. Echo time dependent signal amplitudes partly oscillate due to J-coupling effects. Since collagen is considered a complex J-coupled spin system analytical assessment of all signal contributions and their characteristics are quite difficult. Thus, the experimental approach might be helpful to develop strategies for specific assessment of fibrotic tissue in vivo. For this purpose it is necessary to distinguish collagen related signal contributions and other signal components of tissue (mainly water and lipids).Acknowledgements
No acknowledgement found.References
1: Siu, AG, Ramadeen, A, Hu, X, Morikawa, L, Zhang, L, Lau, JYC, Liu, G, Pop, M, Connelly, KA, Dorian, P, and Wright, GA (2015), Characterization of the ultrashort‐TE (UTE) MR collagen signal. NMR Biomed., 28, 1236–1244. doi: 10.1002/nbm.3372.
2. Kaflak-Hachulska A, Samoson A, Kolodziejski W. 1H MAS and 1H→31P CP/MAS NMR study of human bone mineral. Calcified Tissue Int. 2003; 73: 476–486.
3: Naressi, A.; Couturier, C.; Devos, J. M.; Janssen, M.; Mangeat, C.; Beer, R. d. & Graveron-Demilly, D. (2001), ‘Java-based graphical user interface for the MRUI quantitation package’, Magma: Magnetic Resonance Materials in Physics, Biology, and Medicine 12(2-3), 141–152.
4: Stefan, D.; Cesare, F. D.; Andrasescu, A.; Popa, E.; Lazariev, A.; Vescovo, E.; Strbak, O.; Williams, S.; Starcuk, Z.; Cabanas, M.; van Ormondt, D. & Graveron-Demilly, D. (2009), ‘Quantitation of magnetic resonance spectroscopy signals: the jMRUI software package’, Measurement Science and Technology 20(10), 104035.
5: Wishart DS, Feunang YD, Marcu A, Guo AC, Liang K, et al., HMDB 4.0 — The Human Metabolome Database for 2018. Nucleic Acids Res. 2018. Jan 4;46(D1):D608-17. http://www.hmdb.ca/
Figures