2256
Detecting contaminants with long T2 relaxation time at 3 ppm in the human brain using the novel antiphase J difference editing method implemented in proton MRS at 7T1Erwin L. Hahn Institute for Magnetic Resonance Imaging, Essen, Germany, 2Donders Institute for Brain, Cognition and Behavior, Nijmegen, Netherlands
Synopsis
In proton spectroscopy there are reports of macro-molecules (MM) in mobile form and therefore with long T2 relaxation time in the literature. Using the novel antiphase editing technique, we demonstrate the contribution of such contaminants to J-difference edited spectra at 3ppm, with implications for editing GABA.
Introduction
The J editing1 or MEGA editing2 method is currently the most popular technique for measuring GABA. It is known that the 3ppm signal measured with this technique can be severely contaminated by macromolecules (MM)1,3-5 which are estimated in the literature to be 40-60%1,6 of the total signal. Behar et al investigated MMs in rat7 and human8 brain but their investigation was limited to short T2 MMs. The assumption that all MM have a short T2 is however not necessarily true. Choi et al9 found evidence for a long T2 contaminant at 3ppm which was assigned to mobile MMs. MEGA is limited to fixed multiples of TE = 68 ms which hinders the possibility of using long editing pulses with narrow enough bandwidths to avoid inverting the well-known contributing MM at 1.7ppm. With the antiphase editing method however, we can use narrow bandwidth long editing pulse to avoid inverting 1.7ppm MM and therefore we can use this approach to investigate the 3ppm edited signal at long TEs. The capability to use narrow bandwidth editing pulses also brings the possibility of editing both 2.28ppm and 3ppm GABA signals simultaneously.Methods
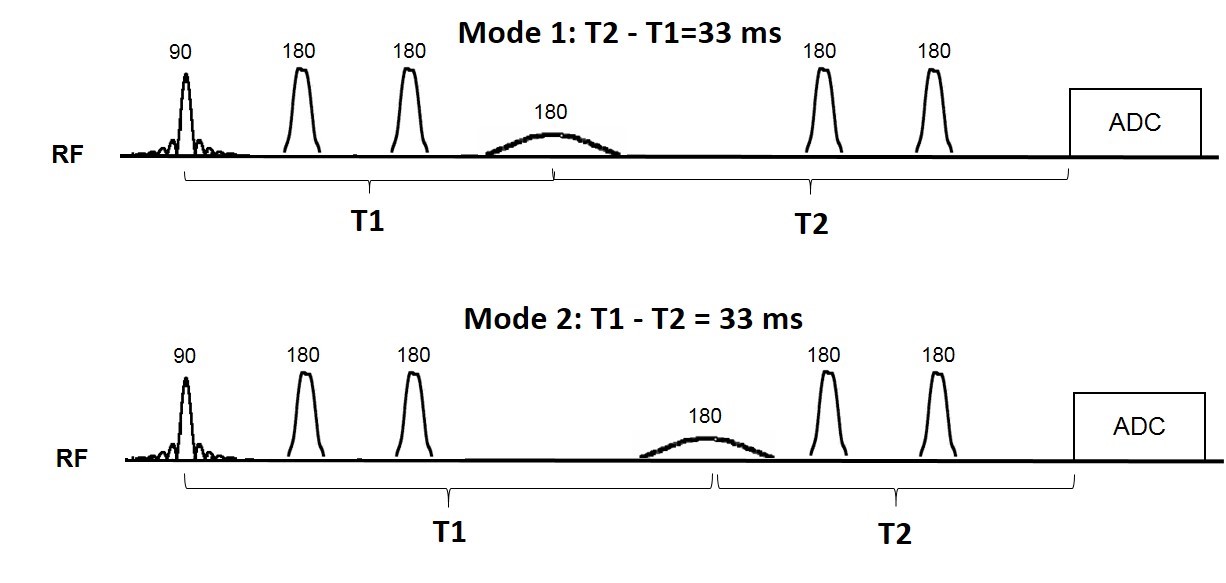
sequence implementation: The antiphase editing method was implemented in a sLASER sequence at 7T (Figure 1). The editing timing condition for the two modes needed to edit the 3ppm signal is shown in the figure. Under these conditions, the method preserves the two side peaks of GABA in antiphase compared to MEGA which is an in-phase technique. We performed two sets of measurements to investigate the antiphase edited 3ppm signal. In one set of measurements we applied the narrow bandwidth editing pulse (BW=36Hz) at 1.7ppm. In another set of measurements, we applied the narrow bandwidth editing pulse (BW=36Hz) at 1.9ppm. In total, 4 healthy subjects (2 female; age 27.2±4.6years) participated in this study with approval from the local ethics committee. An anatomical reference image was acquired using 3D MPRAGE10. B0 shimming was performed using FASTESTMAP11. Spectra were acquired from a 30x30x30 mm3 voxel placed in the medial occipital region using the antiphase editing sequence at TEs 195, 225 and 255ms (TR=4500 ms,NEX=64,scan time=5:06mins). Data were analyzed using JMRUI12 and MATLAB (version 2016b, Natick,MA).Results
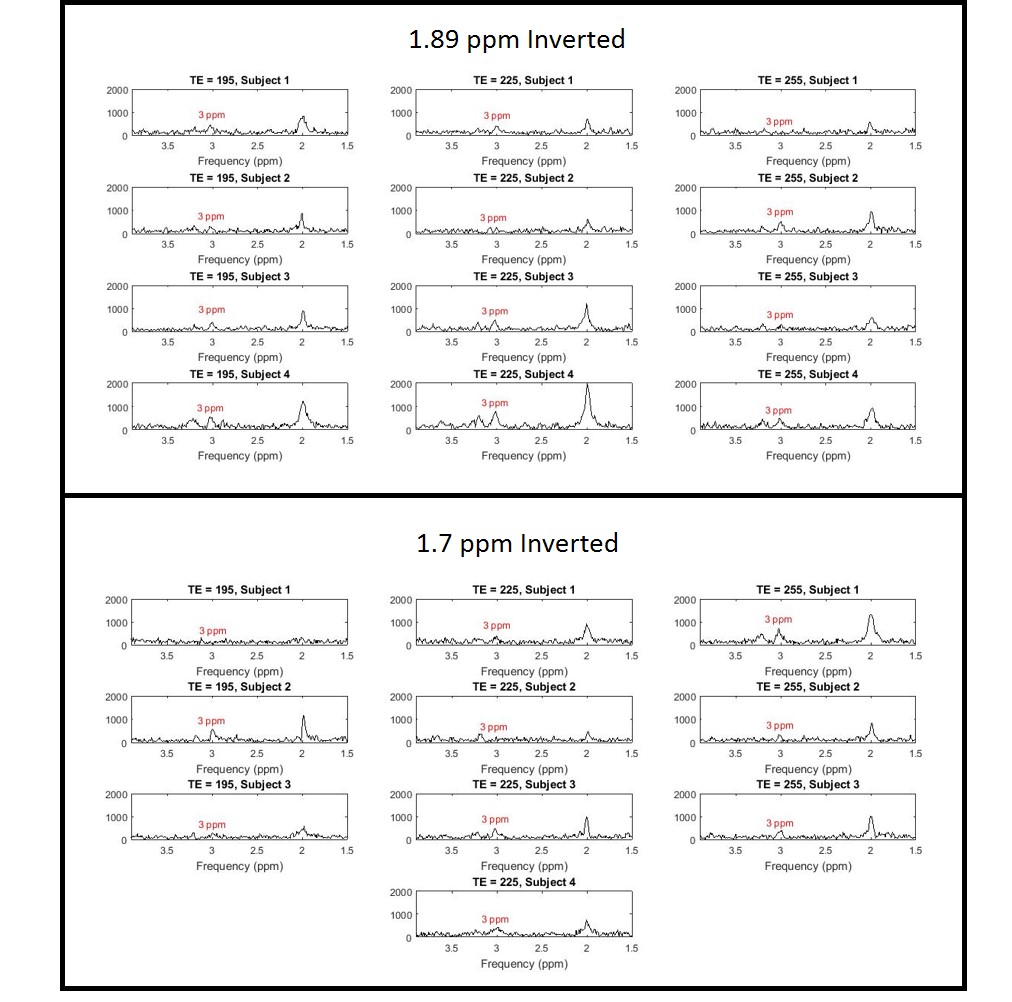
Antiphase edited spectra are shown in Figure 2. Both measurements gave an edited signal at 3ppm with no coedited signal at 2.28ppm. There is also a 2ppm coedited signal in the edited spectra for both conditions.Discussion
In the antiphase edited spectra, we assign the 3ppm edited signal measured by inverting at 1.7ppm to a contaminant, presumably mobile MM with a long T2 relaxation time coupled to 1.7ppm as investigated previously. This is consistent with and supports the finding of Choi et al9. Furthermore, in the second set of measurements where we inverted at 1.89ppm, the well-known coupled MM signal at 1.7ppm is not inverted, and its coupling partner will not contribute to the 3ppm edited signal. It is important here to note that the GABA peak at 2.28ppm is absent in the spectra. If the observed signal at 3ppm in this set of measurements would have a significant contribution of GABA, then coedited GABA at 2.28ppm should be visible with a similar intensity, under the assumption that the two lines have similar T2 values. This is because the editing pulse is so narrow (BW=36Hz) that it does not invert the coupled GABA peak at 2.28ppm as commonly happens in standard MEGA. Thus, the absence of a 2.28ppm signal suggests that the measured 3ppm signal is not GABA. In fact, the result when applying the editing pulse at 1.89ppm presented here suggests the hypothesis of a contaminant at 1.89ppm in vivo coupled to a partner at 3ppm. In comparison, the 2D COSY spectrum presented by Behar et al in human brain8 was obtained from an extensively dialyzed brain tissue sample. Therefore, contaminants in mobile form would have been removed. Finally, the 2ppm signals coedited in both sets of measurements need further investigation but primarily and tentatively could be assigned to Glu7 (when 1.89ppm inverted) and proline13 (when 1.7ppm inverted).Acknowledgements
This work was funded by the Helmholtz Alliance ICEMED – Imaging and Curing Environmental Metabolic Diseases, through the Initiative and Networking Fund of the Helmholtz Association.References
1. Rothman DL, Petroff OA, Behar KL, Mattson RH. Localized 1H NMR measurements of gamma-aminobutyric acid in human brain in vivo. Proc Natl Acad Sci U S A. 1993;90(12):5662-6
2. Mescher M, Merkle H, Kirsch J, Garwood M, Gruetter R. Simultaneous in vivo spectral editing and water suppression. NMR Biomed. 1998;11(6):266-72.
3. Edden RA, Puts NA, Barker PB. Macromolecule-suppressed GABA-edited magnetic resonance spectroscopy at 3T. Magn Reson Med. 2012;68(3):657-61.
4. Gu M, Hurd R, Noeske R, Baltusis L, Hancock R, Sacchet MD, et al. GABA editing with macromolecule suppression using an improved MEGA-SPECIAL sequence. Magn Reson Med. 2018;79(1):41-7.
5. Henry PG, Dautry C, Hantraye P, Bloch G. Brain GABA editing without macromolecule contamination. Magn Reson Med. 2001;45(3):517-20. 6. Shungu DC, Mao X, Gonzales R, Soones TN, Dyke JP, van der Veen JW, et al. Brain gamma-aminobutyric acid (GABA) detection in vivo with the J-editing (1) H MRS technique: a comprehensive methodological evaluation of sensitivity enhancement, macromolecule contamination and test-retest reliability. NMR Biomed. 2016;29(7):932-42.
7. Behar KL, Ogino T. Characterization of macromolecule resonances in the 1H NMR spectrum of rat brain. Magn Reson Med. 1993;30(1):38-44.
8. Behar KL, Rothman DL, Spencer DD, Petroff OA. Analysis of macromolecule resonances in 1H NMR spectra of human brain. Magn Reson Med. 1994;32(3):294-302.
9. Choi C, Bhardwaj PP, Kalra S, Casault CA, Yasmin US, Allen PS, et al. Measurement of GABA and contaminants in gray and white matter in human brain in vivo. Magn Reson Med. 2007;58(1):27-33.
10. Mugler JP, 3rd, Brookeman JR. Three-dimensional magnetization-prepared rapid gradient-echo imaging (3D MP RAGE). Magn Reson Med. 1990;15(1):152-7.
11. Gruetter R, Tkac I. Field mapping without reference scan using asymmetric echo-planar techniques. Magn Reson Med. 2000;43(2):319-23.
12. Naressi A, Couturier C, Devos JM, Janssen M, Mangeat C, de Beer R, et al. Java-based graphical user interface for the MRUI quantitation package. Magn Reson Mater Phy. 2001;12(2-3):141-52.
13. Pogliani L, Ellenberger M, Valat J, Bellocq AM. NMR investigations of proline and its derivatives. 4-Proton magnetic resonance parameters and structure of acetyl-proline amide. Int J Pept Protein Res. 1975;7(5):345-60.
Figures