2254
Functional Magnetic Resonance Spectroscopy of response inhibition1Amsterdam University Medical Center, University of Amsterdam, Amsterdam, Netherlands, 2Amsterdam Neuroscience, Amsterdam, Netherlands, 3University Medical Center Utrecht, Utrecht, Netherlands, 4Amsterdam University Medical Center, Vrije Universiteit, Amsterdam, Netherlands, 5Spinoza Centre for Neuroimaging, Royal Netherlands Academy of Arts and Sciences (KNAW), Amsterdam, Netherlands
Synopsis
Ten volunteers performed a Go/NoGo task during MRS acquisition at 7T to assess if event-related fMRS could detect dynamic glutamate changes during response inhibition. Metabolite spectra were acquired using a semiLASER sequence (to assess task-induced fluctuations in glutamate and lactate) and were interleaved with water-unsuppressed spectra (to assess the BOLD response-induced water linewidth changes). The voxel was placed in the dorsomedial prefrontal cortex. Although an fMRI pilot confirmed the voxel location, no significant differences in metabolite concentrations or water amplitude between NoGo and Go trials was detected.
Introduction
1H-MRS has demonstrated abnormalities in static glutamate (Glu) concentrations in a number of psychiatric disorders, including obsessive compulsive disorder (OCD). However, dynamic glutamate measurements using functional MRS (fMRS) could potentially provide novel insights into glutamate signalling during task performance. FMRS using long block designs of motor and visual stimuli has provided great insight into neuronal metabolism during neuronal activation of these sensory areas (e.g.1). Subsequently, it was suggested that fMRS could also be applied to study much quicker changes in metabolite concentrations (e.g. indicative of glutamate/glutamine (Glu/Gln) cycling) using event-related designs2,3. Given that response inhibition problems are implicated in a number of psychiatric disorders, including OCD, we here assessed in a pilot study whether event-related fMRS could detect dynamic glutamate changes during response inhibition at 7T. We hypothesized increased water amplitude (representing the BOLD effect) and increased Glu and lactate (Lac) concentrations during response inhibition.Methods
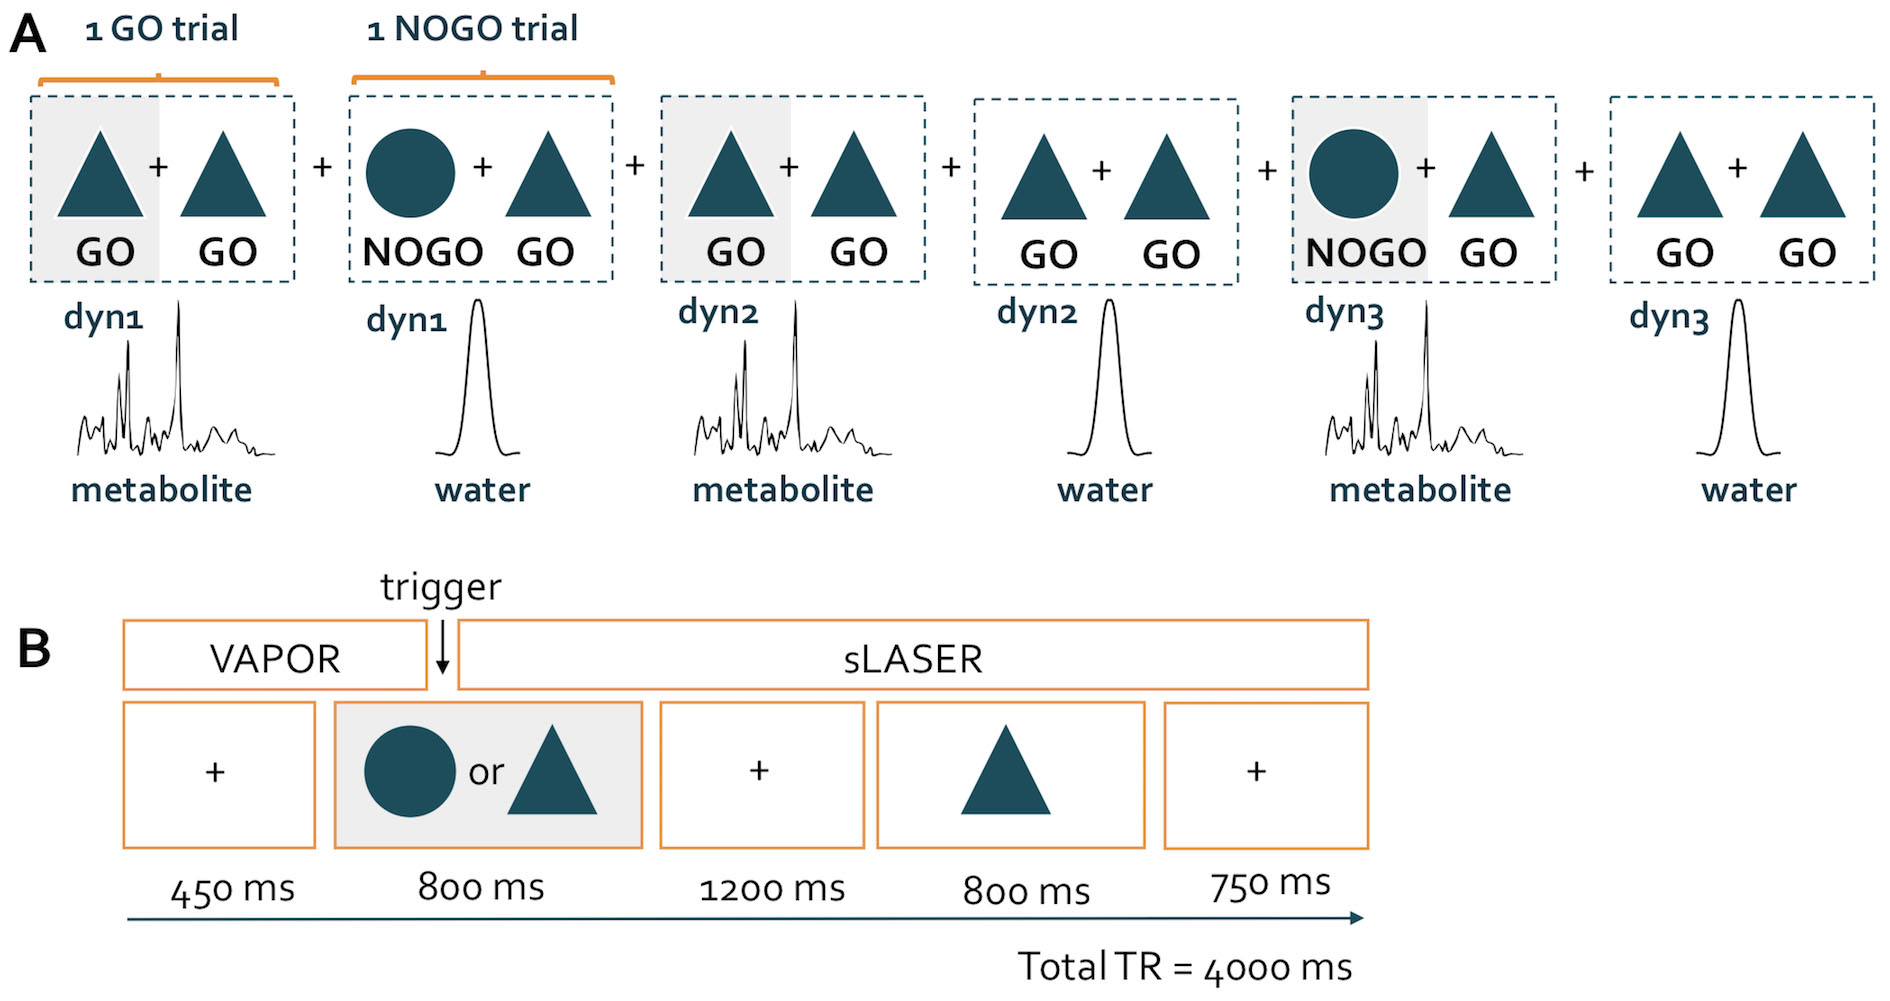
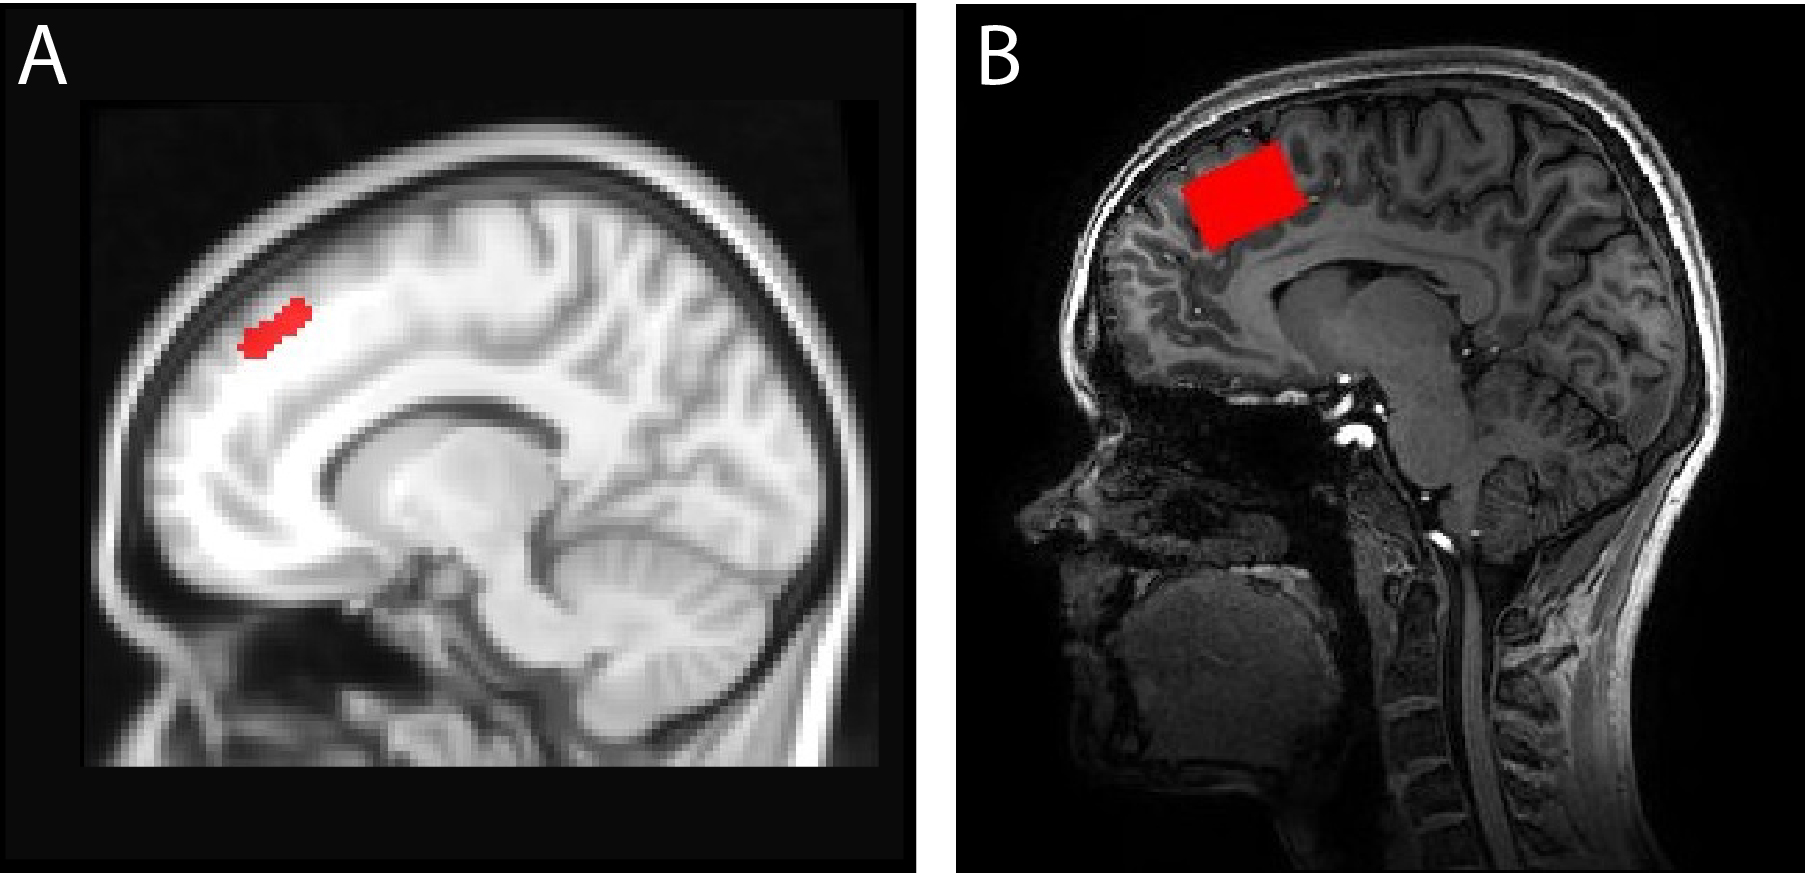
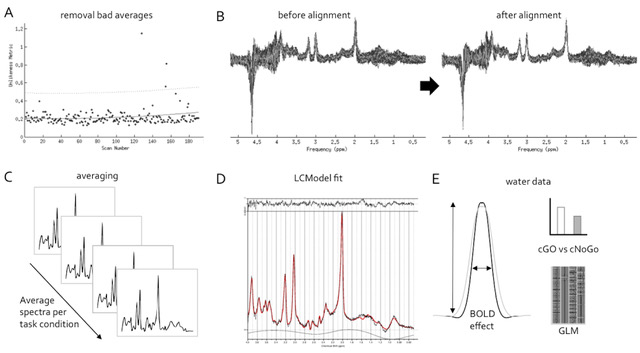
Ten healthy subjects performed an adjusted version of a validated Go/NoGo task4 during fMRS acquisition. The task consisted of 380 trials, with 2 stimuli per trial (Go-trial: 2 Go-stimuli; NoGo-trial: 1 NoGo-stimulus, 1 Go-stimulus). Two stimuli were presented per trial to elicit a prepotent motor response. The total ratio of Go vs NoGo-stimuli was 70:30, but the amount of trials for spectral analysis was 50:50 (Figure 1). FMRS data were acquired on a 7T whole-body MR system (Philips) with a dual-channel transmit coil and a 32-channel receive coil (Nova Medical) using an sLASER sequence (TR/TE=4000/36ms; band-width=4kHz; 2048 data-points; voxel-size=30x20x20mm; dynamics=190, total acquisition time~25min). Water-suppressed (metabolite) spectra were interleaved with water-unsuppressed acquisitions in order to determine the linewidth narrowing/increasing amplitude as a measure of the BOLD effect2. The voxel was placed in the dorsomedial prefrontal cortex (dmPFC) (Figure 2B), the main activated area during an fMRI pilot (2D-GE-EPI) using the same task (Figure 2A). Metabolite data were pre-processed (removal of bad averages, spectral registration) using FID-A5. Subsequently, correct Go (cGo) and correct NoGo (cNoGo) spectra were combined into blocks of 8 averages before analysis in LCModel (with parameters as in 6) (Figure 3A-D). glutamate/water (Glu/H2O) and lactate/water (Lac/H2O) ratios were extracted and compared between cGo and cNoGo blocks using non-parametric t-tests (any ratios with a %CRLB >40 were excluded). Individual water signals were fitted to Lorentzian lineshapes to estimate the amplitude. Amplitudes were statistically compared between cGo, cNoGo and incorrect NoGo (incNoGo) 1) by averaging amplitudes for each condition and performing non-parametric t-tests, and 2) by testing a GLM in which the task design was convolved with a hemodynamic response function (HRF) (Figure 3E).Results
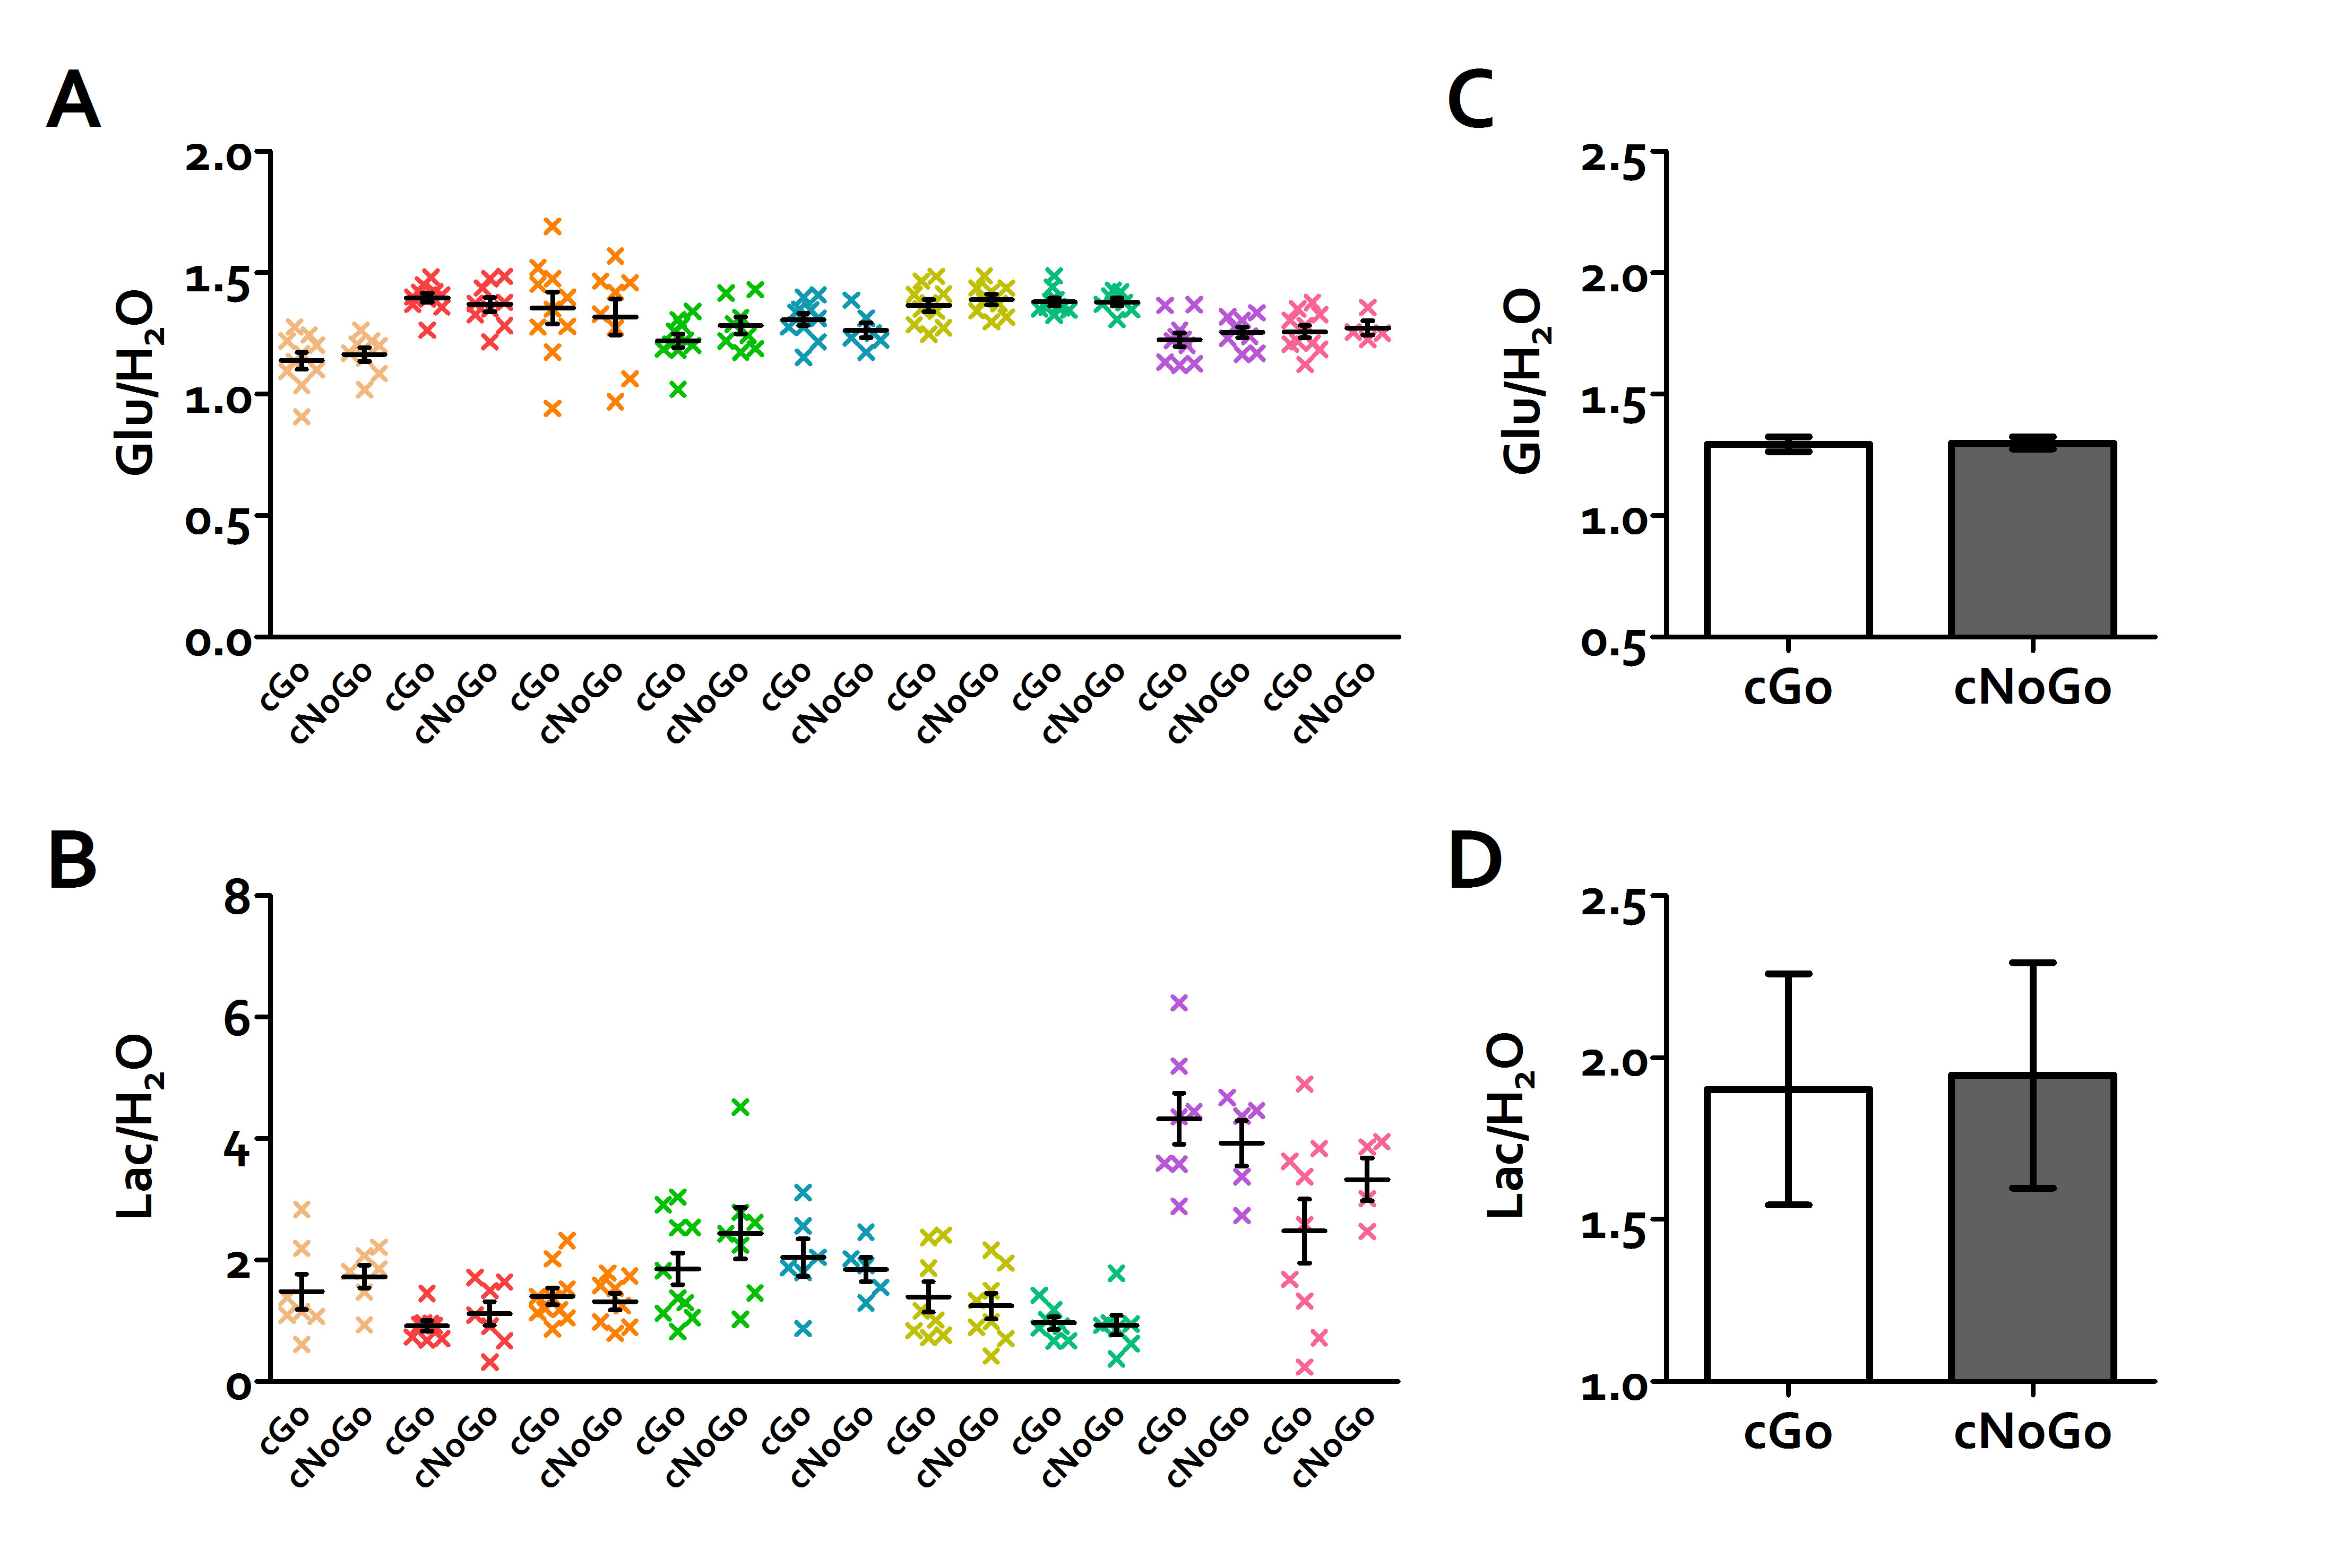
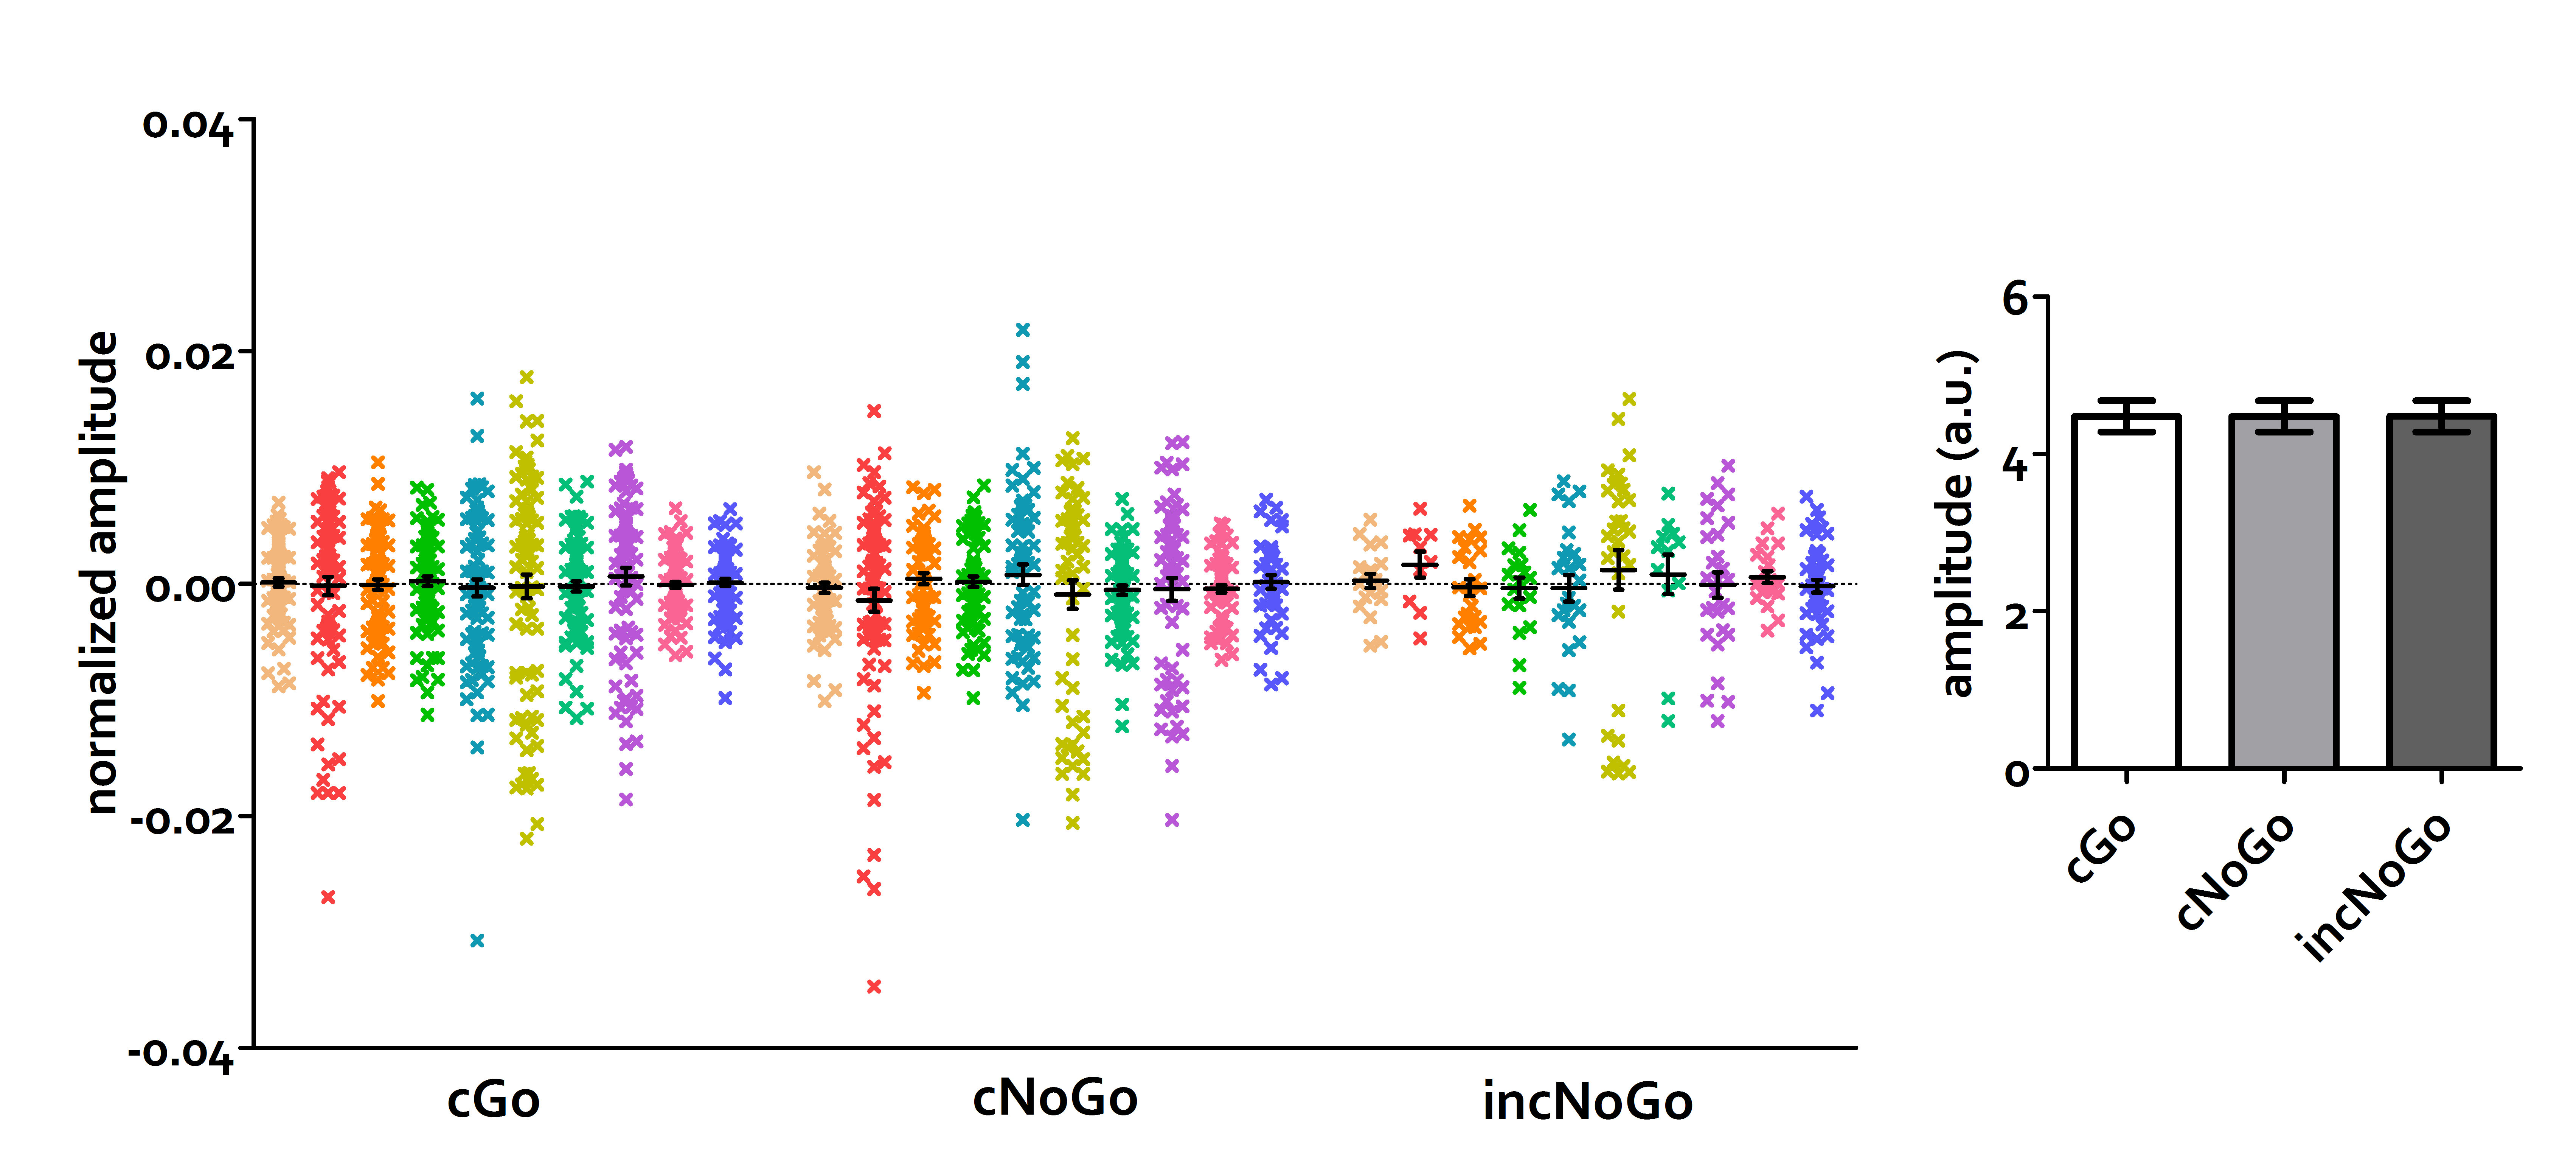
Behaviorally, subjects responded correctly to 98% of the Go trials and inhibited their response correctly in 69% of the NoGo trials. Water lineshapes were very stable within subjects. However, despite significant responses in the voxel location of the task in a single-subject fMRI acquisition (Figure 2A), we did not observe a BOLD response on the linewidth during cNoGo vs. cGo or incorNoGo trials (neither with ANOVA nor GLM (latter not shown); p>0.05) (Figure 4). Despite high quality metabolite spectra (mean SNR=32, mean CRLB for Glu of 3% and for Lac of 14% (for blocks of 8 averages)), we did not detect significant differences in Glu (p=0.91) or Lac (p=0.68) concentrations in cNoGo vs. cGo trials.Discussion and Conclusions
Despite previous event-related 3T fMRS studies showing an average Glu change of 13%2, as well as BOLD effects on water linewidths3, we did not observe such changes in this 7T study during response inhibition. This might be due to the nature of the task or the different voxel location. It is unlikely due to the quality of the spectra, given the high SNR and small CRLBs. Therefore, future studies should investigate the terms and conditions under which neuronal activity-induced metabolite fluctuations occur. Furthermore, the origin of the glutamate fluctuations observed in fMRS needs to be more extensively studied. This will allow us to estimate the added value of fMRS to the neuroimaging toolkit used for studying the pathophysiology of psychiatric disorders.Acknowledgements
This study was funded by an alliance grant from Amsterdam Neuroscience and by a VIDI grant (91717306) NWO-ZonMW awarded to OA van den HeuvelReferences
1. Mangia S, et al. Sustained neuronal activation raises oxidative metabolism to a new steady-state level: evidence from 1H NMR spectroscopy in the human visual cortex. J Cereb Blood Flow Metab 2007;27(5):1055-63
2. Mullins PG. Towards a theory of functional magnetic resonance spectroscopy (fMRS): A meta-analysis and discussion of using MRS to measure changes in neurotransmitters in real time. Scand J Psychol 2018;59(1):91-103
3. Apsvalka D, et al. Event-related dynamics of glutamate and BOLD effects measured using functional magnetic resonance spectroscopy (fMRS) at 3T in a repetition suppression paradigm. Neuroimage 2014; 118:292-300
4. Durston S, et al. The effect of preceding context on inhibition: an event-related fMRI study. Neuroimage 2002;16(2):449-53.
5. Simpson R, et al. (2015) Advanced processing and simulation of MRS data using the FID appliance (FID‐A):An open source, MATLAB‐based toolkit. Magn Reson Med. 77(1):23-33
6 Bhogal AA, et al. 1 H-MRS processing parameters affect metabolite quantification: The urgent need for uniform and transparent standardization. NMR Biomed. 2017;30(11).
7. Falkenstein et al. ERP components in Go/Nogo tasks and their relation to inhibition. Acta Psychol (Amst) 1999;101(2-3):267-91.
Figures