2252
Accurate Metabolite Quantification in the Presence Of Variable Lipids And Macromolecules: Two-Point Saturation Recovery MRS1Imperial College London, London, United Kingdom, 2University College London Hospitals NHS Foundation Trust, London, United Kingdom
Synopsis
In various pathologies, changes in cerebral metabolite concentrations are accompanied by variations in the broader underlying lipid/macromolecular components. This introduces important biases in quantification at short echo times which, if unaddressed, undermine experiments which compare subjects with different injury severities.
Here we demonstrate the benefits of employing a simple two-point saturation recovery MRS experiment to reduce this bias introduced by pathology – in this case, taking the example of neonatal encephalopathy. This ability to accurately quantify spectra at all pathology severities is crucial for clinical trials, where biases would otherwise suppress sensitivity to important treatment effects.
Introduction
MR spectroscopy is a powerful prognostic tool in the neonatal brain following hypoxic-ischaemic injury, with thalamic N-acetylaspartate + N-acetylaspartyl glutamate concentration ([tNAA]) predicting neurodevelopmental abnormalities years before they would otherwise be detected1.
However, pathological changes in cerebral metabolite concentrations are frequently accompanied by changes in the broader underlying lipid/macromolecule (LipMM) components. This phenomenon has been observed in various populations2-6, but is particularly problematic in the neonatal brain, where the relative abundances of the LipMM components appear to vary considerably.
For effective clinical trials, accurate surrogate biomarkers must be robust to such pathological changes, otherwise they risk missing important treatment effects.
In this study, we aimed to accurately measure thalamic [tNAA] in the presence of variable LipMM components by applying a two-point saturation recovery technique7.
Methods
Eleven term neonates were recruited at a single site (Imperial College London). The study was approved by City and East Research Ethics Committee (15/LO/1091), North London Research Ethics Committee (11/H0717/6), and all parents provided written informed consent.
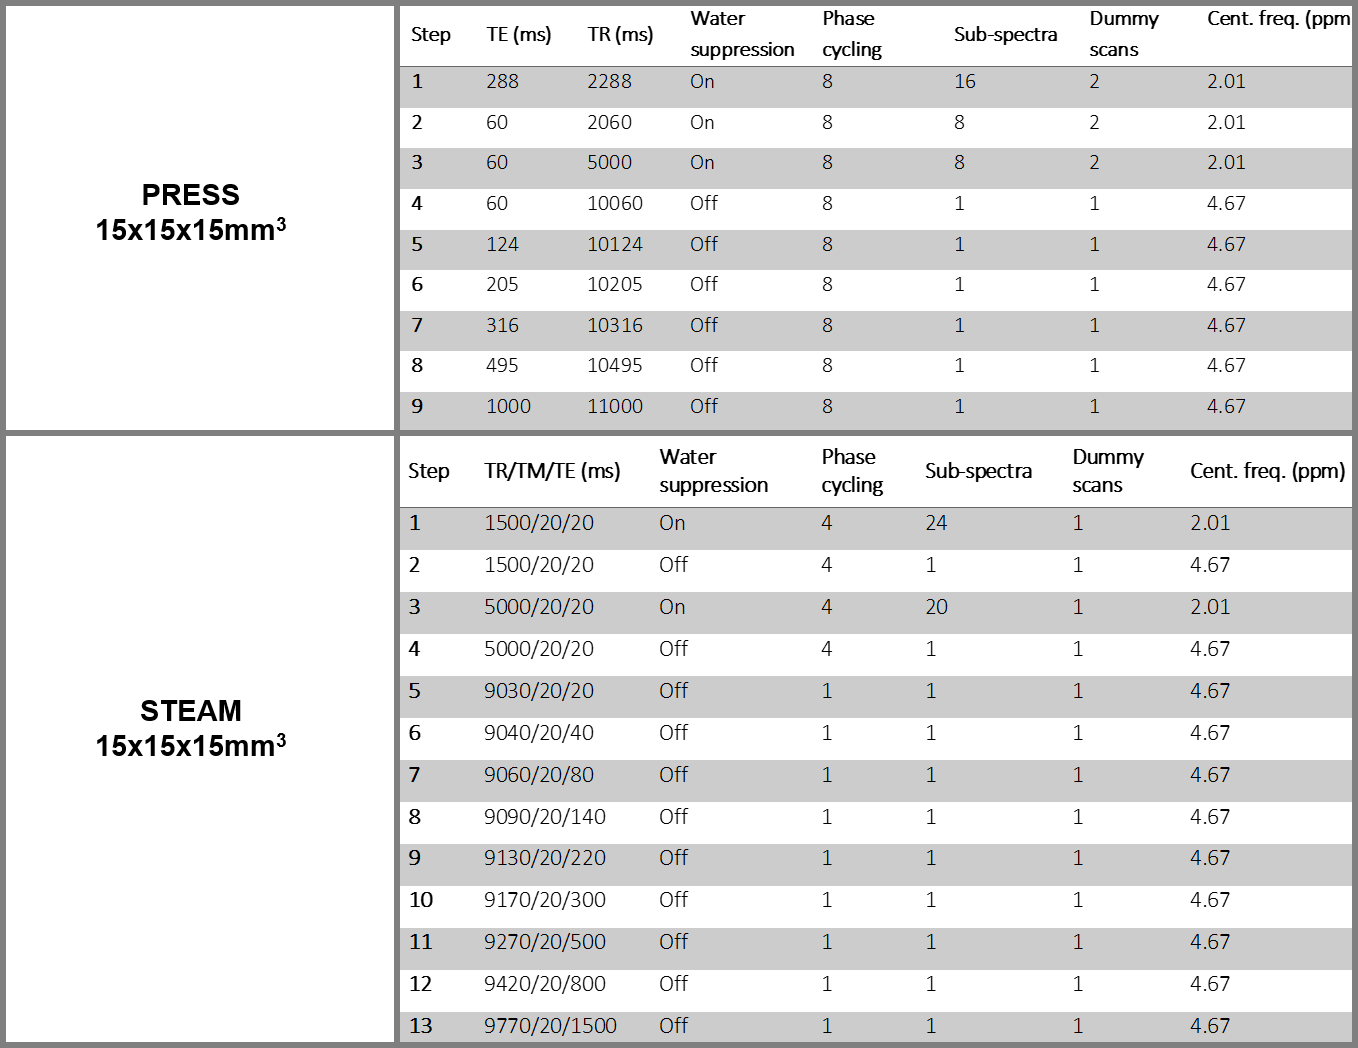
This was a heterogeneous population to reflect the variation in spectra observed clinically, with the severity of injury assessed at 6h as follows: two had severe injury, six had moderate, two had mild, and one had no injury. Nine infants were scanned within the first week after birth (range 1-7 days), while one neonate with each of moderate and severe injury was scanned at one month (33 days and 36 days after birth respectively). Each neonate underwent the two protocols outlined in Table 1, on a 3T Philips Achieva (Best, Netherlands).
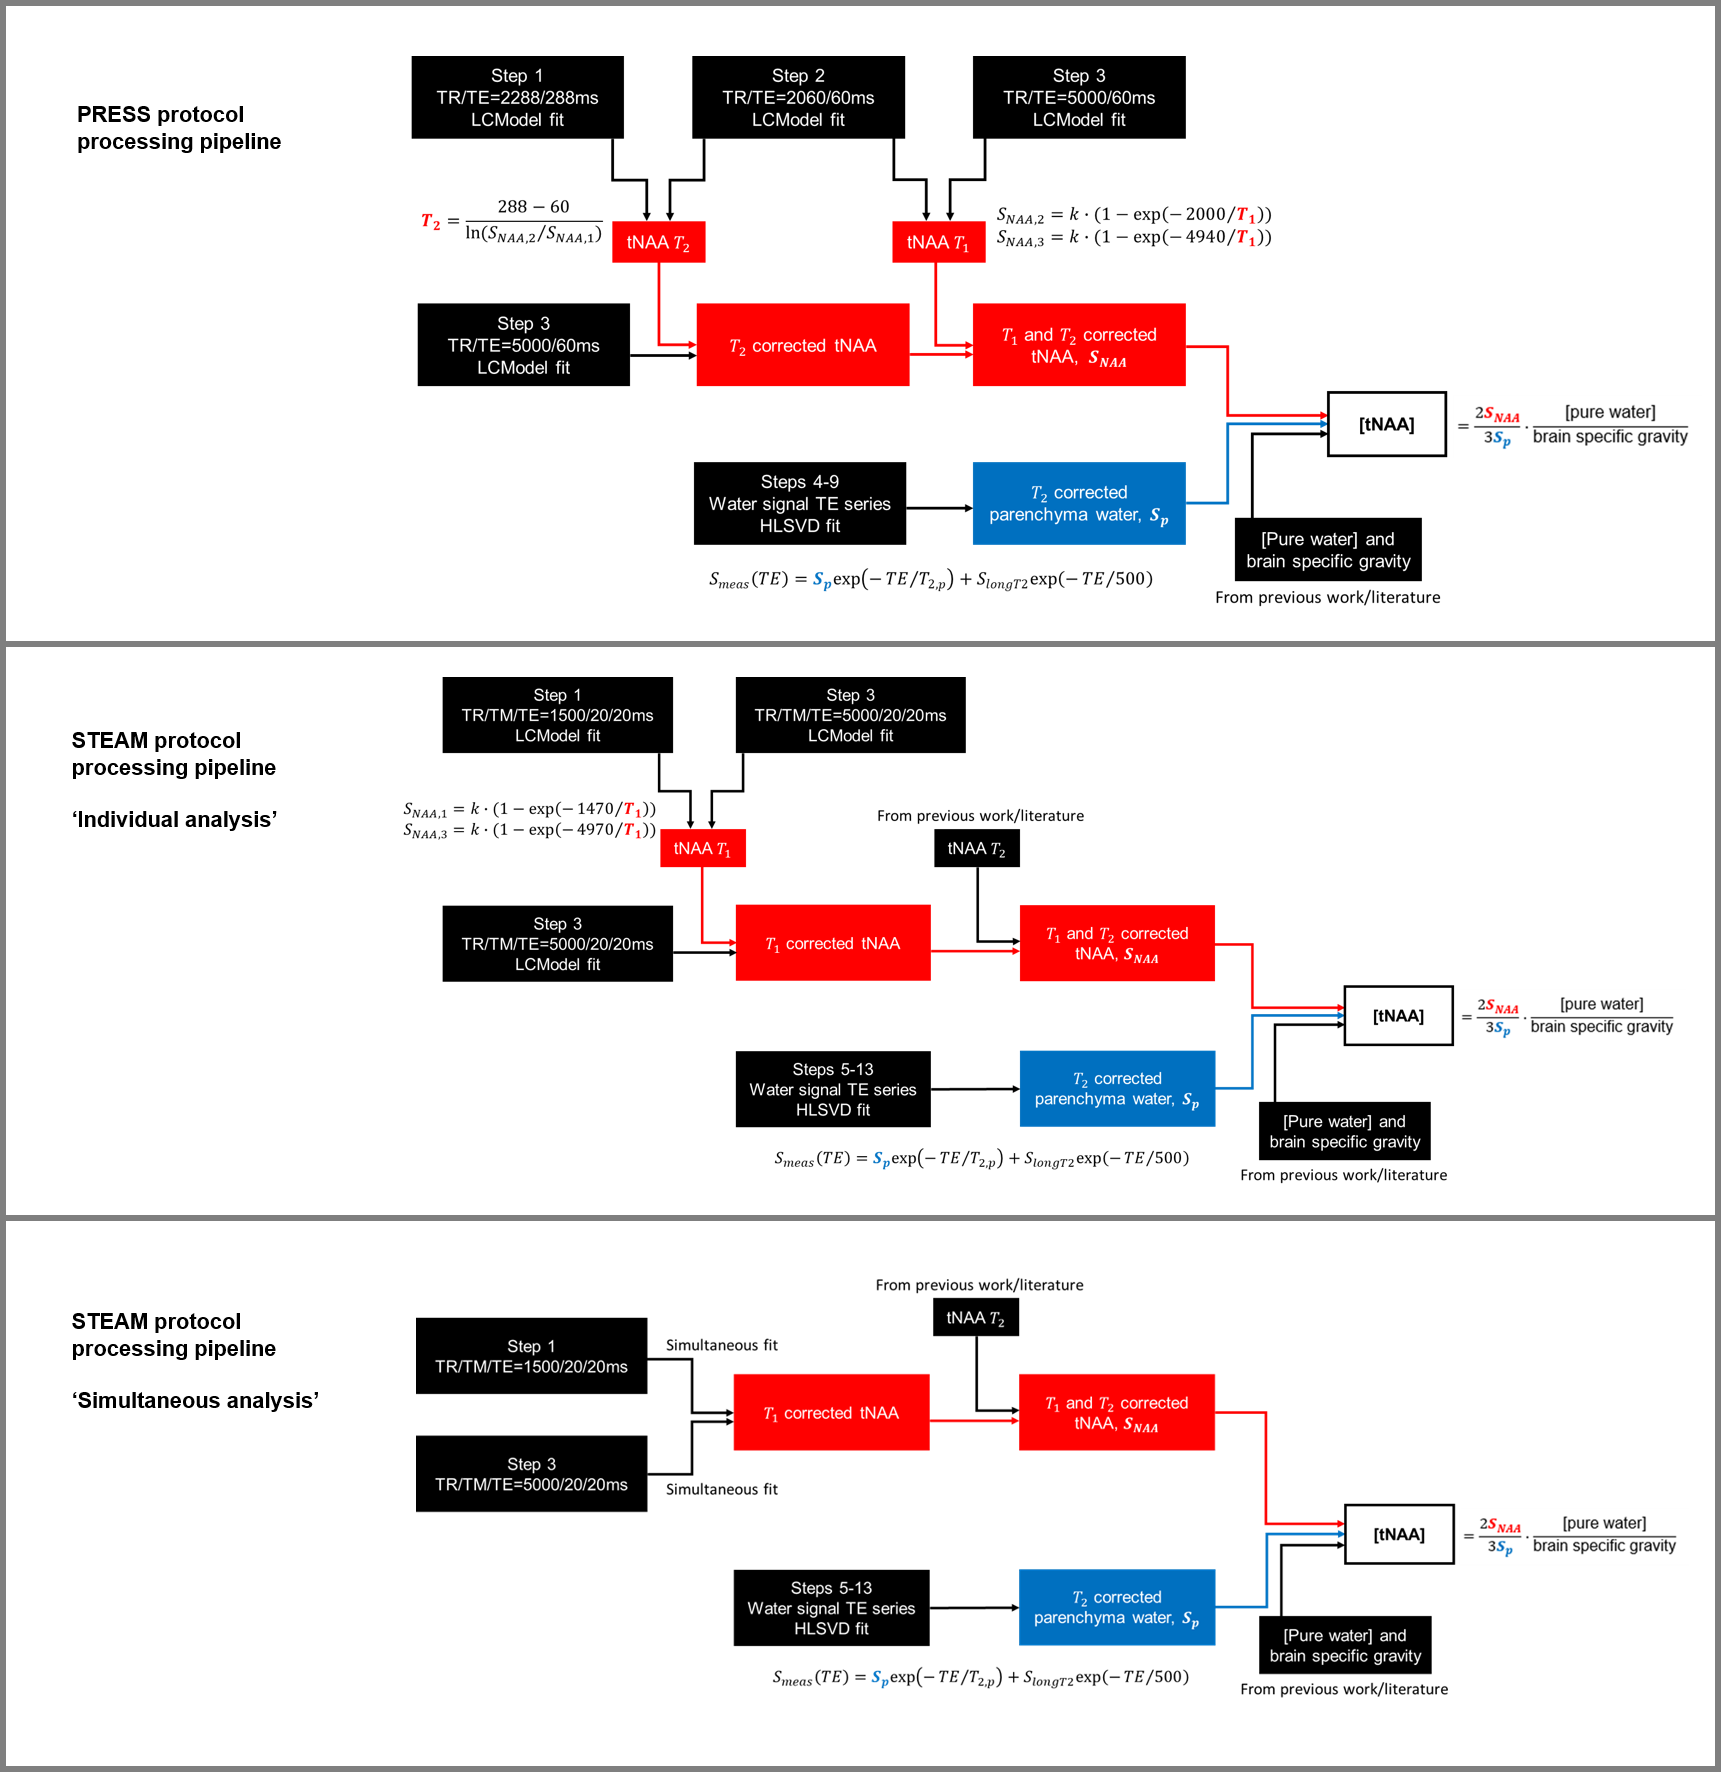
The PRESS protocol enabled measurements of assumed ‘ground truth’ concentrations, at a minimum echo time of 60ms where LipMM contamination is minimal, and applying a subject-specific T2 correction. A schematic of the processing pipeline for this protocol is given in Figure 1.
The STEAM protocol enabled measurements of concentrations in the presence of LipMM contamination. This was processed in two ways, with a schematic of the processing pipeline for each given in Figure 1. The first used LCModel8 (v6.3-1J), fitting each water-suppressed spectrum separately (and so with no prior information shared between fits). The second employed a novel quantification strategy in MATLAB (Natick, USA), analysing the spectra at two TRs simultaneously with a shared LipMM component7 (using the same LipMM parameterisation as employed in LCModel, and discarding any soft constraints on relative amplitudes).
All metabolite basis sets were simulated in VeSPA-Simulate9 (v0.9.3) using ideal RF pulses, the TE1, TE2, TM and TE used in the protocol, and applying 1Hz Gaussian broadening. The methyl peaks of NAA, NAAG, Cho, PCr and Cr were separated from other groups in the basis spectra due to differential relaxation rates. The level of agreement between STEAM results and the assumed ground truth PRESS result were assessed using Bland-Altman plots, and examined for systematic differences. Correlation matrices were also constructed to examine the sensitivity of the fit to the LipMM components.
Results
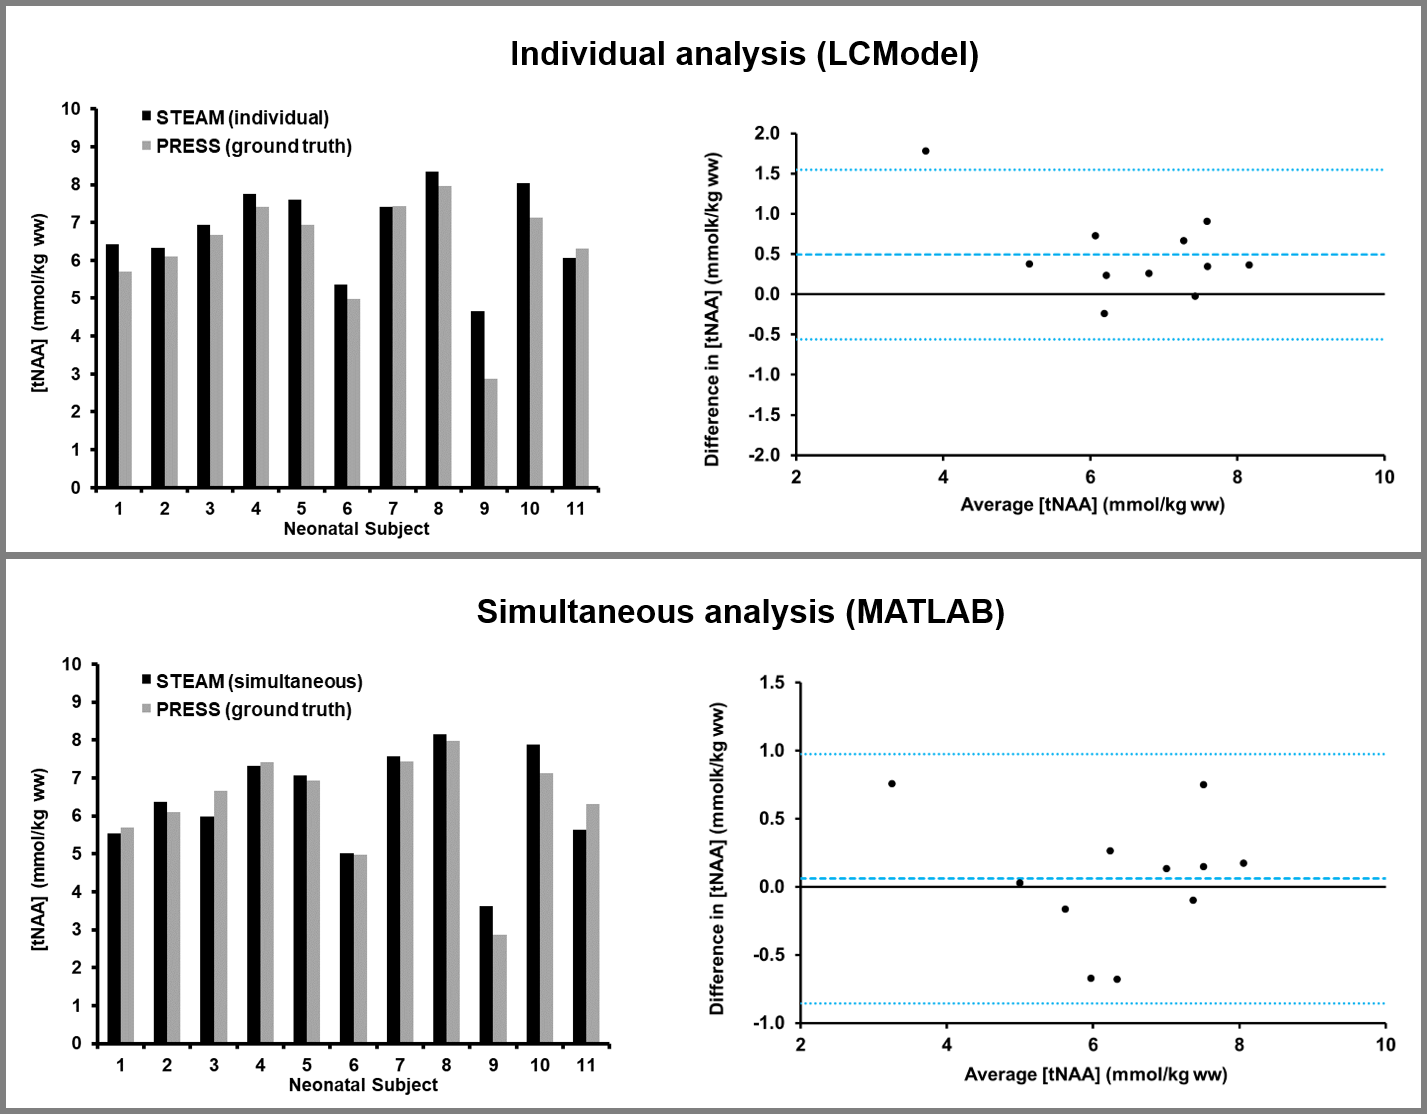
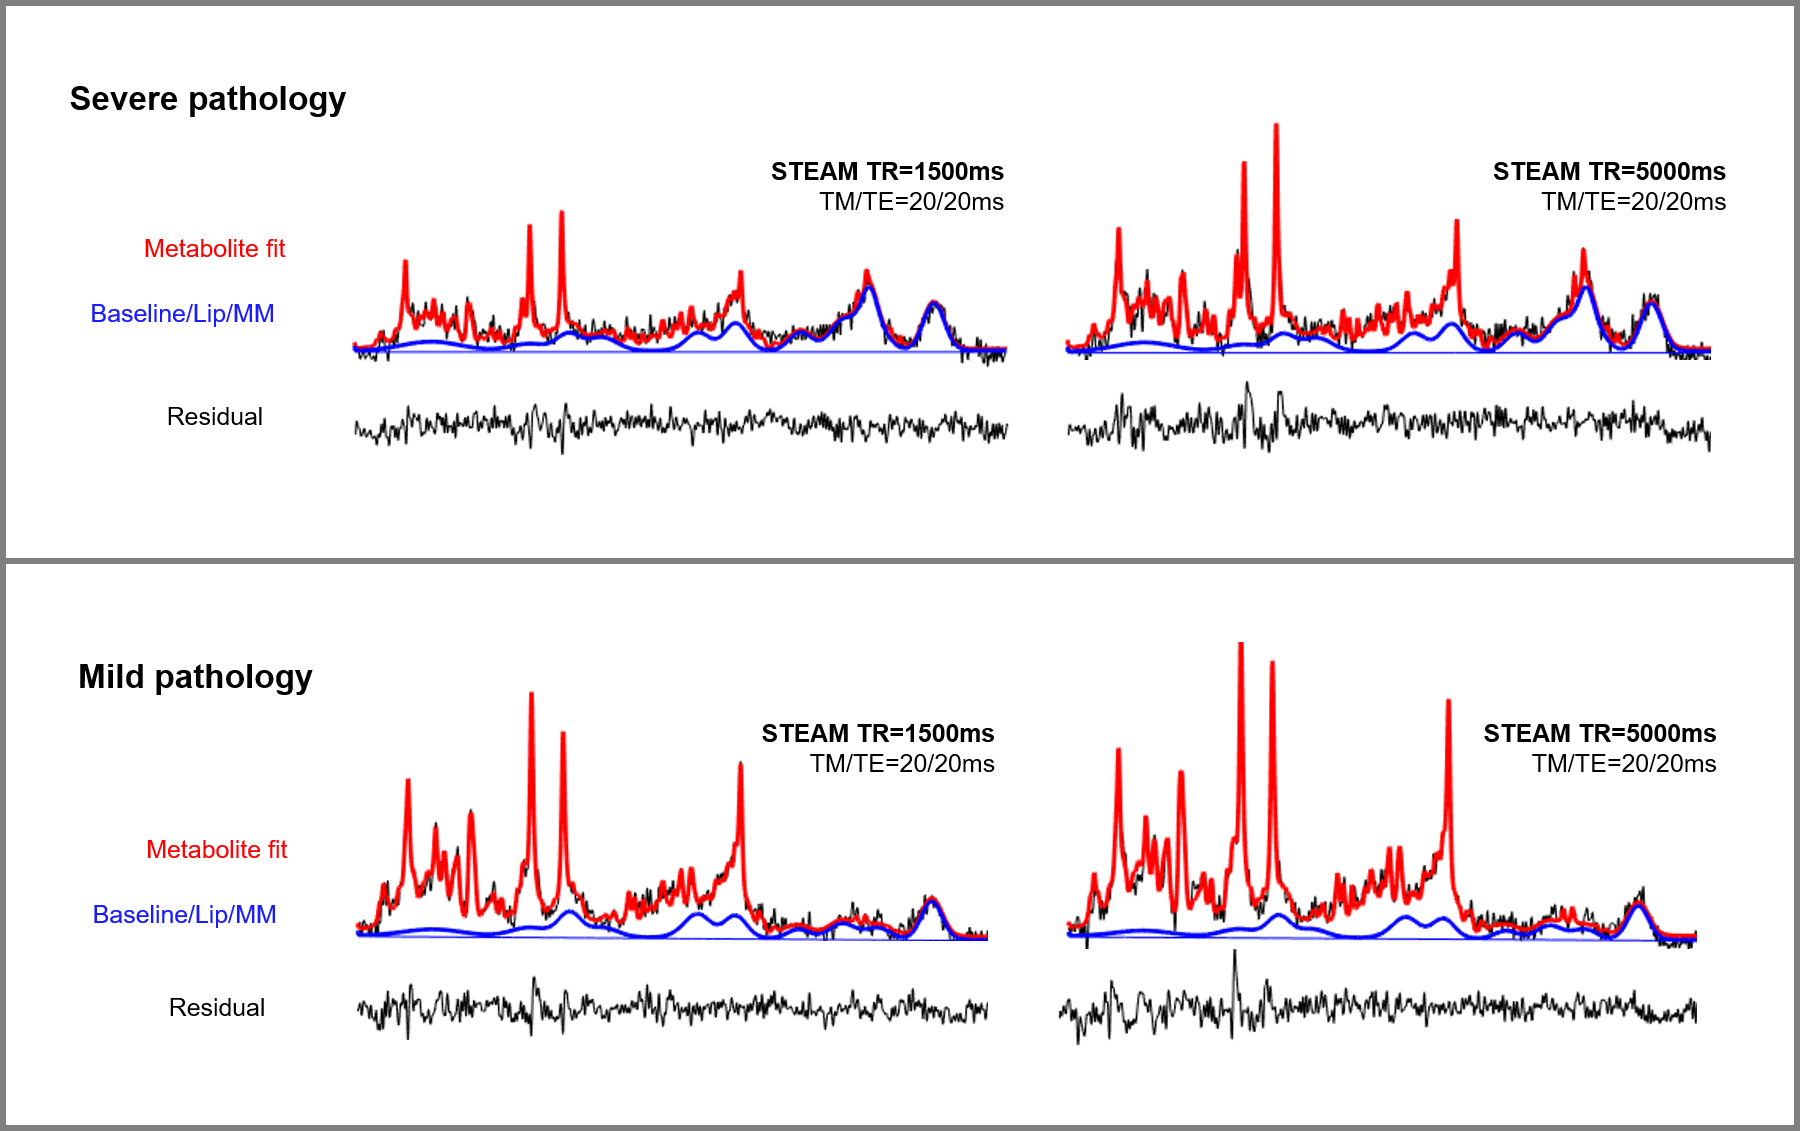
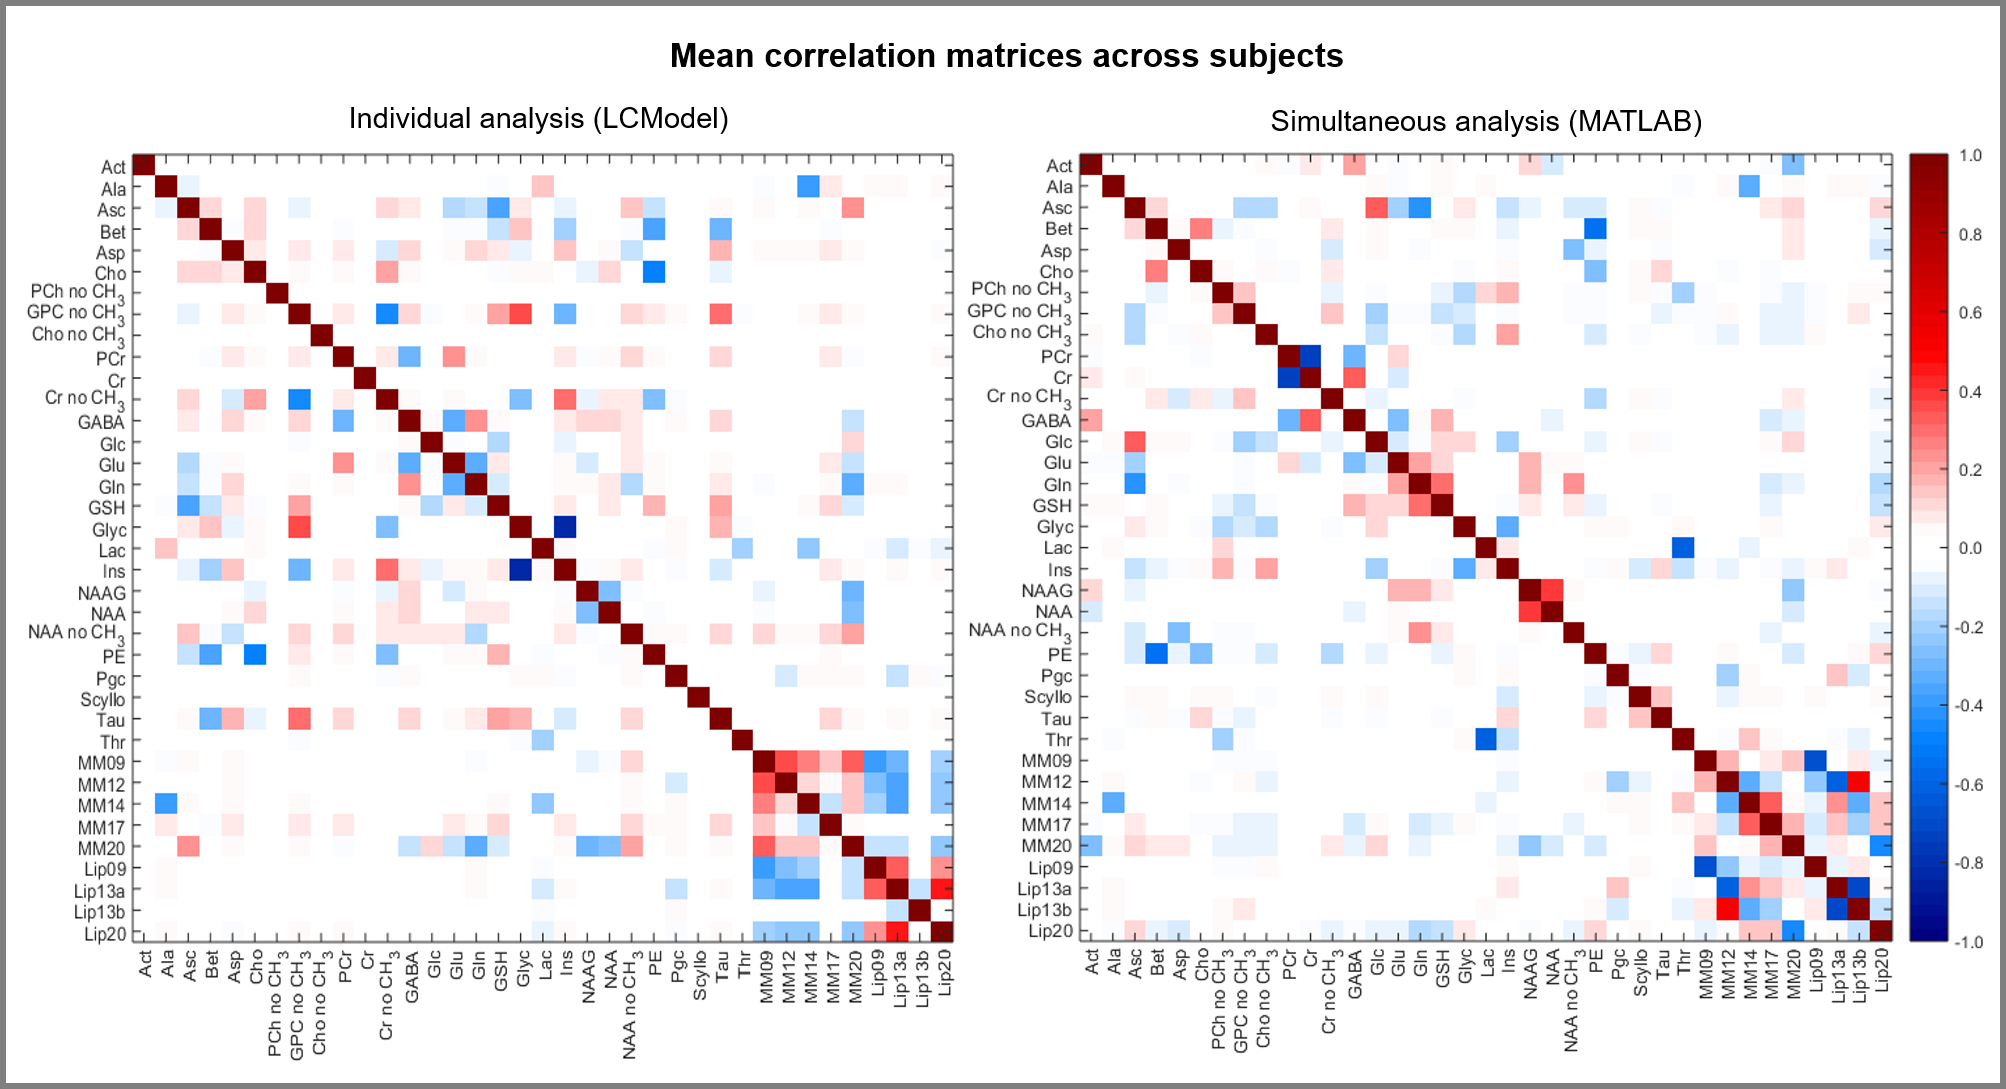
The results of each analysis strategy are shown in Figure 2, compared with the assumed ground truth result obtained using the LipMM-free PRESS protocol. Representative fits from simultaneous analysis are shown in Figure 3 for different injury severities. The mean correlation matrices obtained from the fitting process across subjects are shown in Figure 4.Discussion
The mean bias and variance were reduced when fitting spectra at the two TRs simultaneously, rather than individually, as demonstrated in the Bland-Altman plots in Figure 2. In particular, the case with the lowest [tNAA] (Subject 9) showed improved accuracy with the simultaneous strategy (lower panel of Figure 2).
Examining Figure 4, the LCModel soft constraints have ensured that LipMM resonances are all strongly inter-dependent during individual analysis (bottom right hand corner of left matrix). Simultaneous analysis reduces this (corresponding region of right matrix), with only directly overlapping LipMM resonances strongly correlated. This, in turn, reduces the influence of the LipMM components on the fitting of NAA and NAAG (see the corresponding rows/columns).
Conclusion
Extending an existing protocol to obtain a spectrum at a second, short TR (1.5s) improves the robustness of the fitting process to LipMM components. Including such an acquisition in an existing protocol would only give a marginal increase in examination time (~3min), and could employed to experiments using various localisation techniques.
This simultaneous analysis strategy would easily allow the inclusion of richer basis spectra which represent the full range of known LipMM components10, without the need to introduce arbitrary constraints on their relative abundances. This would improve quantification accuracy even in the presence of severe pathology, which is crucial for its successful application in clinical trials.
Acknowledgements
This work was supported by an NIHR Healthcare Science Doctoral Fellowship to PJL. PJL is supported by the Imperial NIHR Biomedical Research Centre and an NIHR Clinical Trials Fellowship.References
- Lally PJ et al. (2018) Magnetic resonance spectroscopy assessment of brain injury after moderate hypothermia in neonatal encephalopathy: a prospective multicentre cohort study. Lancet Neurol, S1474-4422, 18, 30325-9
- Mader I et al. (2001) Proton MR spectroscopy with metabolite-nulling reveals elevated macromolecules in acute multiple sclerosis. Brain, 124, 953-61.
- Graham GD et al. (2001). Spectroscopic assessment of alterations in macromolecule and small-molecule metabolites in human brain after stroke. Stroke, 32, 2797-802.
- Kreis R et al. (2005) Integrated data acquisition and processing to determine metabolite contents, relaxation times, and macromolecule baseline in single examinations of individual subjects. Magn Res Med, 54, 761-768.
- Opstad KS et al. (2008) Apparent T2 relaxation times of lipid and macromolecules: A study of high-grade tumor spectra. JMRI 27, 178-184.
- Marjańska M et al. (2018) Altered macromolecular pattern and content in the aging human brain. NMR Biomed, 31, e3865-n/a.
- Lally PJ et al. (2017) Dual spectral analysis for metabolite quantification in the presence of lipids and macromolecules. Proc. ISMRM 25:3011
- Provencher S (2001) Automatic quantitation of localized in vivo 1H spectra with LCModel. NMR Biomed 14, 4, 260-4
- Soher BJ et al. (2011) VeSPA: Integrated applications for RF pulse design, spectral simulation and MRS data analysis. Proc. ISMRM 19:1410
- Považan M et al. (2018) Simultaneous mapping of metabolites and individual macromolecular components via ultra-short acquisition delay 1H MRSI in the brain at 7T. Magn Res Med, 79, 1231-1240.
Figures