2251
Feasibility of functional spectroscopy at a clinical 3T MR scanner1High Field MR Center, Medical University of Vienna, Vienna, Austria, 2) Department of Medicine III, Clinical Division of Endocrinology and Metabolism, Medical University of Vienna, Vienna, Austria, 3Center for Magnetic Resonance Research, University of Minnesota, Minneapolis, MN, United States, 4Department of Psychiatry and Psychotherapy, Medical University of Vienna, Vienna, Austria
Synopsis
Functional spectroscopy (
Introduction
Functional spectroscopy (fMRS) is currently the only non-invasive method for measurements of metabolite changes related to activated brain energetic metabolism during sensory task, e.g., visual stimulation. While proton (1H) fMRS has been well established at 7T scanners and provided consistent results worldwide,1,2 fMRS conducted at lower fields mainly focused on lactate and showed substantial discrepancies.3,4 Nevertheless, an accurate and sensitive fMRS method is emergently needed for clinical studies at 3T since deficiencies of energetic metabolism underlie pathophysiology of various neurological5,6 and neuropsychiatric diseases.7 Therefore, we utilized semi-LASER sequence optimized for 3T scanner, which allows measuring extended neurochemical profile in combined fMRS and BOLD-fMRI experiment, to achieve higher within-session reproducibility,8 and quantification accuracy relative to conventional approaches. We used the same stimulus as in our previous 7T MRS study, i.e. red-black checkerboard flickering at a frequency of 8Hz,9 but we performed shorter paradigm of visual stimulation during fMRS experiment in order to demonstrate capability of 3T semi-LASER to measure fMRS changes in clinically feasible acquisition time.Methods
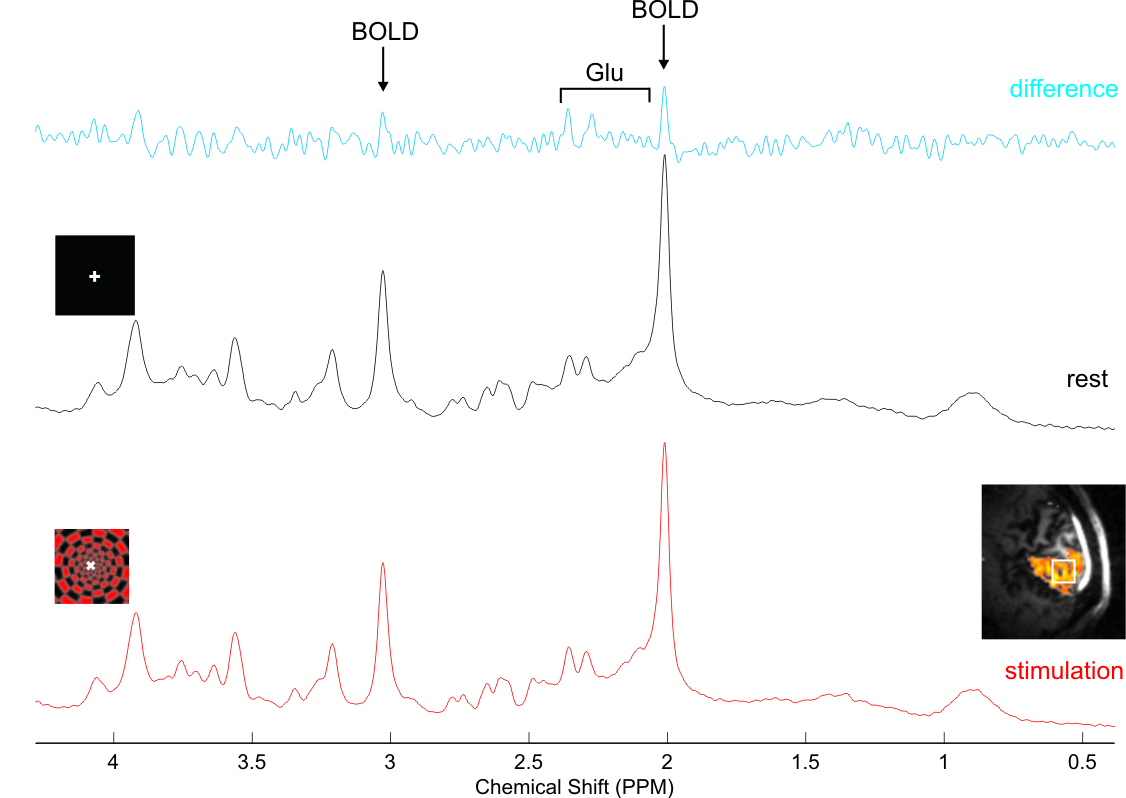
FMRS/fMRI experiment was conducted on 3T Siemens Prisma scanner with 64-channels head-neck receive array coil. High-resolution MPRAGE images were utilized to place 8mL spectroscopy voxel in the primary visual cortex. A FASTMAP technique minimized within-voxel B0 inhomogeneity. Spectra were acquired with semi-LASER localization sequence where HS4 pulses were replaced with GOIA-WURST adiabatic pulses10 to provide better excitation profiles, lower requirements and shorter echo time (TE = 23 ms). Spectra were acquired from 10 young healthy volunteers (29±5 y.o., 3 men) during functional paradigm with STIM (flickering checkerboard) and REST(black screen) conditions. During both conditions white cross in the center of subjects’ field of view randomly changed orientation and served as simple attentional task to monitor of subjects’ compliance. The first short REST (16 scans, TR = 5s) was followed with 64 scans long blocks of STIM and REST. Thus, the whole fMRS paradigm (REST-STIM-REST) was accomplished in 12 min. STEAM-based low-flip angle water excitation was used for each TR to correct for frequency drifts thus reassuring stable performance of VAPOR water suppression. Unsuppressed water spectra were utilized to correct eddy currents and as an internal reference for quantification. Final concentrations were corrected for the within-voxel fraction of cerebrospinal fluid. The spectra from the end of STIM and second REST (48 single scans) period were corrected for frequency and phase drifts, summed and quantified in LCmodel utilizing a basis set of 19 simulated metabolites and a measured spectrum of macromolecules. Concentrations were compared (STIM vs. REST) using paired t-test and false discovery rate (FDR) reduced likelihood of false positive results to 10%. Spectra quality parameters such as SNR (measured in frequency domain as ratio of the N-acetyl-aspartate methyl resonance at 2.02 ppm and root mean square of the noise on the summed spectrum, NEX=48) and line-width of unsuppressed water were assessed.Results and Discussion
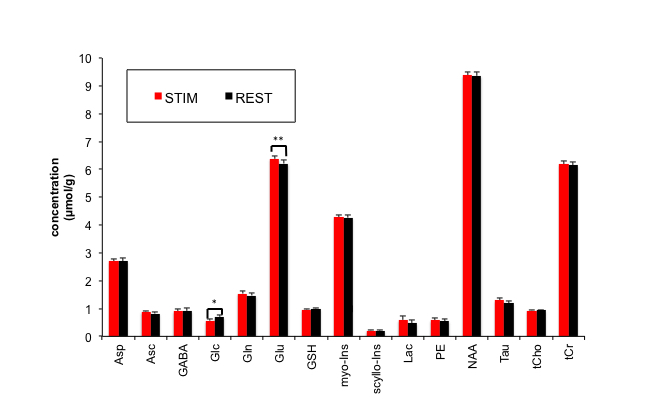
Artifact-free difference spectrum demonstrates high spectral quality (Fig.1). The average SNR and linewidth were 302±47 and 7.8±0.2 Hz, respectively. Alanine and N-acetyl-aspartylglutarate were not quantifiable in most subjects and were not considered for further analysis. Pairs of metabolites with correlation coefficients <-0.8 were considered only as a sum (Fig.2). Significant increase of glutamate by 2.9%±1.9% (pFDRcorrected=0.007) and decrease of glucose by 19.8%±17.5% (pFDRcorrected=0.01) were observed in response to stimulus. Lactate increased but did not reach significance (pFDRcorrected=0.03). Observed variance in glutamate responses (SD/mean=68%) could be explained by variance in BOLD-fMRI fraction of activated voxels (SD/mean=55%) within the volume of interest.9,11 Lactate was not quantifiable in 2 subjects due to small lipid signal around 1.3 ppm. However, CRLB of glutamate were 4.4%±0.5% that is in the order of expected changes (3-4%) and is lower than previously achieved at 3T with PRESS.12 While distinctions of glutamate, glucose, and lactate are consistent with previous 7T studies,9 we did not observe significant change in aspartate that could be caused by lower SNR and CRLB of aspartate (10,8%±2.0). As the BOLD effect-related linewidth difference between STIM and REST spectra is proportional to the magnetic field, we did not observe any quantification bias caused by this effect that was previously observed at 7T.9Conclusions
3T outcomes for glutamate and glucose are consistent with findings reported in previous studies conducted at ultra-high-field 7T scanners, while the current study utilized shorter and clinically more feasible paradigm of visual stimulation. Our study confirmed clinical potential of 3T semi-LASER fMRS to reliably quantify functional metabolic changes. 3T semi-LASER fMRS may be thus utilized to measure changes in glucose and glutamate concentration during brain activation in larger clinical studies.
Acknowledgements
A. S. received funding from the European Union’s Horizon 2020 research and innovation programme under the Marie Skłodowska-Curie grant agreement No 794986, D. D. was supported by NIH P41 EB015894 grantReferences
1. Lin Y, Stephenson MC, Xin L, et al. Investigating the metabolic changes due to visual stimulation using functional proton magnetic resonance spectroscopy at 7 T. J Cereb Blood Flow Metab 2012; 32: 1484-1495.
2. Schaller B, Mekle R, Xin L, et al. Net increase of lactate and glutamate concentration in activated human visual cortex detected with magnetic resonance spectroscopy at 7 tesla. J Neurosci Res 2013; 91: 1076-1083.
3. Prichard J, Rothman D, Novotny E, et al. Lactate rise detected by 1H NMR in human visual cortex during physiologic stimulation. Proc Natl Acad Sci U S A 1991; 88: 5829-5831.
4. Sappey-Marinier D, Calabrese G, Fein G, et al. Effect of photic stimulation on human visual cortex lactate and phosphates using 1H and 31P magnetic resonance spectroscopy. J Cereb Blood Flow Metab 1992; 12: 584-592.
5. Iadecola C. Neurovascular regulation in the normal brain and in Alzheimer's disease. Nat Rev Neurosci 2004; 5: 347-360.
6. Adanyeguh IM, Rinaldi D, Henry PG, et al. Triheptanoin improves brain energy metabolism in patients with Huntington disease. Neurology 2015; 84: 490-495. 7. Taylor R, Schaefer B, Densmore M, Neufeld RWJ, Rajakumar N, Williamson PC, Theberge J. Increased glutamate levels observed upon functional activation in the anterior cingulate cortex using the Stroop Task and functional spectroscopy. Neuroreport 2015; 26: 107-112.
8. Terpstra M, Cheong I, Lyu T, et al. Test-retest reproducibility of neurochemical profiles with short-echo, single-voxel MR spectroscopy at 3T and 7T. Magn Reson Med 2016; 76: 1083-1091.
9. Bednarik P, Tkac I, Giove F, et al. Neurochemical and BOLD responses during neuronal activation measured in the human visual cortex at 7 Tesla. J Cereb Blood Flow Metab 2015; 35: 601-610.
10. Deelchand D, Joers J, Snoussi K, et al. Across-vendor standardization of semi-LASER for single-voxel MRS at 3 Tesla. Proceedings: ISMRM Workshop on MRS 2016; Lake Constance, Germany.
11. Bednarik P, Tkac I, Giove F, et al. Neurochemical responses to chromatic and achromatic stimuli in the human visual cortex. J Cereb Blood Flow Metab 2018; 38: 347-359.
12. Stanley JA, Burgess A, Khatib D, et al. Functional dynamics of hippocampal glutamate during associative learning assessed with in vivo (1)H functional magnetic resonance spectroscopy. Neuroimage 2017; 153: 189-197.
Figures