2249
Low Reliability between in vivo Measurements of Glutamatergic Metabolite Concentrations in Two Proton MR Spectroscopy Sequences1Department of Psychiatry and Psychology, Mayo Clinic, Rochester, MN, United States, 2Department of Clinical Sciences, Division of Biostatistics, UT Southwestern Medical Center, Dallas, TX, United States, 3Department of Radiology, Mayo Clinic, Rochester, MN, United States
Synopsis
Newer spectral sequences have been developed to focus quantification of specific metabolites. In this study, measurements of glutamatergic metabolites in a human sample (N=178) were compared between two sequences, a standard TE-optimized PRESS sequence designed to capture broad spectral resonance and a 2-dimensional J-resolved PRESS sequence developed specifically for glutamate signal acquisition at the expense of broad resonance capability. Cho/Cr and NAA/Cr measurements had good correspondence between sequences (intraclass correlation coefficients >0.88), while glutamate and related metabolites (Glu, Glu/Cr, Glx, Glx/Cr) demonstrated poor reliability. These findings emphasize the need to exercise caution when comparing glutamate measurements using different 1H-MRS sequences.
INTRODUCTION
Proton magnetic resonance spectroscopy (1H-MRS) techniques that quantify glutamate and related neural metabolites have great utility in the study of neuropsychiatric disorders. Various sequences for acquiring in vivo spectroscopic data of glutamatergic metabolites have been used in human studies. However, comparisons between different 1H-MRS sequences on glutamatergic metabolite concentrations are lacking. This study aimed to assess the correlations between measures of glutamate and related metabolites in two 1H-MRS sequences in a large, clinically diverse human sample. METHODS
Spectroscopic data were analyzed retrospectively from a sample of 178 individuals ranging in age from 13 to 71 years who underwent 1H-MRS at 3T in three scanners over a ten-year period. Sequence reproducibility was assessed with daily scans of phantom spheres containing the major brain metabolites (“braino-ball”), sampling a voxel in the center of the sphere. Coefficients of variation (CVs) were calculated for phantom metabolites across the three scanners and for both sequences. Participants consisted of healthy controls (n=28) as well as patients with unipolar major depressive disorder (n=41), bipolar I disorder (n=12), bipolar II disorder (n=19), neuromyelitis optica (n=15), alcohol use disorder (n=23), and social drinkers (n=40). All participants underwent two sequences, a TE-optimized PRESS (P80) sequence1 (PROBE-P, TR=2000 ms, TE=80 ms, number of acquisitions=128, 3-way phase cycling) and a 2-dimensional J-resolved PRESS (2DJ) sequence2,3 (TE=35-195 ms in 16 steps, TR=2000 ms, 8 averages, 3-way phase cycling). The region sampled was a 2×2×2 cm voxel encompassing the left dorsolateral prefrontal cortex (L-DLPFC), corresponding to Brodmann areas 9 and 46. Metabolites measured in both sequences included choline (Cho), creatine (Cr), glutamate (Glu), glutamate+glutamine (Glx), and N-acetylaspartate (NAA); metabolites were measured as absolute concentrations as well as relative to the Cr concentration. The two-way random effects intraclass correlation coefficient (ICC) was used to assess reliability (magnitude of consistency) between metabolite measurement pairs from the P80 and 2DJ sequences. The ICC was calculated for each metabolite in the entire sample, as well as within adult (>18 years, n=127) and adolescent (≤18 years, n=51) subgroups, female (n=118) and male (n=60) subgroups, and subgroups analyzed with LC Model4 versions 6.2-1A (n=117) and 6.3-1K (n=61).RESULTS
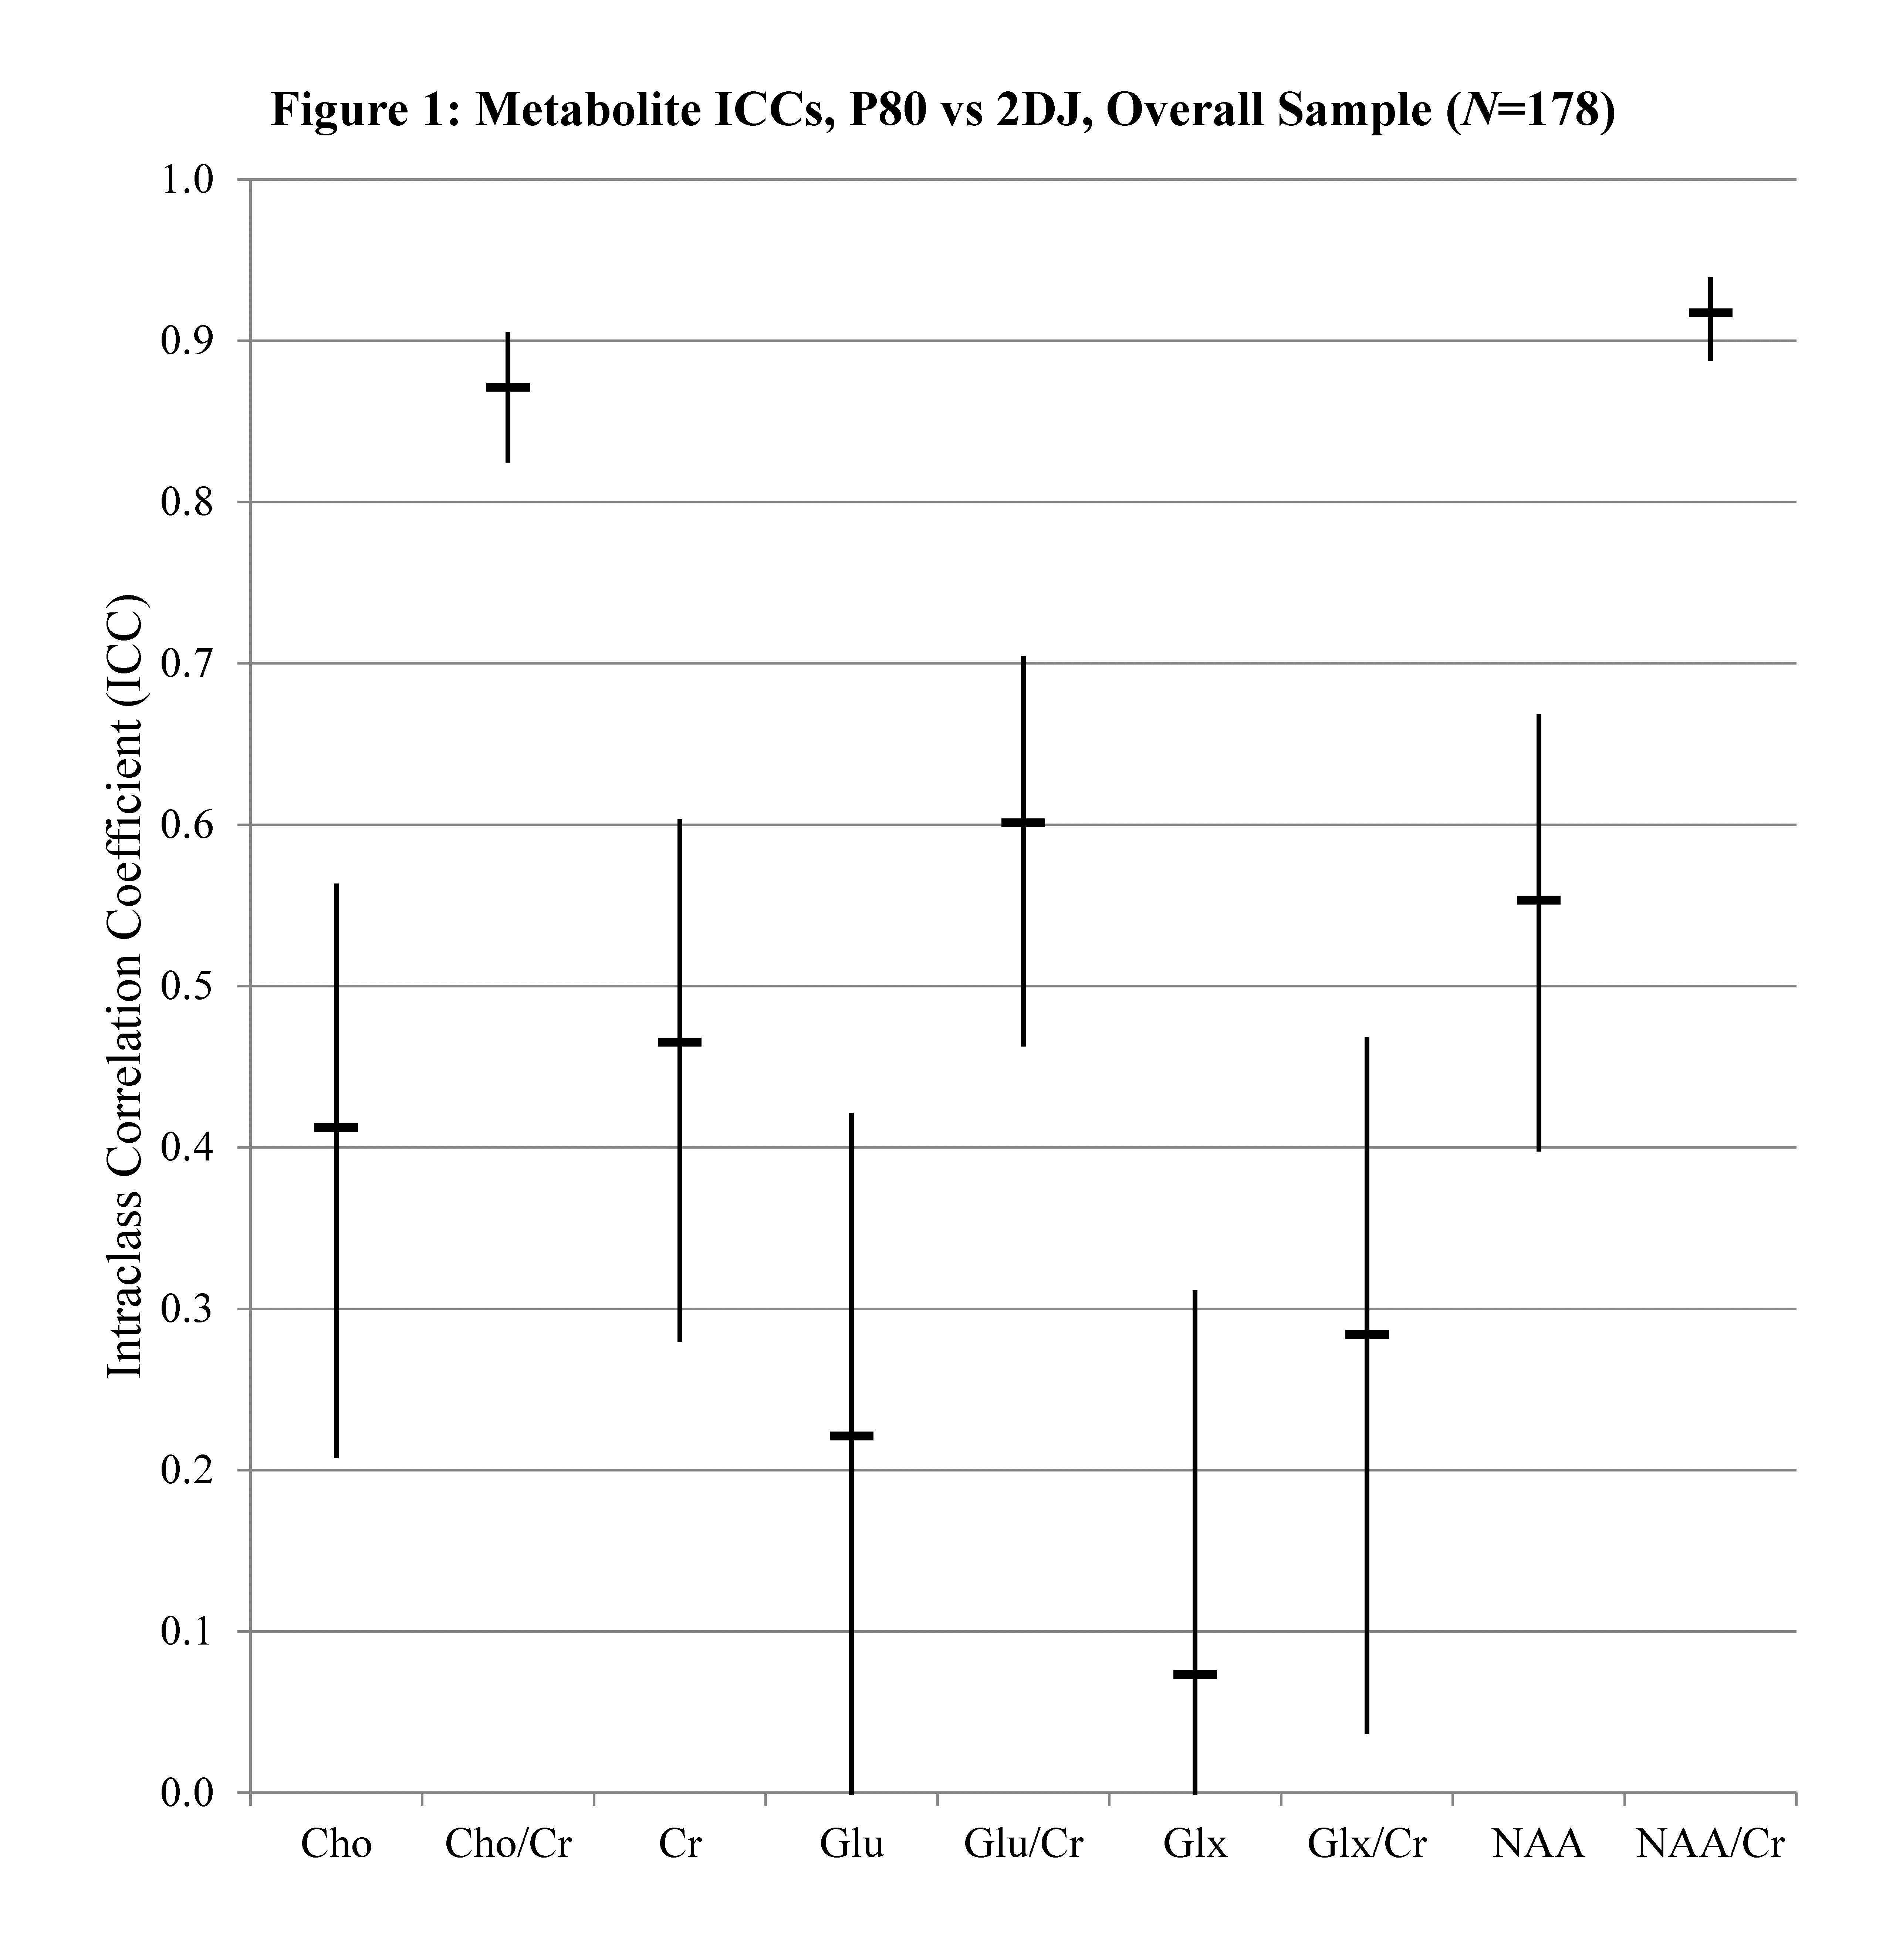
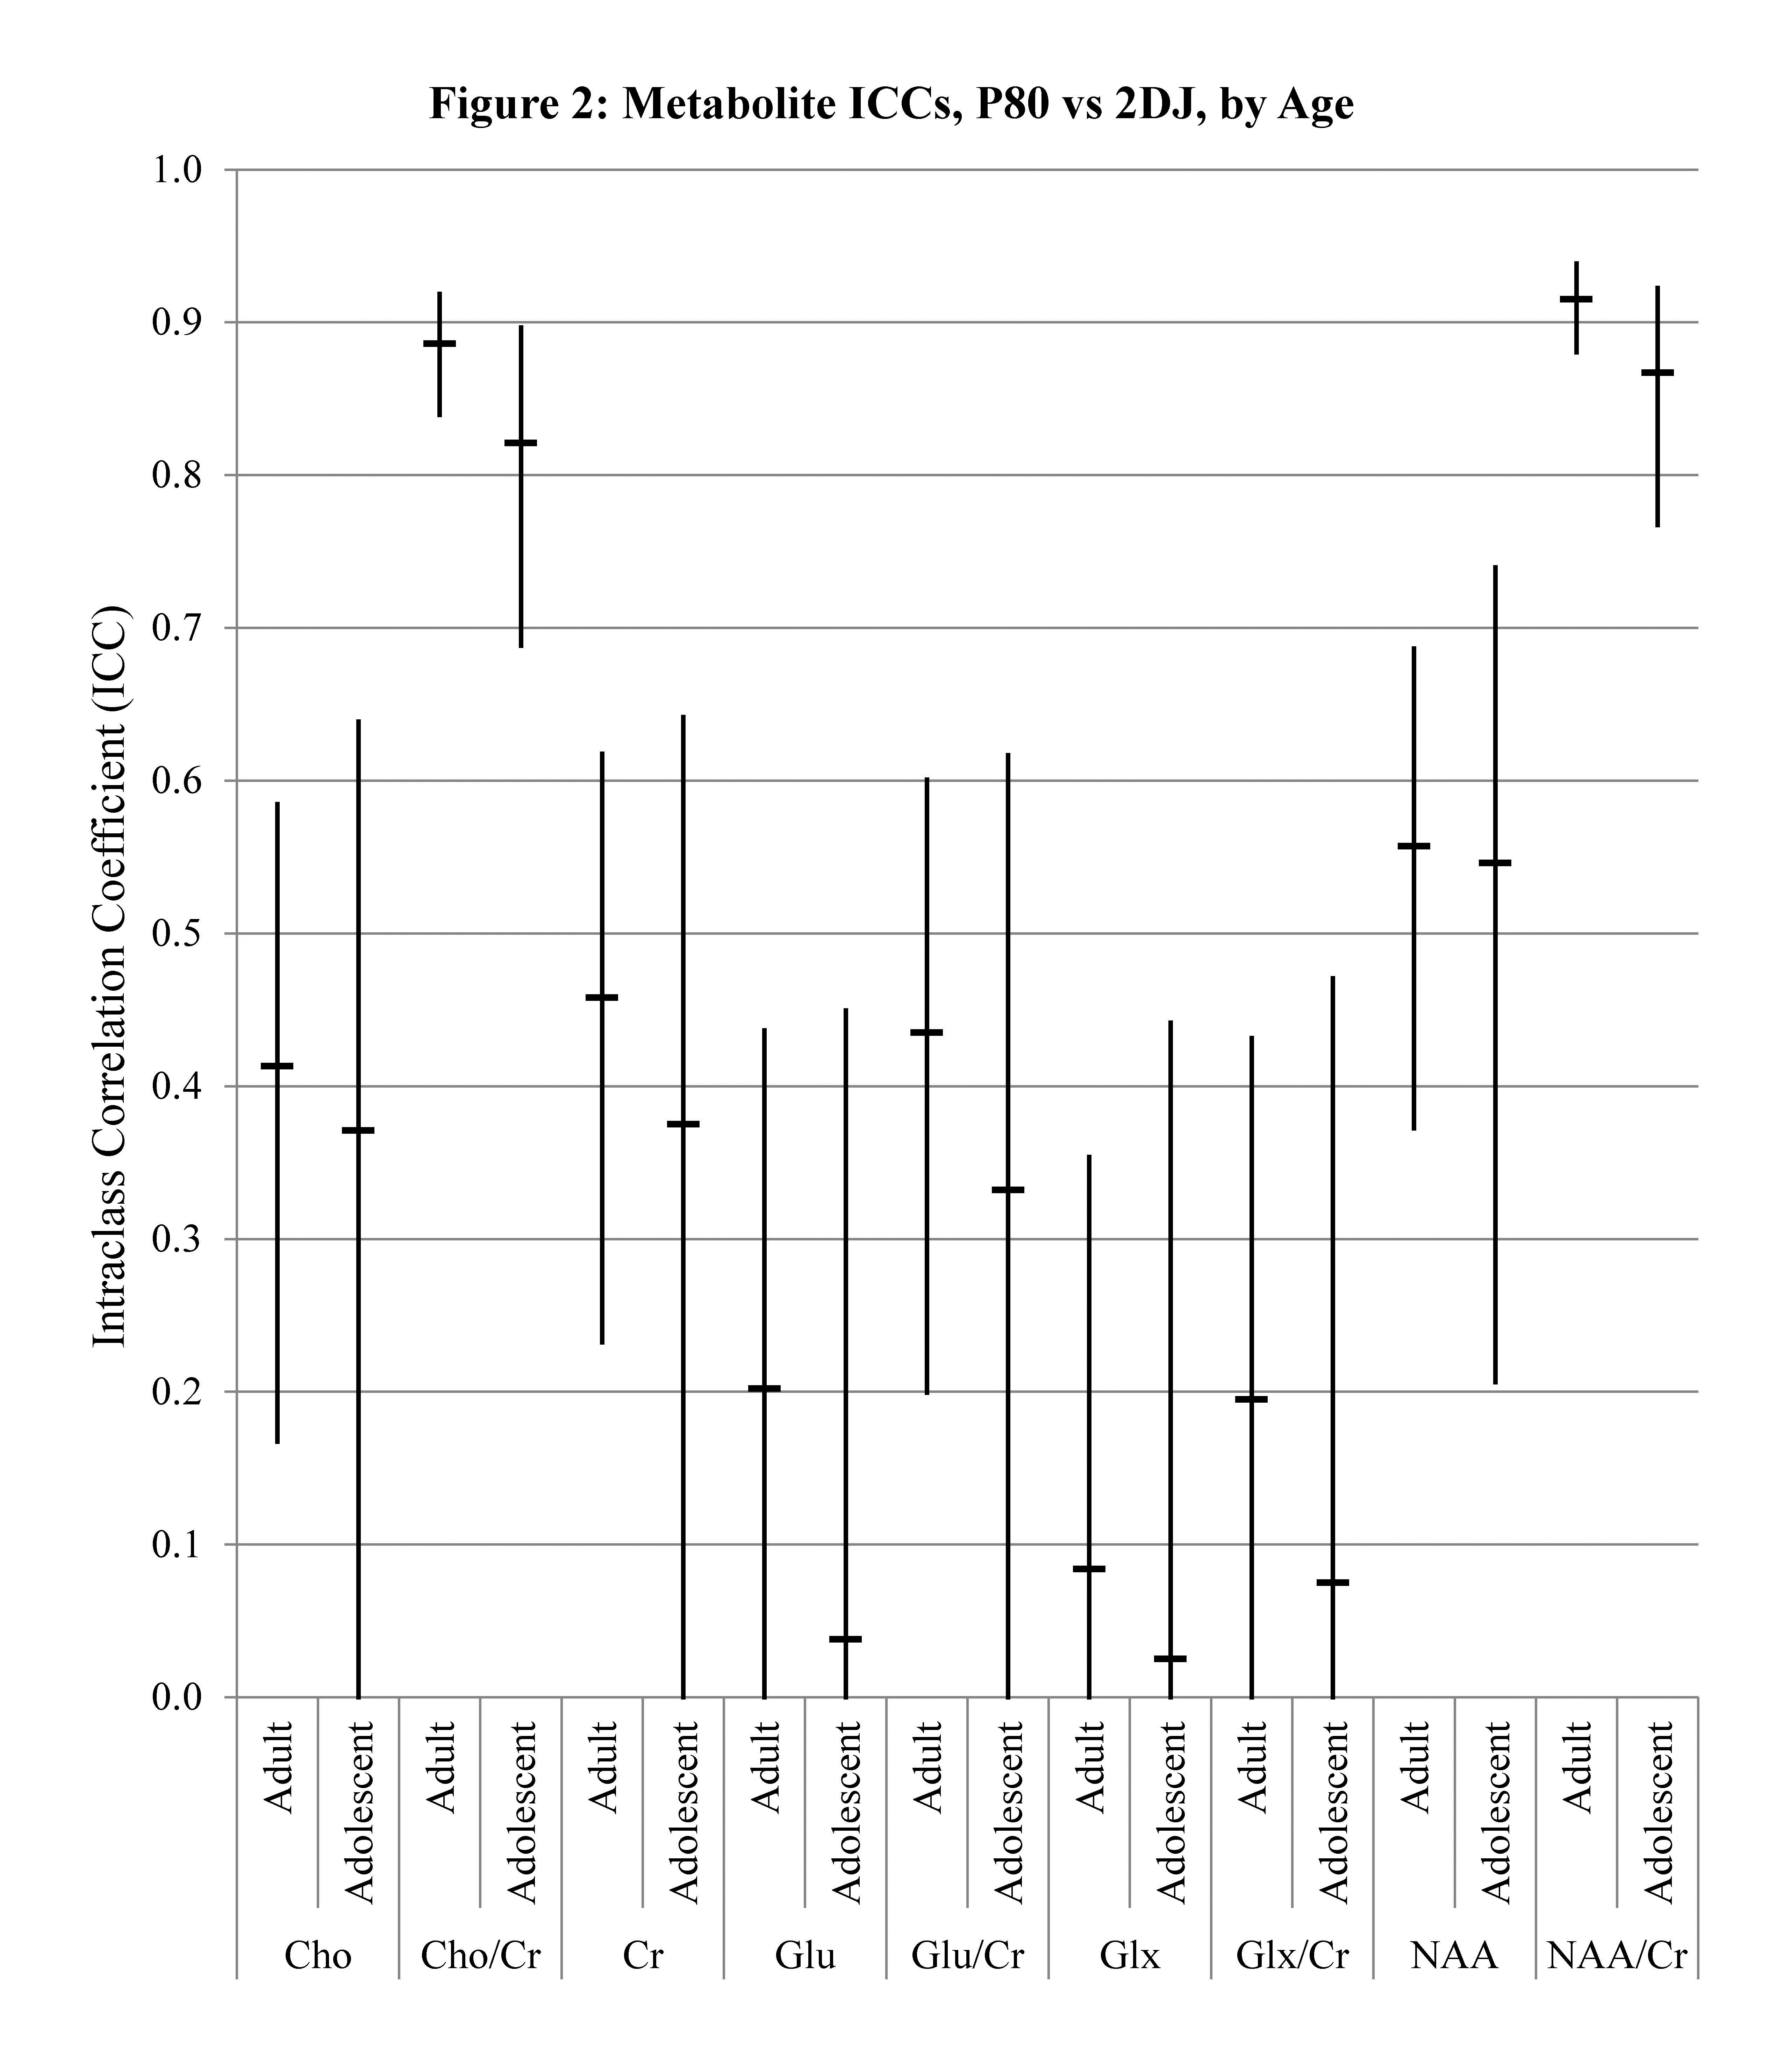
Coefficients of variation for the phantom sphere metabolites were comparable across the three scanners and both sequences, ranging from 0.5-3% for major metabolites (Cho, Cho/Cr, Cr, NAA, NAA/Cr) and slightly higher (2.5-6.5%) for Glu, Glu/Cr, Glx, and Glx/Cr, indicating high precision. In the overall sample of human participants (N=178, Figure 1), the (P80,2DJ)-reliability was high for NAA/Cr (ICC=0.917, 95% CI: 0.889 to 0.938) and Cho/Cr (ICC=0.886, 95% CI: 0.838 to 0.920). The highest-performing glutamatergic measurement was Glu/Cr (ICC=0.601, 95% CI: 0.464 to 0.703), while other metabolite measurements demonstrated poor (P80,2DJ)-reliability (ICCs<0.3). Generally, ICCs were slightly higher for adults than for adolescents (Figure 2), roughly equivalent for female and male subgroups (Figure 3), and higher for the subgroup analyzed with LC Model 6.2-1A than those analyzed with version 6.3-1K (Figure 4).DISCUSSION
Phantom scans indicated high precision, particularly for Cho, Cr, and NAA, with variability comparable to prior studies.5 However, in the human sample, there was poor overall (P80,2DJ)-reliability for the majority of metabolites measured, with the exceptions of Cho/Cr and NAA/Cr. The low ICCs observed between P80 and 2DJ sequences, particularly for Glu, Glu/Cr, Glx, and Glx/Cr, are likely related to the higher variability for these metabolites (up to 6.5% in each sequence), resulting in poor correlation between individual measurements. Although it appears that the ICCs were superior for LCModel 6.2-1A, this may be due to the slightly different clinical subpopulations analyzed with each version. Future work will process all participants’ data with both LCModel versions and compare results. These data highlight the difficulties of comparing findings related to glutamatergic metabolites from 1H-MRS studies utilizing different sequences with high measurement error. While the precision of various sequences can be compared with phantom scans, there are not similar in vivo human standards for establishing sequence accuracy. Additionally, these findings emphasize the difficulties in comparing results from studies utilizing more general spectral sequences to those from studies employing sequences aimed at improving quantification of specific metabolites such as glutamate. The development of new sequences that reduce measurement variability for glutamatergic metabolites will enable more definitive conclusions to be drawn from the comparison of human studies utilizing differing 1H-MRS methodologies.CONCLUSION
These data indicate poor overall correlation between measurements of glutamatergic metabolites in P80 and 2DJ 1H-MRS sequences in a large, clinically and demographically diverse human sample.Acknowledgements
No acknowledgement found.References
1. Schubert F, Gallinat J, Seifert F, Rinneberg H. Glutamate concentrations in human brain using single voxel proton magnetic resonance spectroscopy at 3 Tesla. NeuroImage. 2004;21(4):1762-1771.
2. Adalsteinsson E, Hurd RE, Mayer D, Sailasuta N, Sullivan EV, Pfefferbaum A. In vivo 2D J-resolved magnetic resonance spectroscopy of rat brain with a 3-T clinical human scanner. NeuroImage. 2004;22(1):381-386.
3. Hurd R, Sailasuta N, Srinivasan R, Vigneron DB, Pelletier D, Nelson SJ. Measurement of brain glutamate using TE-averaged PRESS at 3T. Magn Reson Med. 2004;51(3):435-440.
4. Provencher SW. Estimation of metabolite concentrations from localized in vivo proton NMR spectra. Magn Reson Med. 1993;30(6):672-679.
5. Hancu I. Optimized glutamate detection at 3T. J Magn Reson Imaging. 2009;30(5):1155-1162.
Figures
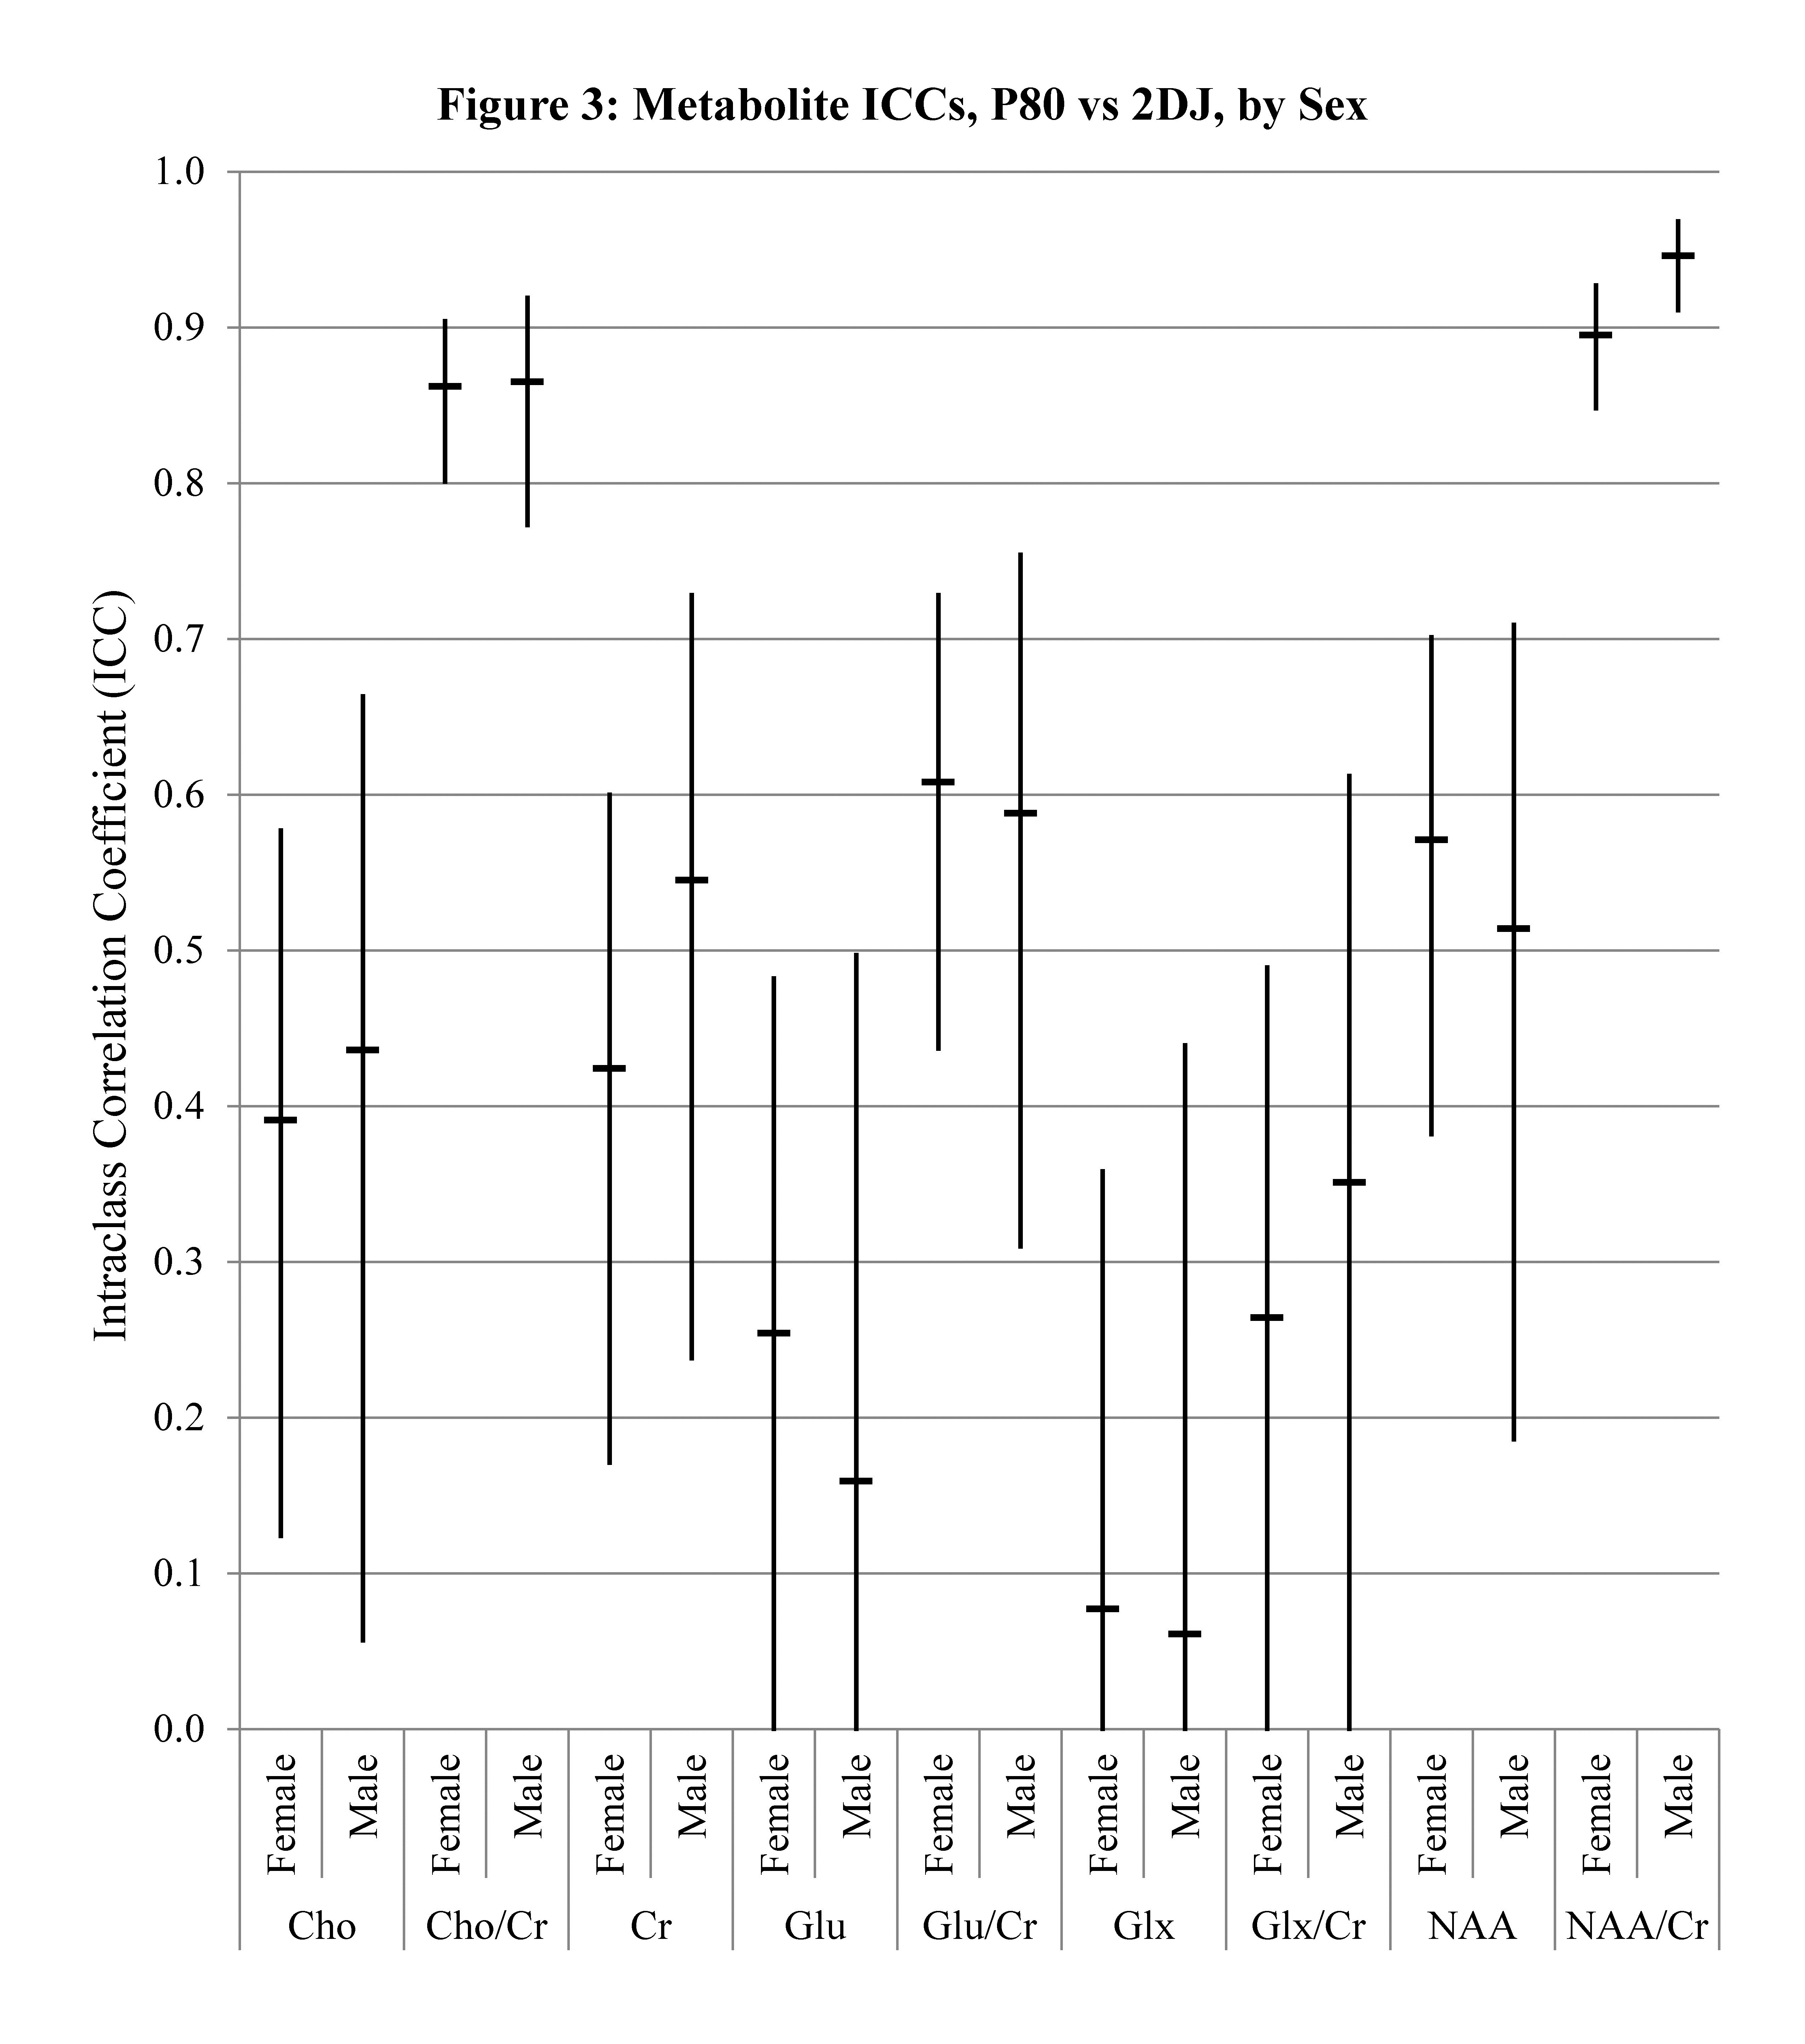
Intraclass correlation coefficients (ICCs) comparing measurements of glutamatergic metabolites in TE-optimized PRESS (P80) and 2-dimensional J-resolved PRESS (2DJ) sequences by sex group (female, n=118; male, n=60). Error bars indicate 95% confidence intervals.
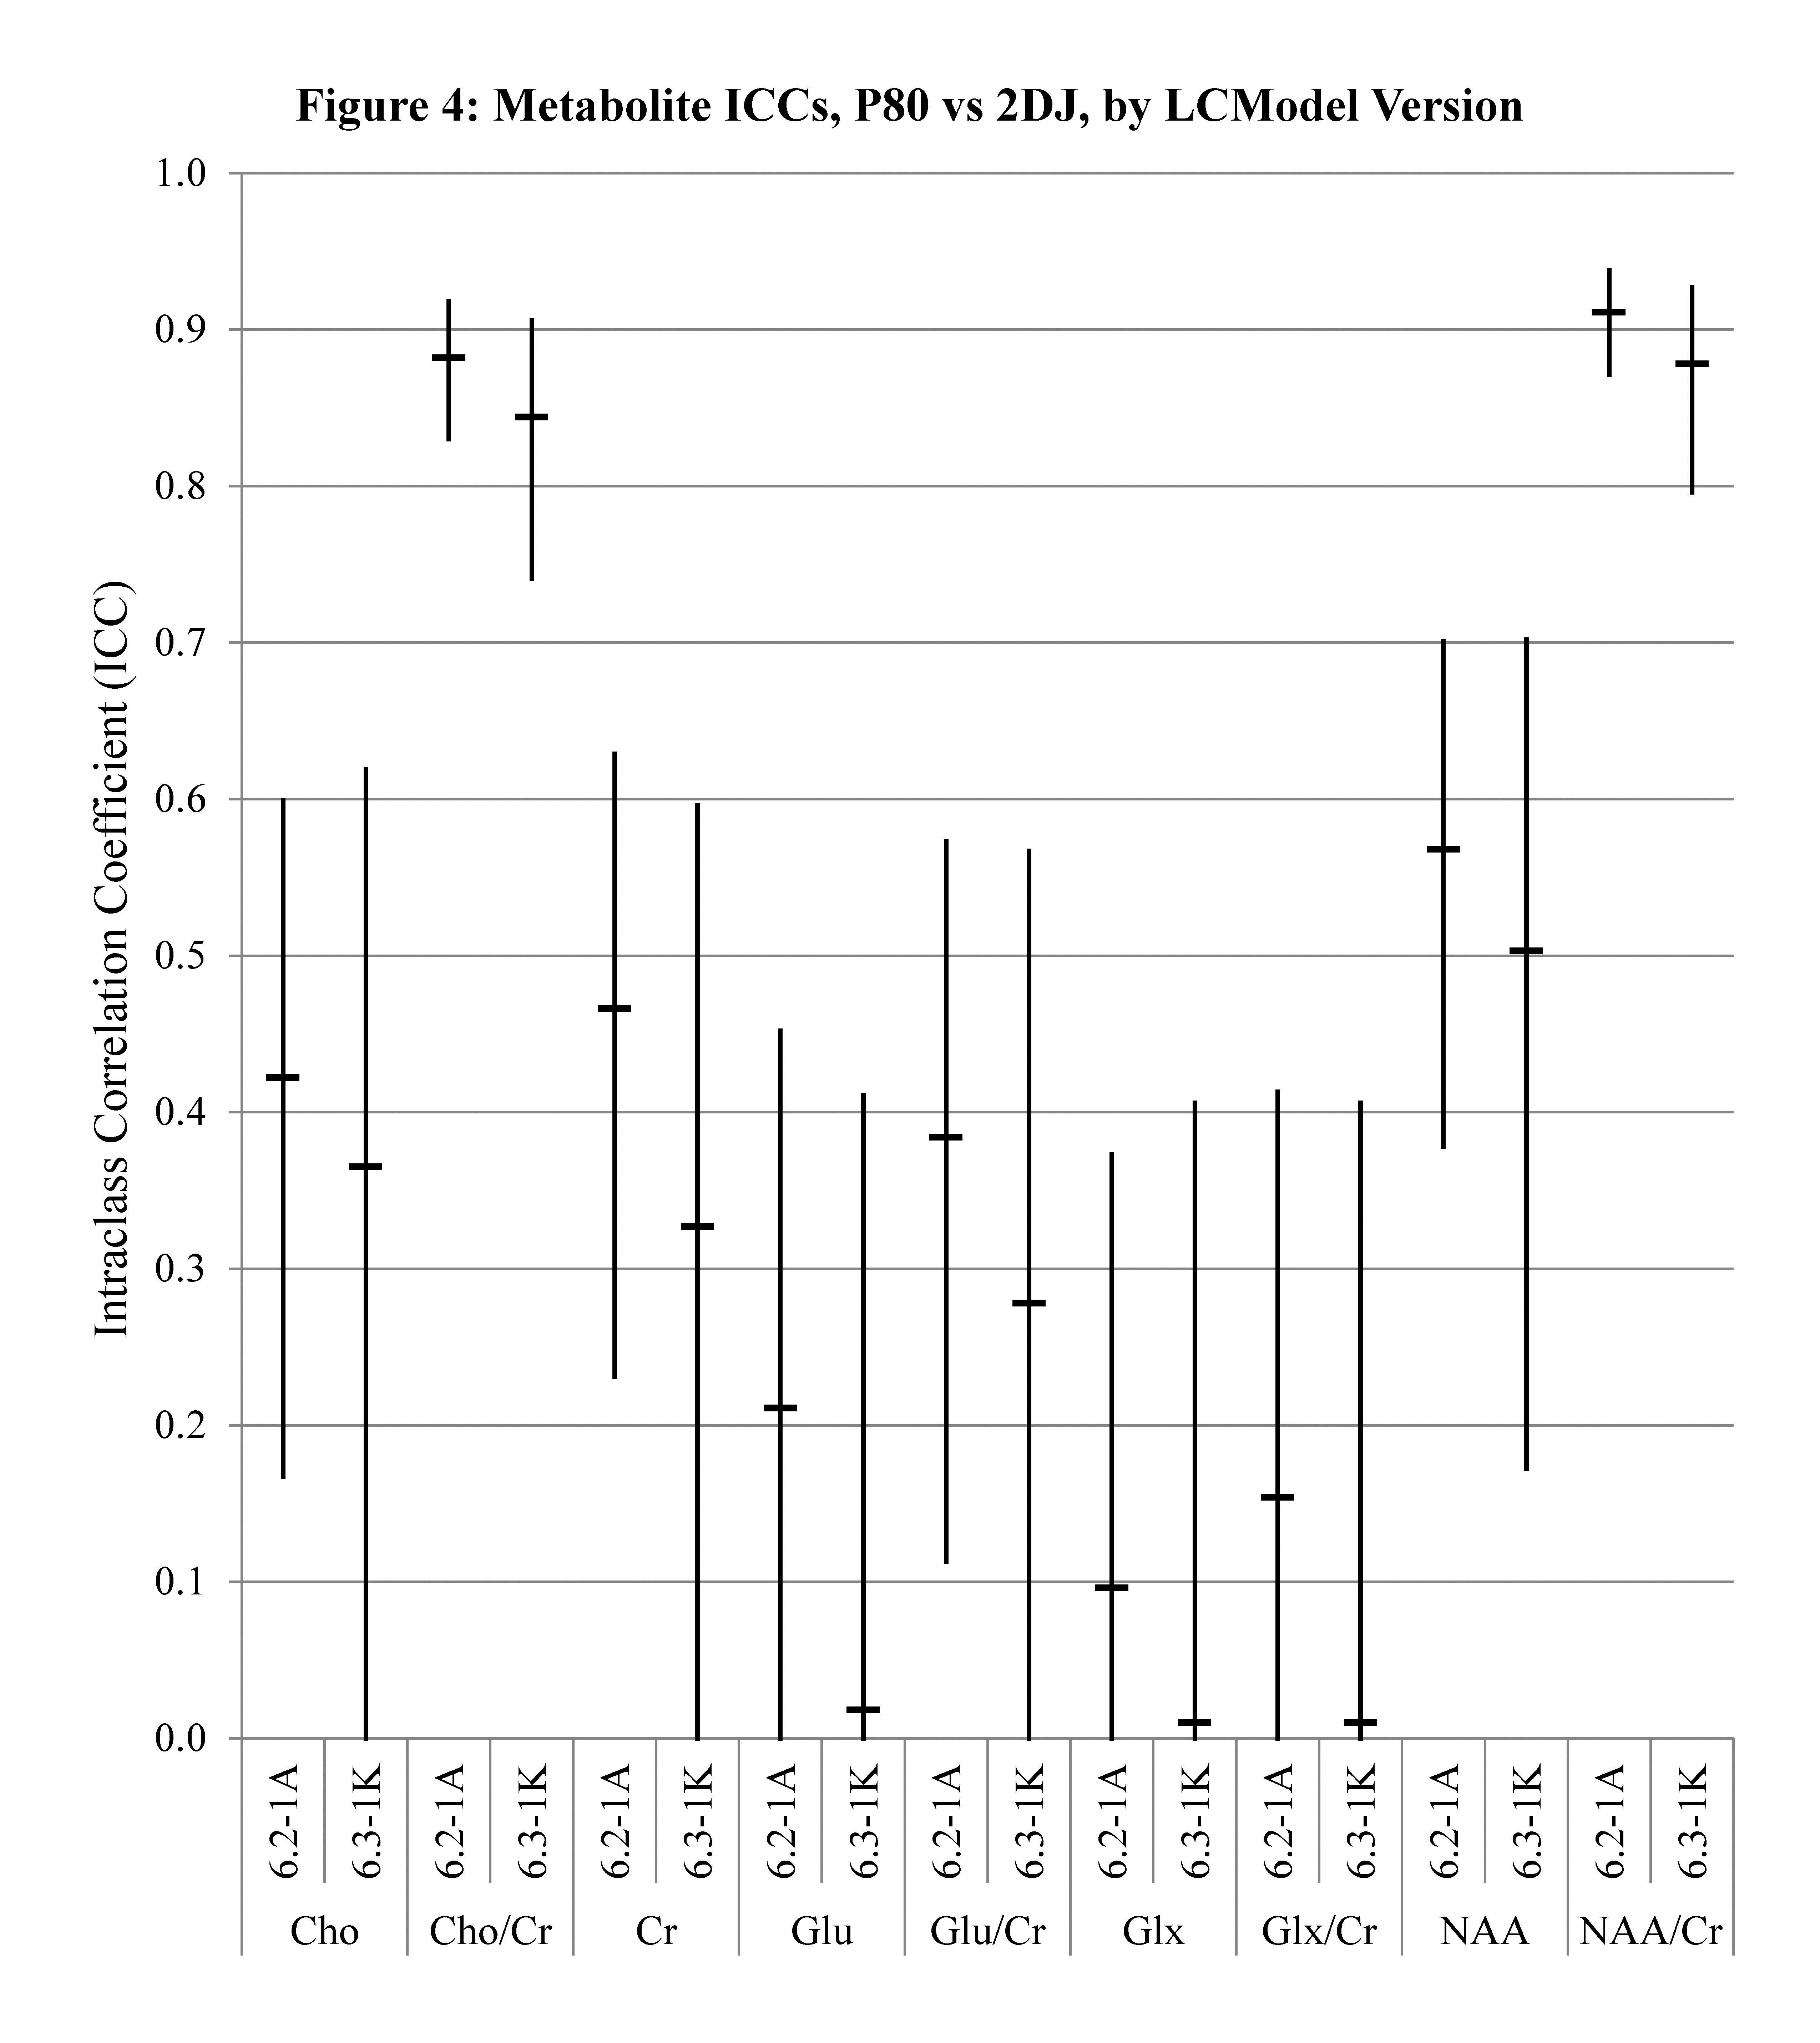
Intraclass correlation coefficients (ICCs) comparing measurements of glutamatergic metabolites in TE-optimized PRESS (P80) and 2-dimensional J-resolved PRESS (2DJ) sequences by subgroups analyzed with LC Model versions 6.2-1A (n=117) and 6.3-1K (n=61). Error bars indicate 95% confidence intervals.