2248
Longitudinal Relaxation times of Macromolecular Resonances at 9.4 T in Human Brain1MRZ, Max Planck Institute for Biological Cybernetics, Tuebingen, Germany, 2IMPRS for Cognitive and Systems Neuroscience, Eberhard-Karls University of Tübingen, Tuebingen, Germany
Synopsis
Longitudinal relaxation times of 13 Macromolecular (MM) resonances are reported for a gray matter rich voxel at 9.4 T for the first time. In addition, a sequence was optimized based on calculated magnetizations from Bloch simulations for combinations of inversion times using a DIR MC-semiLASER. The results from this work highlight the importance of accounting for specific peak relaxations due to the ranging T1 relaxation times of the MM peaks.
Introduction
The T1 relaxation times of the individual peaks of macromolecules (MM) have not yet been reported for any field strength. Previous studies1,2 have characterized the longitudinal relaxation of the MM baseline as a whole and for the peak at 0.93 ppm respectively. In this study, T1 relaxation times for all individual MM resonances are reported for the first time in the human brain at 9.4 T. Along with the T1-relaxation results, a novel double-inversion recovery (DIR) approach was developed that relies on the measurement of data utilizing several varying combinations of the two inversion delays, and ending with signals fitted to a four-parameter relaxation model.Methods
Bloch simulations (Figure 1) for DIR sequence with several combinations of TI1 and TI2 (assuming MMs and metabolites T1 relaxation time from Murali-Manohar et al.,3 and Deelchand et al.,4 respectively) were performed, and those combinations (Table 1) for which the metabolites were considerably nulled were chosen. All data were acquired on a 9.4T Magnetom, Siemens. Four healthy volunteers participated in this study after signed consent. MC-semiLASER5 with DIR was used with TE = 24 ms, NEX = 32, TR = 8000 ms3. TI1 and TI2 were varied according to the table in figure 1 to acquire a set of macromolecular spectra with different degrees of saturation. Simulated Voigt lines were created for the MM peaks and all the data were fitted in LCModel-v6.36.
Care was taken to fit the residual metabolites in the spectra by inclusion of narrow lineshapes to represent NAAacetyl, -CH3 tCr, -CH2 tCr, and GPC in varying combinations across the inversion series. A simulated metabolite basis set, created with VeSPA7, was used to account for the metabolite signals in the minimum signal MM spectra acquired with TI1/TI2 = 1050/238 ms.
The signal $$$S$$$ acquired were fitted to a four-parameter bi-exponential model using the DIR signal equation:
$$S = a(1-2e^{\frac{-TI_{2}}{T_{1}}}+2e^{\frac{-(TI_{1}+TI_{2})}{T_{1}}}),\\ a\equiv\frac{\rho}{4kT\cdot R\cdot BW}$$
where $$$a$$$ is a constant with $$$\rho$$$ being the effective spin density, $$$k$$$ being the Boltzmann constant, $$$T$$$ being temperature, $$$R$$$ being the effective resistance of the coil while loaded, and $$$BW$$$ being the bandwidth of the receiver.
Results
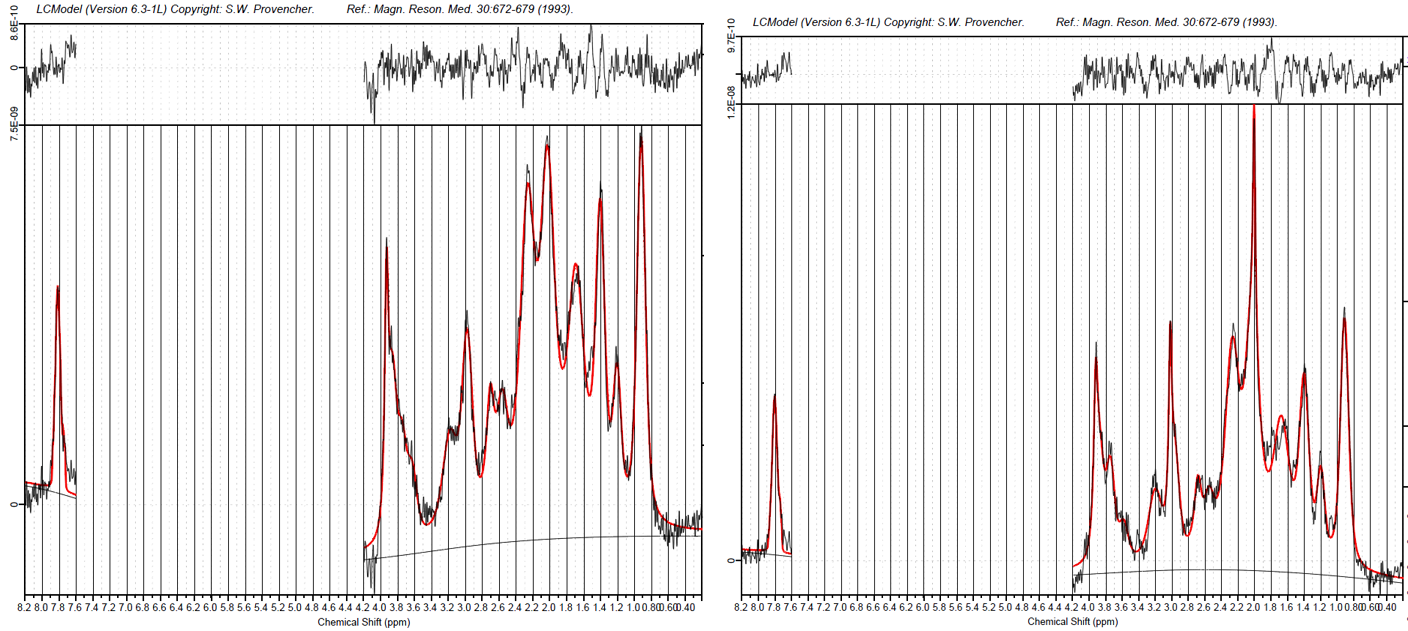
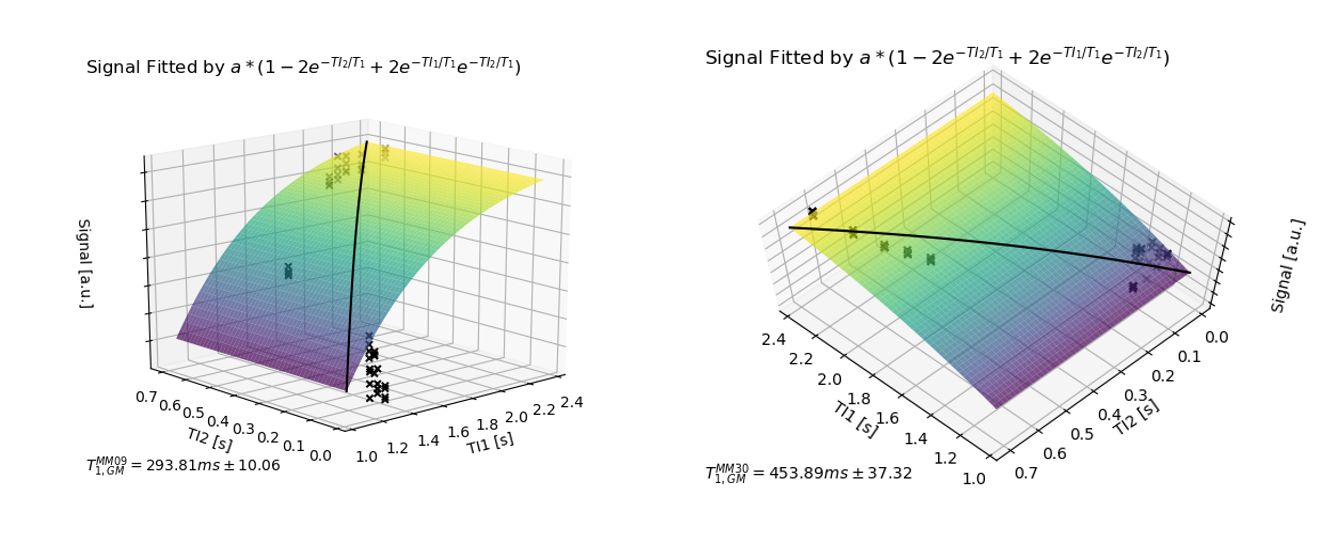
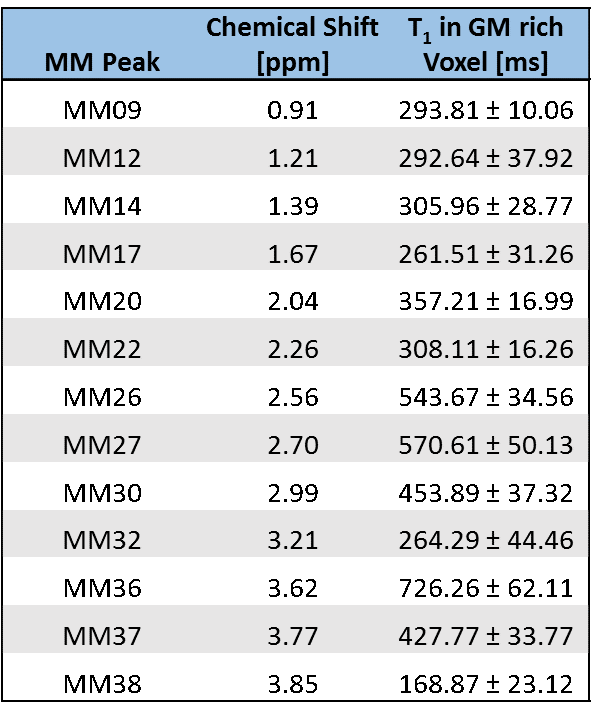
Majority metabolite-nulled spectra were obtained, for the chosen TI1/TI2 combinations, (Figure 2) encompassing a range of magnetizations (Figure 1). Figure 3 shows fit and residue from LCModel for TI1/TI2 = 2360/625 and 1800/525 ms. Concentration values from LCModel were fit by the signal equation mentioned above using a linear model curve fitting optimization from the SciPy8 toolkit in Python(v2.7)9 and figures were created using matplotlib library10. The fitting of the peak intensities is shown in figure 4 with the surface representing the signal’s fit to the model; the solid line represents the trajectory from the negative to positive magnetization. The resulting T1 relaxation times of the macromolecular peaks are reported in Table 1.Discussion
Typically, the MM influence in metabolite spectra is handled as a whole ‘baseline’ and assumed to decay at the same rate with regard to T1 and T2 relaxation. The results from this work highlight the importance of accounting for peak specific T1 relaxation times of the MM peaks ranging from approximately 150 ms to 750 ms.
For certain inversion time combinations, metabolite residuals appeared as a contributor to the spectra. Reliable HSVD was typically not achievable, especially for the ppm range of 3.6-4.1ppm, potentially because of the broad linewidths encountered and low SNR. Therefore, these residuals were handled with peak fitting in LCModel by simulating narrow lineshapes to account for metabolite contributions to the MM spectra.
Correcting for the MM baseline in a metabolite spectrum has always posed a challenge. The T1 relaxation times of the individual MM peaks help us predict their behavior better and hence, aid us to adopt the model of the MM contribution to specific flip angle and repetition time combinations when fitting metabolite spectra.
Conclusion
T1 relaxation times of all the individual macromolecular peaks between 0 and 4.0 ppm are reported for the first time. To that, a novel method for measuring the MM peak T1-relaxation times is reported which exploits a varying TI scheme for a DIR-MC-semiLASER sequence. Gathering information regarding MMs is important for determining their role in pathophysiology, and having knowledge of their relaxation times also enable absolute quantification of these peaks. Further work includes gathering more subjects to strengthen results; as well as to measure voxels in WM regions as it has been noted that MM concentrations vary between WM and GM tissue.Acknowledgements
Funding by the European Union (ERC Starting Grant, SYNAPLAST MR, Grant Number: 679927 and Horizon 2020 Health call project grant, CDS-QUAMRI, Grant Number: 634541) is gratefully acknowledged. Special thanks to Cristina Cudalbu, Małgorzata Marjańska, and Wolfgang Bogner for helpful conversations through this work.References
1. Xin L, Schaller B, Mlynarik V, Lu H, Gruetter R. Proton T1 relaxation times of metabolites in human occipital white and gray matter at 7 T. Magnetic resonance in medicine. 2013 Apr;69(4):931-6.
2. Behar KL, Rothman DL, Spencer DD, Petroff OA. Analysis of macromolecule resonances in 1H NMR spectra of human brain. Magnetic Resonance in Medicine. 1994 Sep;32(3):294-302.
3. Murali-Manohar S, Wright AM and Henning A (October-2018): Challenges in estimating T1 Relaxation Times of Macromolecules in the Human Brain at 9.4T, MRS Workshop 2018 Metabolic Imaging, Utrecht, The Netherlands.
4. Deelchand DK, Van de Moortele PF, Adriany G, Iltis I, Andersen P, Strupp JP, Vaughan JT, Uğurbil K, Henry PG. In vivo 1H NMR spectroscopy of the human brain at 9.4 T: initial results. Journal of Magnetic Resonance. 2010 Sep 1;206(1):74-80.
5. Giapitzakis IA, Kreis R, Henning A. Characterization of the macromolecular baseline with a metabolite-cycled double-inversion recovery sequence in the human brain at 9.4 T.
6. Provencher SW. Estimation of metabolite concentrations from localized in vivo proton NMR spectra. Magnetic resonance in medicine. 1993 Dec;30(6):672-9.
7. Soher BJ, Semanchuk P, Todd D, Steinberg J, Young K. VeSPA: integrated applications for RF pulse design, spectral simulation and MRS data analysis. InProc Int Soc Magn Reson Med 2011 (Vol. 19, p. 1410).
8. Jones E, Oliphant E, Peterson P, et al. SciPy: Open Source Scientific Tools for Python, 2001-, https://www.scipy.org.
9. G. van Rossum, Python Tutorial, Technical Report CS-R9526, Centrum voor Wiskunde en Informatixa (CWI), Amsterdam, May 1995.
10. John D. Hunter. Matplotlib: A 2D Graphics Environment, Comuting in Science & Engineering, 9, 90-95 (2007), DOI:10.1109/MCSE.2007.53
11. Pfeuffer J, Tkáč I, Provencher SW, Gruetter R. Toward an in vivo neurochemical profile: quantification of 18 metabolites in short-echo-time 1H NMR spectra of the rat brain. Journal of magnetic resonance. 1999 Nov 1;141(1):104-20.
12. Giapitzakis IA, Avdievich N, Henning A. Characterization of macromolecular baseline of human brain using metabolite cycled semi‐LASER at 9.4 T. Magnetic resonance in medicine. 2018 Aug;80(2):462-73.
Figures