2247
Relaxation corrected and Sequence-dependent Macromolecule Baseline Model1MRZ, Max Planck Institute for Biological Cybernetics, Tuebingen, Germany, 2IMPRS for Cognitive and Systems Neuroscience, Eberhard-Karls University of Tübingen, Tuebingen, Germany
Synopsis
In short echo time spectroscopy sequences macromolecular signals may strongly influence the quantification of metabolite spectra they underlay. In this work we present a method for simulating a MM basis set that is tailored toward chosen sequences and sequence parameters with the aim to improve the accuracy of metabolite measurements in vivo. We show that utilizing a simulated macromolecule basis set while considering the relaxation behavior of individual macromolecular resonances can produce metabolite quantification results of similar quality to that of a dedicatedly measured MM basis set when applied to the same spectra of interest.
Introduction
In short echo time (TE) acquired spectra, broad macromolecular (MM) resonances affect the measured signal intensity and can lead to over-estimation of metabolite concentrations. These MM resonances pose a challenge in correcting for their influence on metabolite spectra during spectral fitting. Herein we propose a method for creation of simulated, sequence parameter-specific MM basis sets by utilizing information from Bloch simulations and experimental T1 and T2-relaxation time measures. The goal of this work was to tailor MM basis sets for varying localization schemes and sequence parameters, and thus, to better account for MM resonances during spectral fitting of metabolite spectra that display MM contribution in a time-efficient manner.Methods
Voigt lines were simulated by taking into account T2-relaxation of MM peaks1 in order to estimate the minimum FWHM of Voigt line-shapes. The lines were then normalized to the amplitude of their respective maxima. A MM baseline, acquired with double inversion recovery (DIR) metabolite cycled-(MC)-semiLASER2 (TI1/TI2/TE/TR = 2360/625/24/8000ms), was used as prior information to scale the amplitudes of each peak and to position the center of the Voigt lines. See figure 1 for a workflow diagram.
Bloch simulations were performed using T1- and T2-relaxation times of individual macromolecular peaks1,3 for the same DIR-semiLASER sequence and the relative magnetization (Mz/M0) were calculated for each peak. Voigt lines were then scaled to yield theoretical MM spectra without relaxation effect:
$$Spectrum_{MM,\,non-relaxed} = \Sigma^{N=13}_{i=1}(\frac{MM^{i}_{baseline,\,prior}}{Relaxation_{DIR}})$$
The calculated relaxation free spectrum was then attenuated considering TE and TR of a chosen localization scheme and T1 and T2 relaxation times of individual macromolecular peaks to simulate the MM baseline underlying experimental metabolite spectra.
$$Spectrum_{MM,\,final} = Relaxation_{sequence} \cdot Spectrum_{MM,\,non-relaxed}$$
The simulated MM baseline spectra were Fourier transformed into a FID and read in as a basis vector in LCModel (v-6.3)4 to accompany the fitting of in vivo acquired metabolite spectra.
DIR-MC-semiLASER sequence was used to validate this strategy by direct comparison of a simulated relaxation corrected MM baseline model against an experimentally acquired MM spectrum for identical sequence parameters. Both the simulated and the experimental MM baseline model were also used for metabolite quantification of a MC-semiLASER acquisition with (TE/TR = 24/6000ms) (Figure 3).
Further simulations were created for data with varying inversion times of an IR-MC-STEAM sequence (TI = 20, 100, 400, 700, 1000, 1400, 2500 ms and validated against respective experimental results5 (Figure 4).
Simulating MM baselines was done for GM-rich regions; as the longitudinal relaxation times available during this work was acquired in a GM rich region3.The VeSPA6 simulation tool was used for creation of metabolite basis vectors.
Results
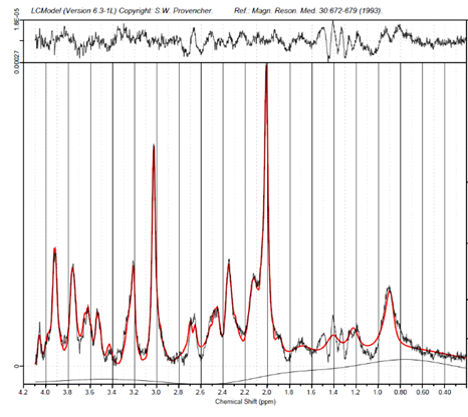
Figure 2 shows a comparison between simulated and experimentally acquired MM baseline for a MC-semiLASER sequence. Furthermore, figure 3 shows the fit comparison of a simulated baseline and an experimentally acquired MM baseline to data acquired with a MC-semiLASER sequence (TE/TR = 24/6000ms). Figure 5 shows the fit of the simulated MM baseline to an acquisition with an IR-MC-STEAM (TE/TM/TR = 8/50/10000ms) for TI = 20.Discussion
Comparison of spectra in figure 3 show minor differences between the simulated (left) and experimentally acquired (right) MM baselines for fitting to the aforementioned semiLASER acquisition. Fit reliability is improved for fitting the MM resonances underlying NAA and NAAG as well as for the spectral prior to -CH3 of tCr at approximately 2.8ppm. The region encompassing 1.1-1.8ppm is prone to have lipid resonances; with the experimentally acquired MM baseline LCModel fitted more lipids, while with the simulated MM baseline, LCModel fitted lesser lipid resonances indicating that MMs in this range are well accounted for with the simulated MM baseline. The experimentally acquired baseline fitted MM09 better than the simulated model and also fitted the resonance 3.65ppm better. This discrepancy is likely from errors in T2-measurements that were used in determination of simulated MM Voigt lines.
In figure 4, relaxation corrected spectra show how MM contribution changes significantly dependent on inversion time chosen for an IR-MC-STEAM acquisition. Thus, it is important to account for individual MM contributions to spectra in order to reliably quantify the signal of spectra acquired with short TE. Applying a simulated basis set to IR-MC-STEAM data of varying TIs (figure 5) shows promise in accounting for underlying MM resonances.
Conclusion
Herein a model has been presented to simulate MM resonances at 9.4T to further improve quantification on in vivo acquired data where short TEs are applied. Furthermore, applying simulated MM baselines will likely produce more accurate quantification results for metabolite spectra, and can further be applied to IR spectra, as in Wright et al.,5 where the TI series produced variable components of MM and must be handled individually.Acknowledgements
Funding by the European Union (ERC Starting Grant, SYNAPLAST MR, Grant Number: 679927 and Horizon 2020 Health call project grant, CDS-QUAMRI, Grant Number: 634541) is gratefully acknowledged. Special thanks to Tamas Borbath for help in this work.References
1. Borbath T, Murali Manohar S and Henning A (October-2018): Estimation of Tp2 Relaxation Times of Macromolecules in Human Brain Spectra at 9.4 T, MRS Workshop 2018 Metabolic Imaging, Utrecht, The Netherlands.
2. Giapitzakis IA, Avdievich NI and Henning A (August-2018) Characterization of macromolecular baseline of human brain using metabolite cycled semi-LASER at 9.4T Magnetic Resonance in Medicine 80(2) 462-473.
3. Murali-Manohar S, Wright AM and Henning A (October-2018): Challenges in estimating T1 Relaxation Times of Macromolecules in the Human Brain at 9.4T, MRS Workshop 2018 Metabolic Imaging, Utrecht, The Netherlands.
4. Provencher SW. LCModel & LCMgui user’s manual. LCModel Version. 2014 Jun 15:6-2.
5. Wright AM, Murali Manohar S and Henning A (October-2018): Longitudinal Relaxation Times of 5 Metabolites in vivo at 9.4T: preliminary results, MRS Workshop 2018 Metabolic Imaging, Utrecht, The Netherlands.
6. Soher BJ, Semanchuk P, Todd D, Steinberg J, Young K. VeSPA: integrated applications for RF pulse design, spectral simulation and MRS data analysis. InProc Int Soc Magn Reson Med 2011 (Vol. 19, p. 1410).
Figures
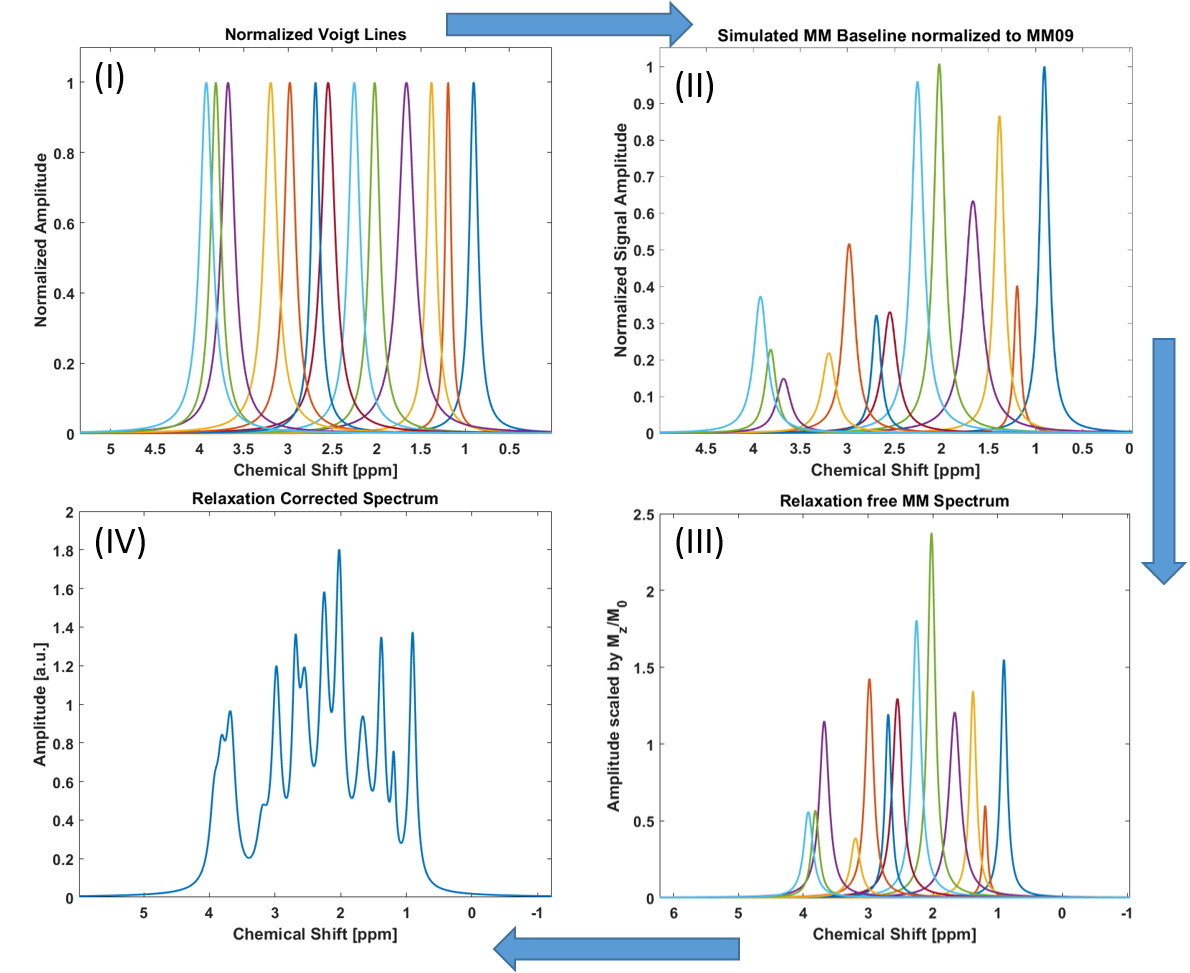
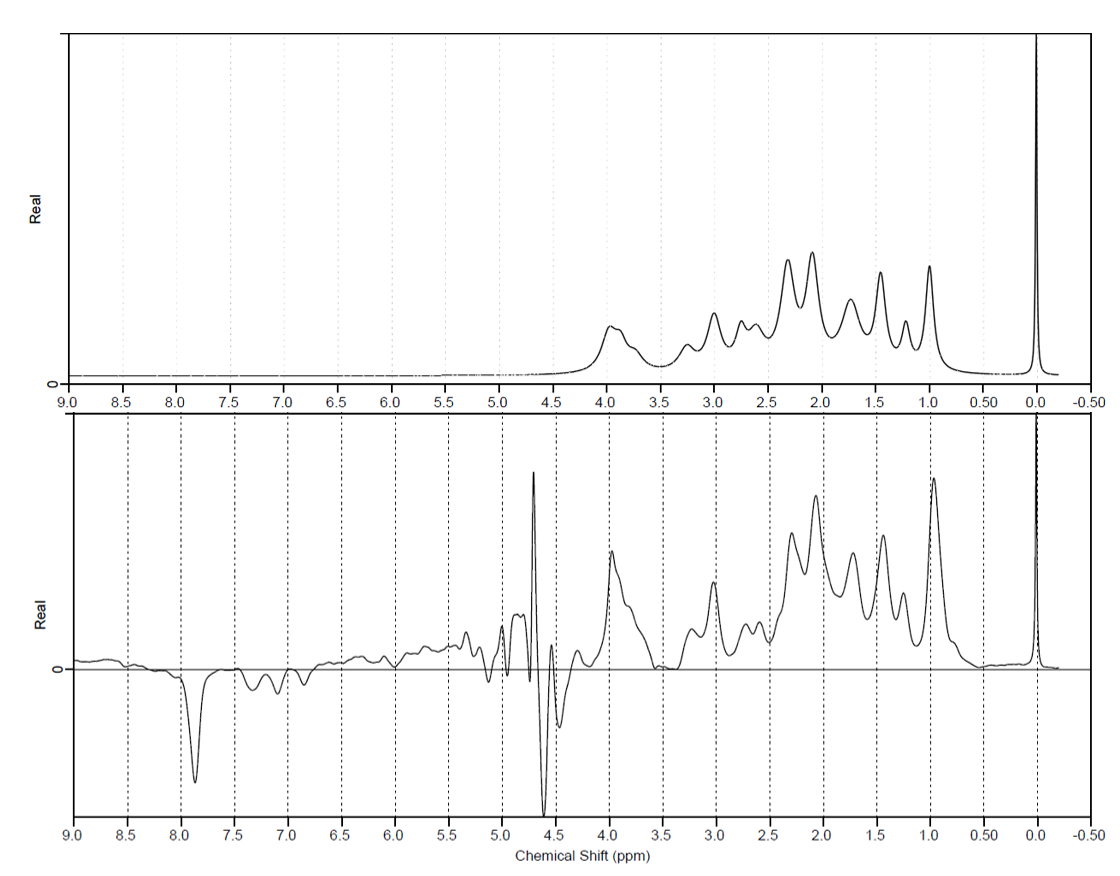
Figure 2 top: a simulated MM baseline for a DIR-MC-semiLASER sequence using TE/TR = 24/6000ms and TI1/TI2 = 2360/625ms.
Figure 2 bottom: an experimentally acquired MM baseline with the same DIR-MC-semiLASER sequence. The bottom image shows a strong residual peak from creatine at 3.925ppm. The differences in the lineshapes between both spectra could be due to the errors in the T2 values.
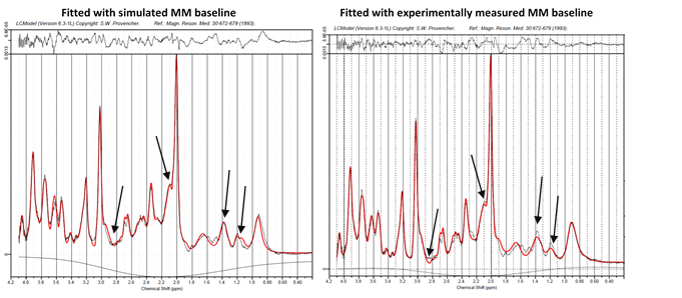
Figure 3 left: a relaxation corrected simulated MM baseline model was used in the LCModel fit of metabolite spectra of a MC-semiLASER sequence acquired in vivo with TE/TR = 24/6000ms.
Figure 3 right: an experimentally acquired MM baseline used in the LCModel fit for the same in vivo acquired MC-semiLASER data. Points of interest are marked with arrows where there appear to be significant differences in the fitting routine dependent on which baseline was used.
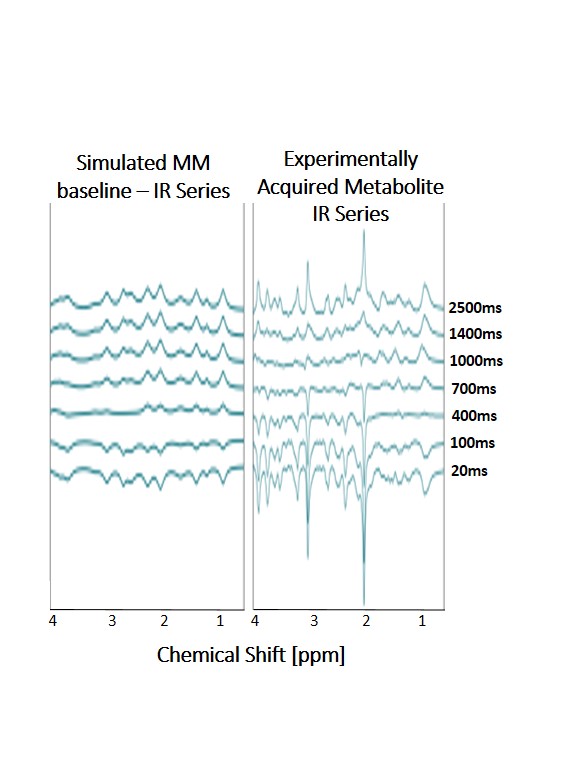
Figure 4 left: simulated MM inversion series for an IR-MC-STEAM protocol used at 9.4T for measuring the T1-relaxation of metabolites5. Due to the relaxation effect of the MM the use of a relaxation corrected MM baseline model may provide more accurate results of metabolite T1-relaxation times.
Figure 4 right: respective IR-MC-STEAM series to determine metabolite T1 relaxation times.