2246
An Analysis of 1H Metabolite Residuals in an Acquired Macromolecule Spectrum1Psychiatry, Dalhousie University, Halifax, NS, Canada, 2Biomedical Translational Imaging Center, IWK Health Center, Halifax, NS, Canada, 3Physics and Atmospheric Sciences, Dalhousie University, Halifax, NS, Canada, 4Diagnostic Radiology, Dalhousie University, Halifax, NS, Canada, 5Nova Scotia Early Psychosis Program, Nova Scotia Health Authority, Halifax, NS, Canada
Synopsis
Macromolecules underly the metabolites in short-TE 1H magnetic resonance spectroscopy and must be accounted for in a quantitative analysis. One method is to acquire a metabolite-nulled spectrum and use it to account for macromolecules in fitting; however, since metabolites have a range of T1, metabolite-nulling is incomplete and leaves residuals. We introduce a new metabolite cleaning method with 2 metabolite-nulling schemes, single inversion and double inversion, and use it to examine the estimated metabolite residuals, finding that even with double-inversion nulling, there are substantial metabolite residuals of 10-35% in the macromolecule spectrum.
Introduction
Macromolecules (MM) underly the 1H spectrum acquired in brain at short-TE and must be accounted for in accurate quantitative magnetic resonance spectroscopy (MRS)1. Methods have been developed to deal with MMs including using mathematical models2, truncating the initial signal3, and acquiring a metabolite-nulled spectrum4. These methods have been compared to each other2,3. Important to clinical research, MM variations between illness states and healthy states has not been systematically studied1. This is important to pursue as, for example, we were planning a study involving schizophrenia subjects. Thus we are choosing to acquire a metabolite-nulled spectrum for each subject. Metabolite-nulling, however, results in metabolite residuals, often removed by fitting residuals in HLSVD5 and with AMARES6. We present here a method suited to subtracting an individual macromolecule spectrum from full (metabolites+MM) spectrum. We have developed a modified residual metabolite cleaning method, assessing the residual metabolite contribution to the quantitation according to a single inversion (SI) and double inversion (DI) nulling acquisition.
Methods
Data were acquired as part of a 1H MRS study of white matter in schizophrenia7. Ethics approval was obtained from the National Research Council of Canada Research Ethics Board and the Capital District Health Authority Research Ethics Board.
In order to ascertain the method’s effectiveness, we acquired macromolecules using SI or DI in healthy controls. We expected that the metabolite quantities would differ between methods but not after residual cleaning. Samples for this study consisted of a) DI: 20 participants, mean age 25.9 years/3.8 SD and b) SI: 41 participants, mean age 25.1 years/3.5 SD.
MRS data acquisition and processing occurred as per previous work4,7 including: high field strength (4T), a 45x11x13 mm voxel positioned largely in white matter, LASER sequence with metabolite-nulling preparation module, TIs of 0.68s SI, and 2.2s and 0.68 s DI, collecting 384 averages of full and metabolite-nulled spectrums in alternating manner, processing using FitMAN8,9, and subtracting the acquired macromolecule spectrum from the full spectrum.
The fitted spectrum was taken as an initial estimate of metabolite amplitudes and put into a T1-weighting model according to the SI or DI acquisition and according to standard equations. These calculations were done in MATLAB and scripts are available at https://github.com/dmcallindon/MacromolCorrect. The T1-weighted model was subtracted from the metabolite-nulled acquisition, resulting in a corrected macromolecule spectrum. The procedure flowchart is illustrated in Figure 1. The T1-weighting required T1 for each of the 19 metabolites in the FitMAN basis set (Table 1).
The fit results were imported into a spreadsheet for calculations in order to correct for T1 and T2-weighting, calculate concentration levels in institutional units (IU) from the water reference, and account for partial volumes of tissue types. The average metabolite quantities in IU and percent standard deviation (%SD) were compared between SI and DI before and after residual metabolite correction.
Results
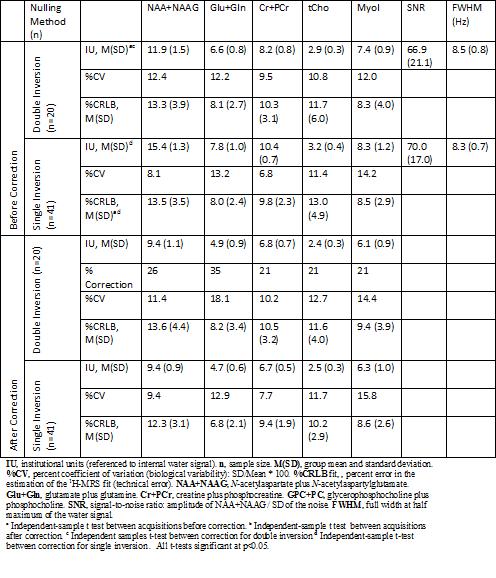
There were no differences in age between the two groups of participants (independent-sample t test, t(59) = 0.76, p = 0.45). The averaged macromolecule spectra before and after correction for each acquisition type are shown in Figure 2. As these are different samples, the spectrums are not expected to match perfectly. Quantities and statistical analyses for 5 metabolites are reported in Table 2. In particular, the metabolite IUs are statistically significantly different between groups before cleaning (Wilks’s lambda(5,55) = 0.26, p <0.001), but not after (Wilks’s lambda (5,55) = 0.91, p = 0.34). Importantly, even with DI, the metabolite quantities are significantly different before and after cleaning (Wilks’s lambda(5,34) = 0.263, p<0.001) (10-35% per metabolite).
Discussion
The results show that the residual metabolite cleaning method successfully equalized the metabolites between the 2 acquisition conditions. The method presented here is sensitive to individual differences in T1 of metabolites. Calculation of T1s of metabolites in every individual is not practical, so this is a necessary simplification and is also commonly assumed in T1 and T2 correction of metabolites. The method presented here can be used to correct all residual metabolites in the basis set, regardless of whether they are visible in the metabolite-nulled spectrums (versus 6). The method is essentially iterative in that it uses an estimate of the metabolite quantities from fitting as the source of the T1-weighting, but we found no significant change from a further iteration. Cleaning of residual metabolites is necessary in order to research macromolecules in disease conditions and thus the need for methodological investigations such as this.
Conclusion
We have presented an analysis of metabolites following 2 different metabolite-nulling acquisition schemes, showing a successful residual metabolite cleaning method and highlighting the importance of cleaning residual metabolites for accurate quantitation.Acknowledgements
The authors acknowledge the use of the FITMAN software package for all MRS preprocessing and fitting courtesy of Dr. Robert Bartha and Dr. Dick Drost of the University of Western Ontario.
Research funding by the Canadian Institutes of Health Research.
References
1. Cudalbu C, Mlynarik V, Gruetter R. Handling macromolecule signals in the quantification of the neurochemical profile. J Alzheimers Dis. 2012; 31 Suppl 3:S101-S115.
2. Schaller B, Xin L, Cudalbu C, Gruetter R. Quantification of the neurochemical profile using simulated macromolecule resonances at 3 T. NMR Biomed. 2013; 26:593-599.
3. Gottschalk M, Lamalle L, Segebarth C. Short-TE localised 1H MRS of the human brain at 3 T: quantification of the metabolite signals using two approaches to account for macromolecular signal contributions. NMR Biomed. 2008; 21:507-517.
4. Kassem MN, Bartha R. Quantitative proton short-echo-time LASER spectroscopy of normal human white matter and hippocampus at 4 Tesla incorporating macromolecule subtraction. Magn Reson Med. 2003; 49:918-927.
5. Pijnappel WWF, van den Boogaart A, de Beer R, van Ormondt D. SVD-based quantification of magnetic resonance signals. J Magn. Reson. 1992; 97:1;122-134.
6. Craveiro M, Cudalbu C, Gruetter R. Regional alreations of the brain macromolecule resonances investigated in the mouse brain using an improved method for the pre-processing of the macromolecular signal. Proc ISMRM 2012; 1748.
7. Bernier D, Bartha R, McAllindon D, Hanstock CC, Marchand Y, Dillen KN, Gallant M, Good KP, Tibbo PG. Illness versus substance use effects on the frontal white matter in early phase schizophrenia: a 4Tesla 1H-MRS study. Schizophr Res. 2016; 175:4-11.
8. Bartha R, Drost DJ, Williamson PC. Factors affecting the quantification of short echo in-vivo 1H MR spectra: prior knowledge, peak elimination, and filtering. NMR Biomed. 1999; 12:205-216.
9. Bartha R, Drost DJ, Menon RS, Williamson PC. Comparison of the quantification precision of human short echo time 1H spectroscopy at 1.5 and 4.0 Tesla. Magn Reson Med. 2000; 44:185-192.
10. Traber F, Block W, Lamerichs R, Gieseke J, Schild HH. 1H metabolite relaxation times at 3.0 Tesla: measurements of T1 and T2 values in normal brain and determination of regional differences in transverse relaxation. J Magn Reson Imaging. 2004; 19:537-545.
11. Posse S, Otazo R, Caprihan A, Bustillo J, Chen H, Henry PG, Marjanska M, Gasparovic C, Zuo C, Magnotta C, Mueller B, Mullins P, Renshaw P, Ugurbil K, Lim KO, Alger JR. Proton echo-planar spectroscopic imaging of J-coupled resonance in human brain at 3 and 4 Tesla. Magn Reson Med. 2007; 58:236-244.
Figures