2245
What are the effects of adding macromolecules to the basis set on metabolite quantification reproducibility and accuracy? A comparison of different macromolecular models for FID-MRSI in the brain at 7TEva Heckova1, Michal Považan2, Bernhard Strasser3, Stanislav Motyka1, Gilbert Hangel1, Lukas Hingerl1, Philipp Moser1, Stephan Gruber1, Siegfried Trattnig1,4, and Wolfgang Bogner1,4
1High Field MR Centre, Department of Biomedical Imaging and Image-guided Therapy, Medical University of Vienna, Vienna, Austria, 2Russell H. Morgan Department of Radiology and Radiological Science, The John Hopkins University School of Medicine, Baltimore, MD, United States, 3Athinoula A. Martinos Center for Biomedical Imaging,Department of Radiololy, Massachusetts General Hospital, Harvard Medical School, Charlestown, MA, United States, 4Christian Doppler Laboratory for Clinical Molecular Imaging, Vienna, Austria
Synopsis
This work investigates the influence of different macromolecular baseline models on the reliability and test-retest reproducibility of metabolite quantification for clinically attractive ~5min 2D-FID-MRSI with nominal voxel volume 3.4×3.4×8mm3. We confirmed that FID-MRSI with adequate MM prior knowledge provides highly reproducible (CV<11%) and reliable results (ICC>0.75) for the common metabolites even when using more flexible parameterized MM models.
Introduction
At ultra-high field strength, the application of echo-based magnetic resonance spectroscopic imaging (MRSI) is challenging as the T2 relaxation times and ultimately the SNR decrease significantly. To maximize the number of detectable signals, FID-based MRSI with negligible acquisition delay was proposed1. This improves particularly the detectability of J-coupled neurometabolites such as Myo-Inositol, Glutamate, Glutamine or Glutathione, however also enhances the background signal of macromolecules (MM). Reliable metabolite quantification in the presence of strong MM resonances is challenging2 and requires to include MM into the fitting model3,4. Several approaches have been proposed, including the entire MM baseline as a single component2 or adding several parameterized MM components to stay flexible in the presence of pathologic changes3. Both these approaches were evaluated for high SNR (hence long scan times) and the reliability for metabolite quantification was assessed only indirectly via Cramér-Rao lower bounds (CRLB). This work investigates the influence of different MM baseline models on the reliability and test-retest reproducibility of metabolite quantification for clinically attractive ~5min parallel imaging accelerated FID-MRSI protocols.Methods
Ten healthy volunteers (7M/3F, 28±4y) were scanned twice on two separate occasions on a 7T Siemens whole-body MR scanner using a 32-channel head coil. FID-based single-slice MRSI1 was applied in transverse plane above the ventricles with TE*/TR, 1.3/600ms; matrix size, 64×64; nominal voxel volume, 3.4×3.4×8mm3; 1024 spectral points, 6kHz bandwidth, and 2D-CAIPIRINHA5 acceleration within ~5min acquisition time. Consistent MRSI slice positioning between test-retest measurements was achieved by using AutoAlign6. Data were processed using automated in-house developed software, including LCModel quantification. For this purpose, three different basis sets were used. Each consisting of 16 simulated metabolite signals and: a) no MM spectrum included – "no MM"; b) full measured MM spectrum included – "full MM"; c) nine individual MM components included with applied soft constraints3 – "parameterized MM" (Figure 1). Reproducibility of measurements was evaluated by intra-subject coefficients of variation (CV) and reliability of the method by intra-class correlation coefficients (ICC) assessed in five brain regions by means of voxel-by-voxel analysis across all eligible spectra, i.e. those with CRLBNAA<30% or FWHMNAA<20Hz. Tissue-type segmentation (GM, WM, CSF) and structural registration (frontal, parietal and subcortical region) were carried out using FAST and FLIRT of FSL.Results
Figure 2 and Figure 3 summarize the measures of reproducibility in each brain region from different fitting approaches. The low CVs (median CVtNAA/tCr <7%, CVtCho/tCr<7%, CVmIns/tCr<8% and CVGlu/tCr<11%) were generally consistent between the "no MM", "full MM" and "parameterized MM" datasets (±2%) and among the brain regions (only CVs of Glu/tCr and mIns/tCr were slightly higher in subcortical WM). Similarly, the ICCs of the same metabolic ratios showed consistency and were comparatively high between the "no MM", "full MM" and "parameterized MM" datasets (all ICC>0.75 in WM regions), although an increased reliability can be observed when incorporating macromolecular information into the fitting process (e.g., mIns/tCr, tCho/tCr or tNAA/tCr of "full MM" up to +0.2 higher ICC than of "no MM" in parietal GM). Mean CRLBs in a range of 5-14% indicate especially robust fitting for tNAA, tCho, tCr, mIns and Glu and were similar between the three fitting approaches (±1%). Examples of metabolic maps obtained by LCmodel fitting with different basis sets are displayed in Figure 4. The correlation analysis revealed interdependent quantification of most MM resonances, but no correlations between individual parameterized MMs and overlapping metabolites (Figure 5).Discussion
Based on the reported CVs and ICCs values we confirmed that the employed FID-MRSI sequence provides highly reliable and reproducible information about the abundance and spatial distribution of several brain metabolites in only ~5min. The inclusion of macromolecular background information in the quantification process either via a “full_MM” or “parameterized_MM” basis sets did not significantly alter the reproducibility of the major brain metabolites. This confirms earlier reports that were obtained with longer scan times of ~30min, hence much higher SNR2. The variability of individual MM resonances was higher than that of main metabolites (median CVs between 9-18%). This must be considered when one is interested in macromolecules themselves. Also other metabolites like Gln, NAAG or GSH can be quantified with relatively low CRLBs<40%, but with higher test-retest variability (median CV=12-20%).Conclusion
Clinically attractive 7T FID-MRSI with adequate MM prior knowledge provides highly reproducible and reliable results for the common metabolites even when using more flexible parameterized MM models.Acknowledgements
This study was supported by the Austrian Science Fund (FWF): KLI 646, KLI 718 and P 30701.References
1. Hangel et al., NeuroImage 2018; 168:199-210
2. Považan et al., NeuroImage 2015; 121:126-1353
3. Považan et al. MRM 2018; 79(3):1231-1240
4. Penner et al. MRM 2015; 74:4-125
5. Strasser et al., MRM 2016; 78(2):429-440
6. Van der Kouwe et al., NeuroImage 2005; 27:222-230
Figures
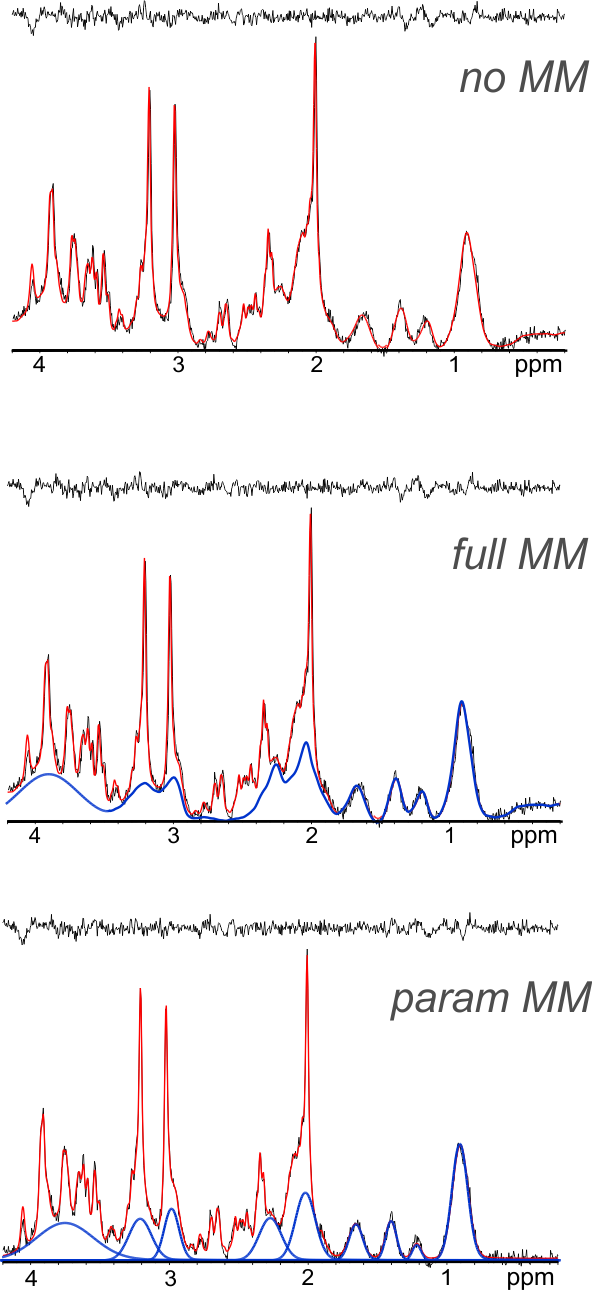
Figure 1: Examples of spectra quantified by LCModel using three different basis sets. In addition to the metabolite spectra (red), a full macromolecular spectrum (blue) is fitted with the “full MM” basis set and nine individual macromolecular peaks are obtained by quantification using the “parameterized MM” basis set.
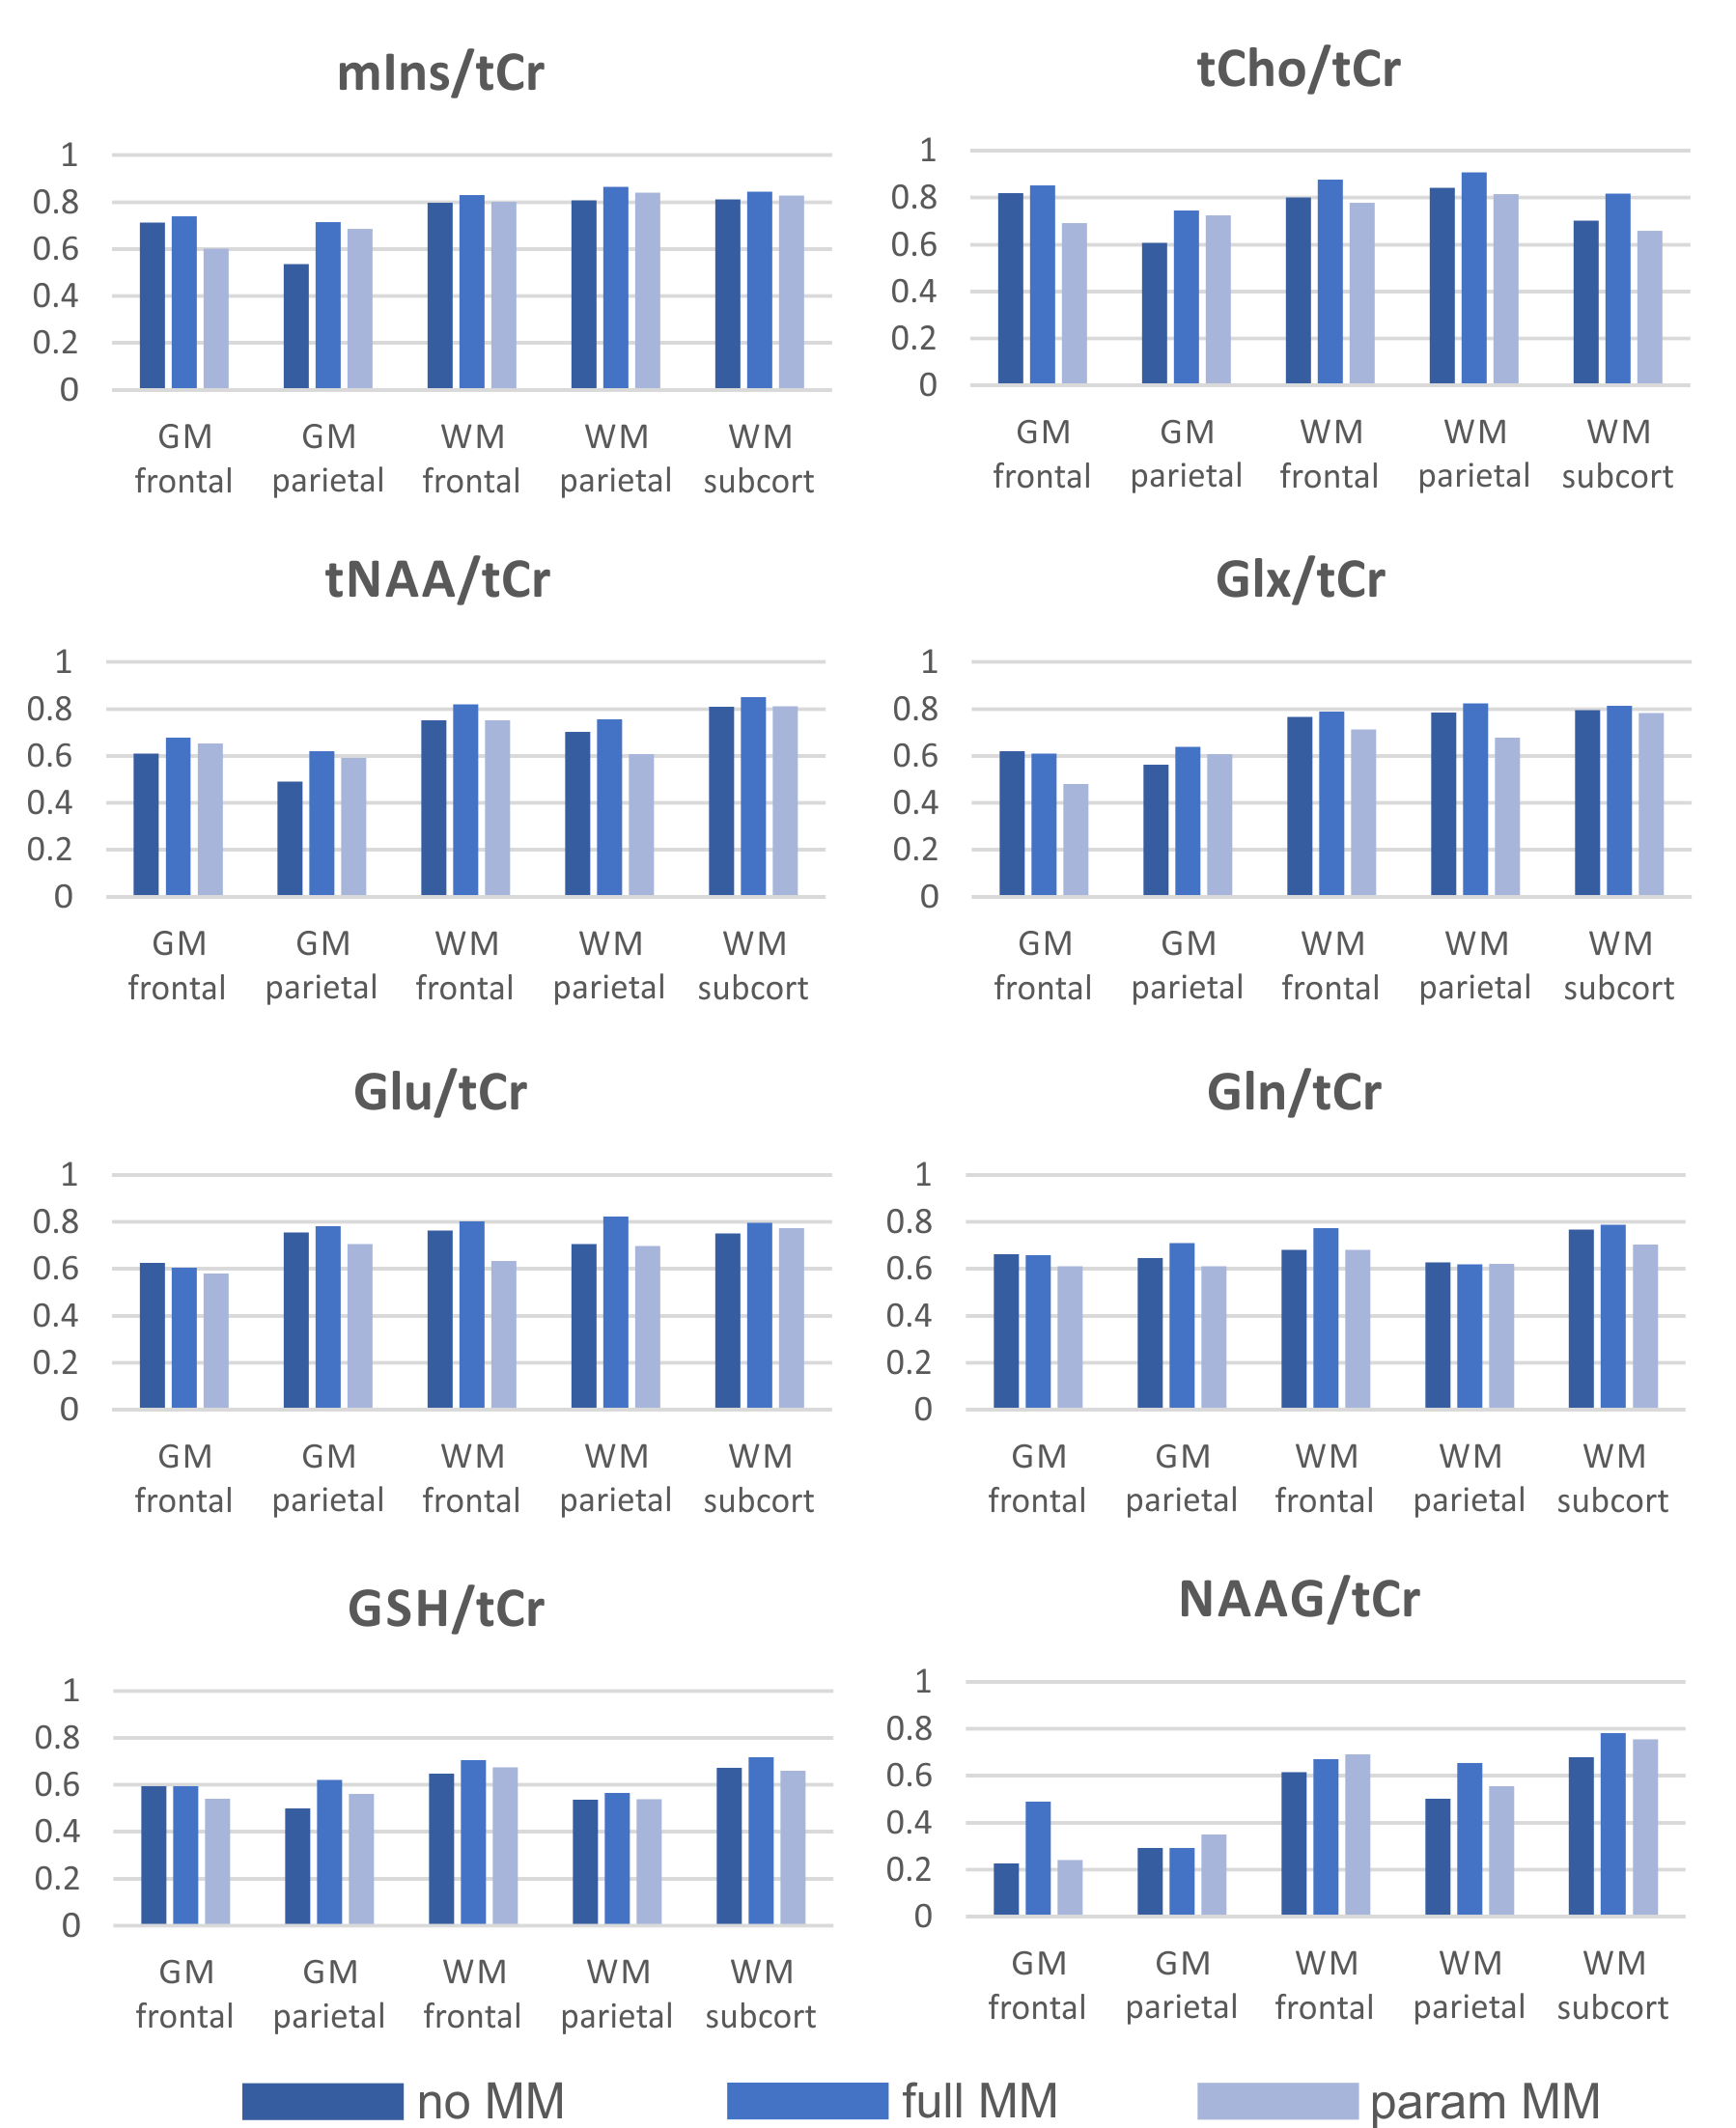
Figure 2: Bar plots with intra-class correlation coefficients (ICC) of six metabolites with reference to tCr evaluated in five brain regions. The ICCs, which reflect both correlation and agreement between measurements, tend to be (i) consistent when using “no MM”, “full MM” or “parameterized MM” basis set; (ii) slightly higher in white matter (WM) regions for mIns/tCr, tCho/tCr and tNAA/tCr; and (iii) generally showing good reliability of the method.
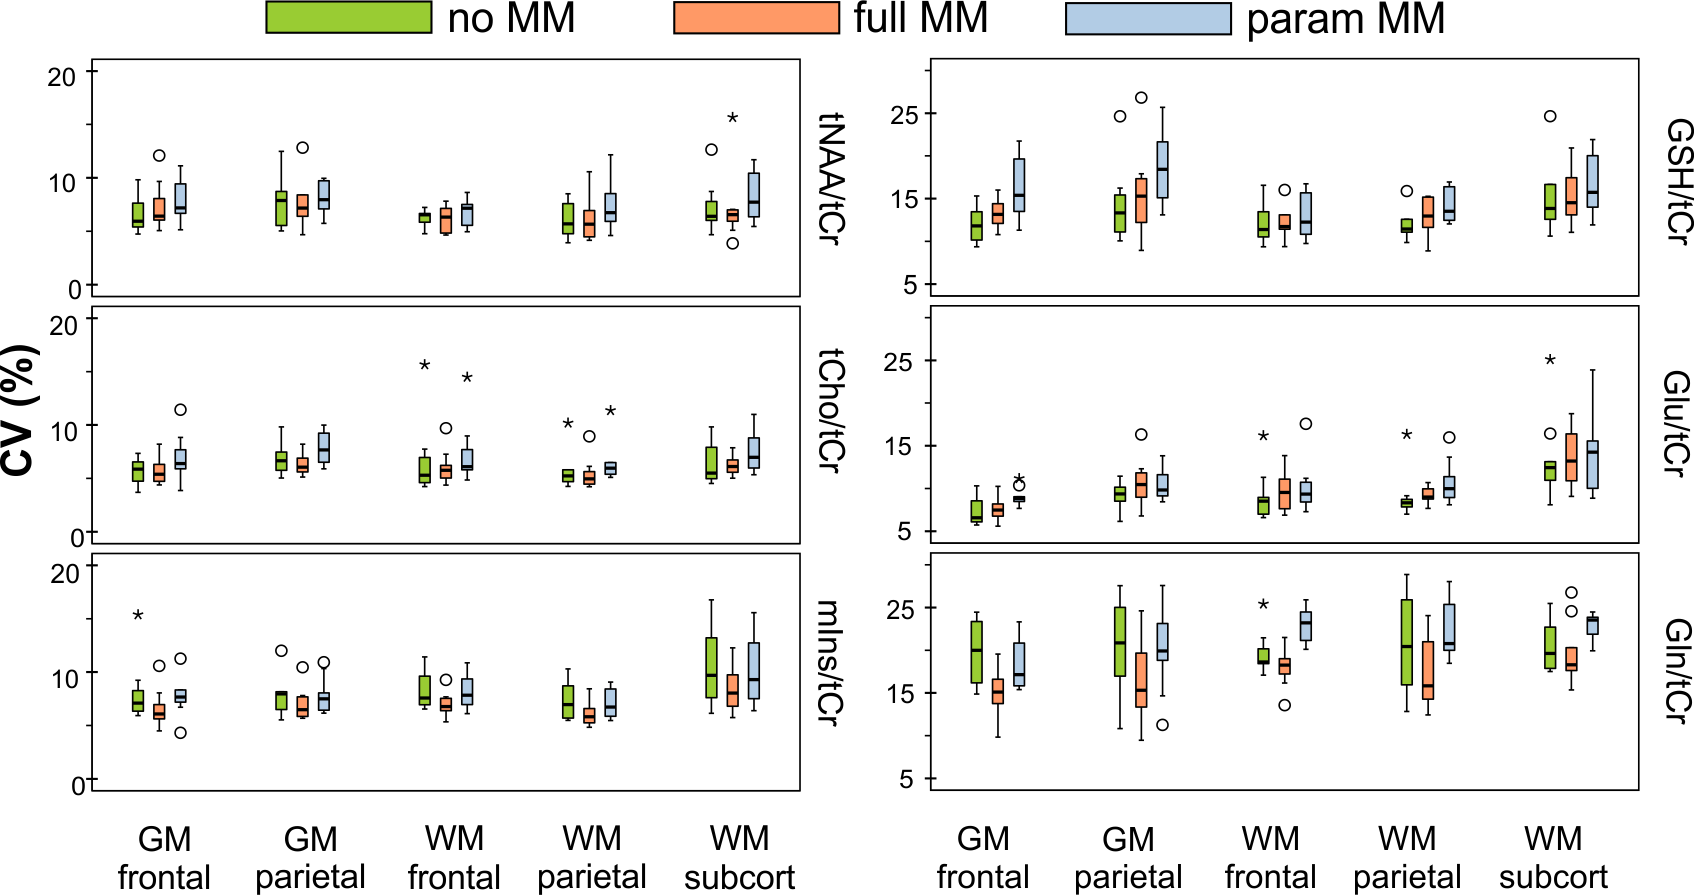
Figure 3: Boxplots with coefficients of variation (CV) of metabolites with reference to tCr representing the intra-subject test-retest variability in five brain regions. The median CVs tend to be (i) consistent between “no MM”, “full MM” and “param MM” datasets; (ii) consistent among the brain regions; and (iii) higher for Gln/tCr and GSH/tCr.
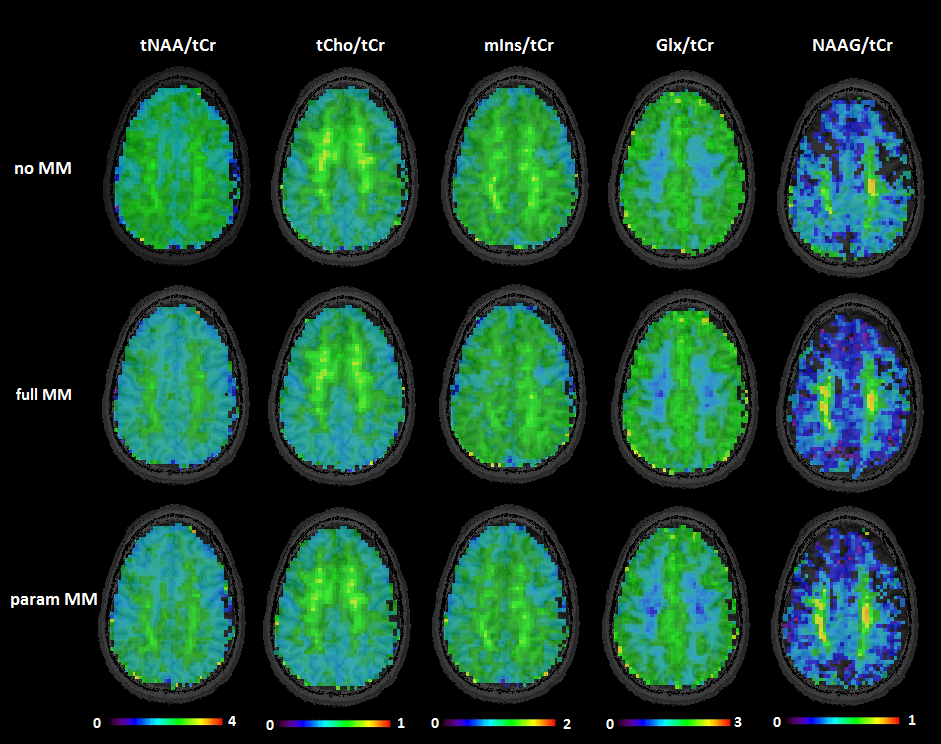
Figure 4: Metabolic ratio maps in native resolution of one volunteer obtained by LCModel fitting with three different basis sets.

Figure 5: Correlation matrix indicating correlations between metabolite and MM levels when using the basis set with parameterized MM components using soft constraints. Several macromolecules correlate with each other (except for MM 2.04 and MM 2.26), but none of them correlate with other metabolites.