2244
T2 Relaxation Times of Macromolecules in Human Brain Spectra at 9.4 T1Biological Cybernetics, Max Planck Institute, Tübingen, Germany, 2Faculty of Science, University of Tübingen, Tübingen, Germany, 3Graduate Training Centre of Neuroscience, University of Tübingen, Tübingen, Germany
Synopsis
This work reports the apparent T2 relaxation times of macromolecules measured at 9.4 T in the human brain. The measured T2 times are between 10 and 40ms, with longer relaxation times of around 50 ms for M2 and M3. The J-evolution of the peak at 2.7 ppm is observed at longer echo times. The full-width half-maxima of the simulated peaks are significantly broader than the T2 component of the lineshapes.
Introduction
Protons belonging to molecules with a short T2 and T1 relaxation times, referred to in literature as macromolecules (MM), influence the quantification results of major metabolites when using sequences with short echo times1,2. Recent studies have shown tissue dependent variation of these resonances3; while another study describes the possible clinical relevance of MMs in clinical diagnostics4. MMs have been characterized at 9.4 T in vivo in both rats5 and humans6.In this work the apparent T2 relaxation times of MMs are quantified in the human brain at 9.4 T.Methods
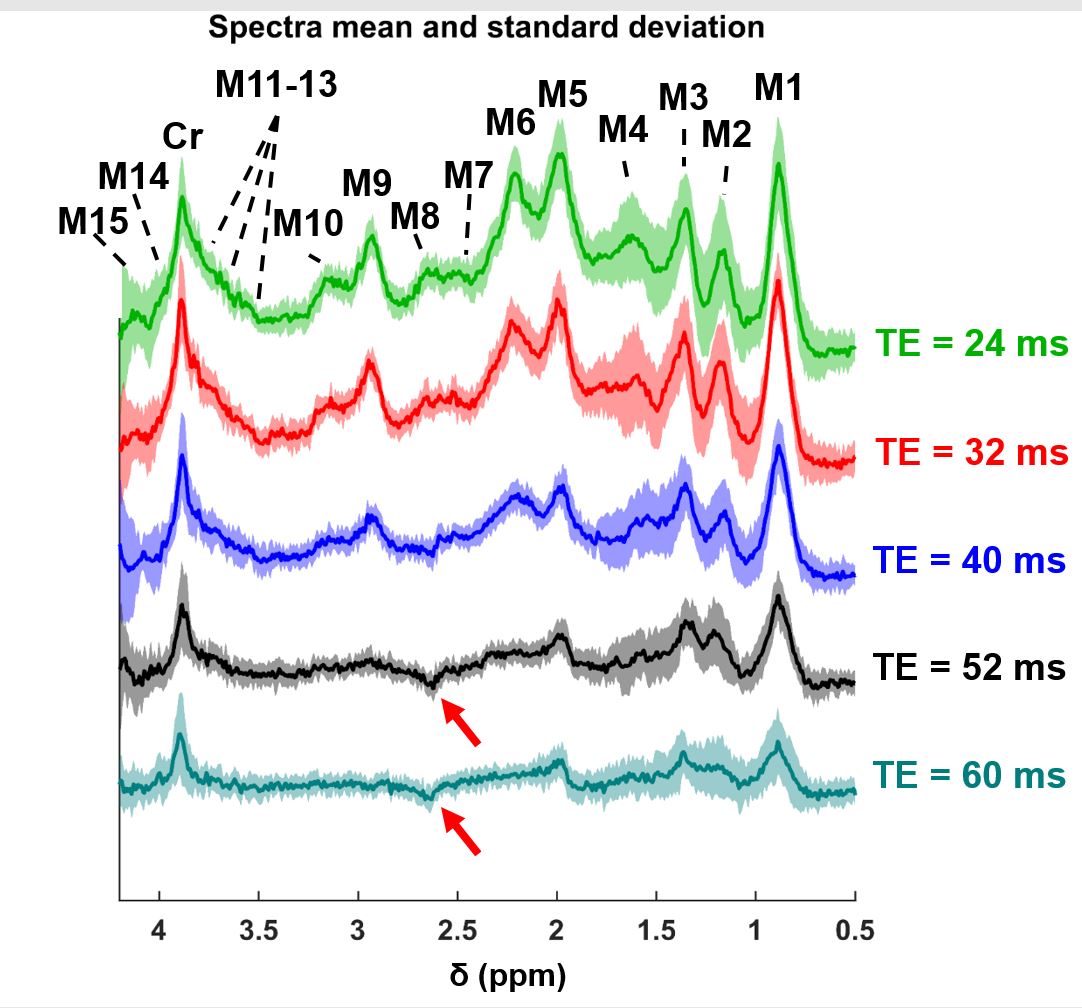
An echo times (TE) series of 1H-MRS metabolite-cycled double inversion recovery semi-LASER spectra (TR 10 s / TInv1 2360 ms / TInv2 625 ms) were acquired in the occipital lobe of the human brain from 11 healthy volunteers at 9.4 T. The measurements were done for TEs of 24, 32, 40, 52, 60 ms. The raw data were preprocessed using an in-house written Matlab software and aligned based on the total creatine (Cr) peak to 3.925 ppm (Fig. 1). The spectra were fitted with LCModel-v6.37 software both individually for each subject and summed across subjects.
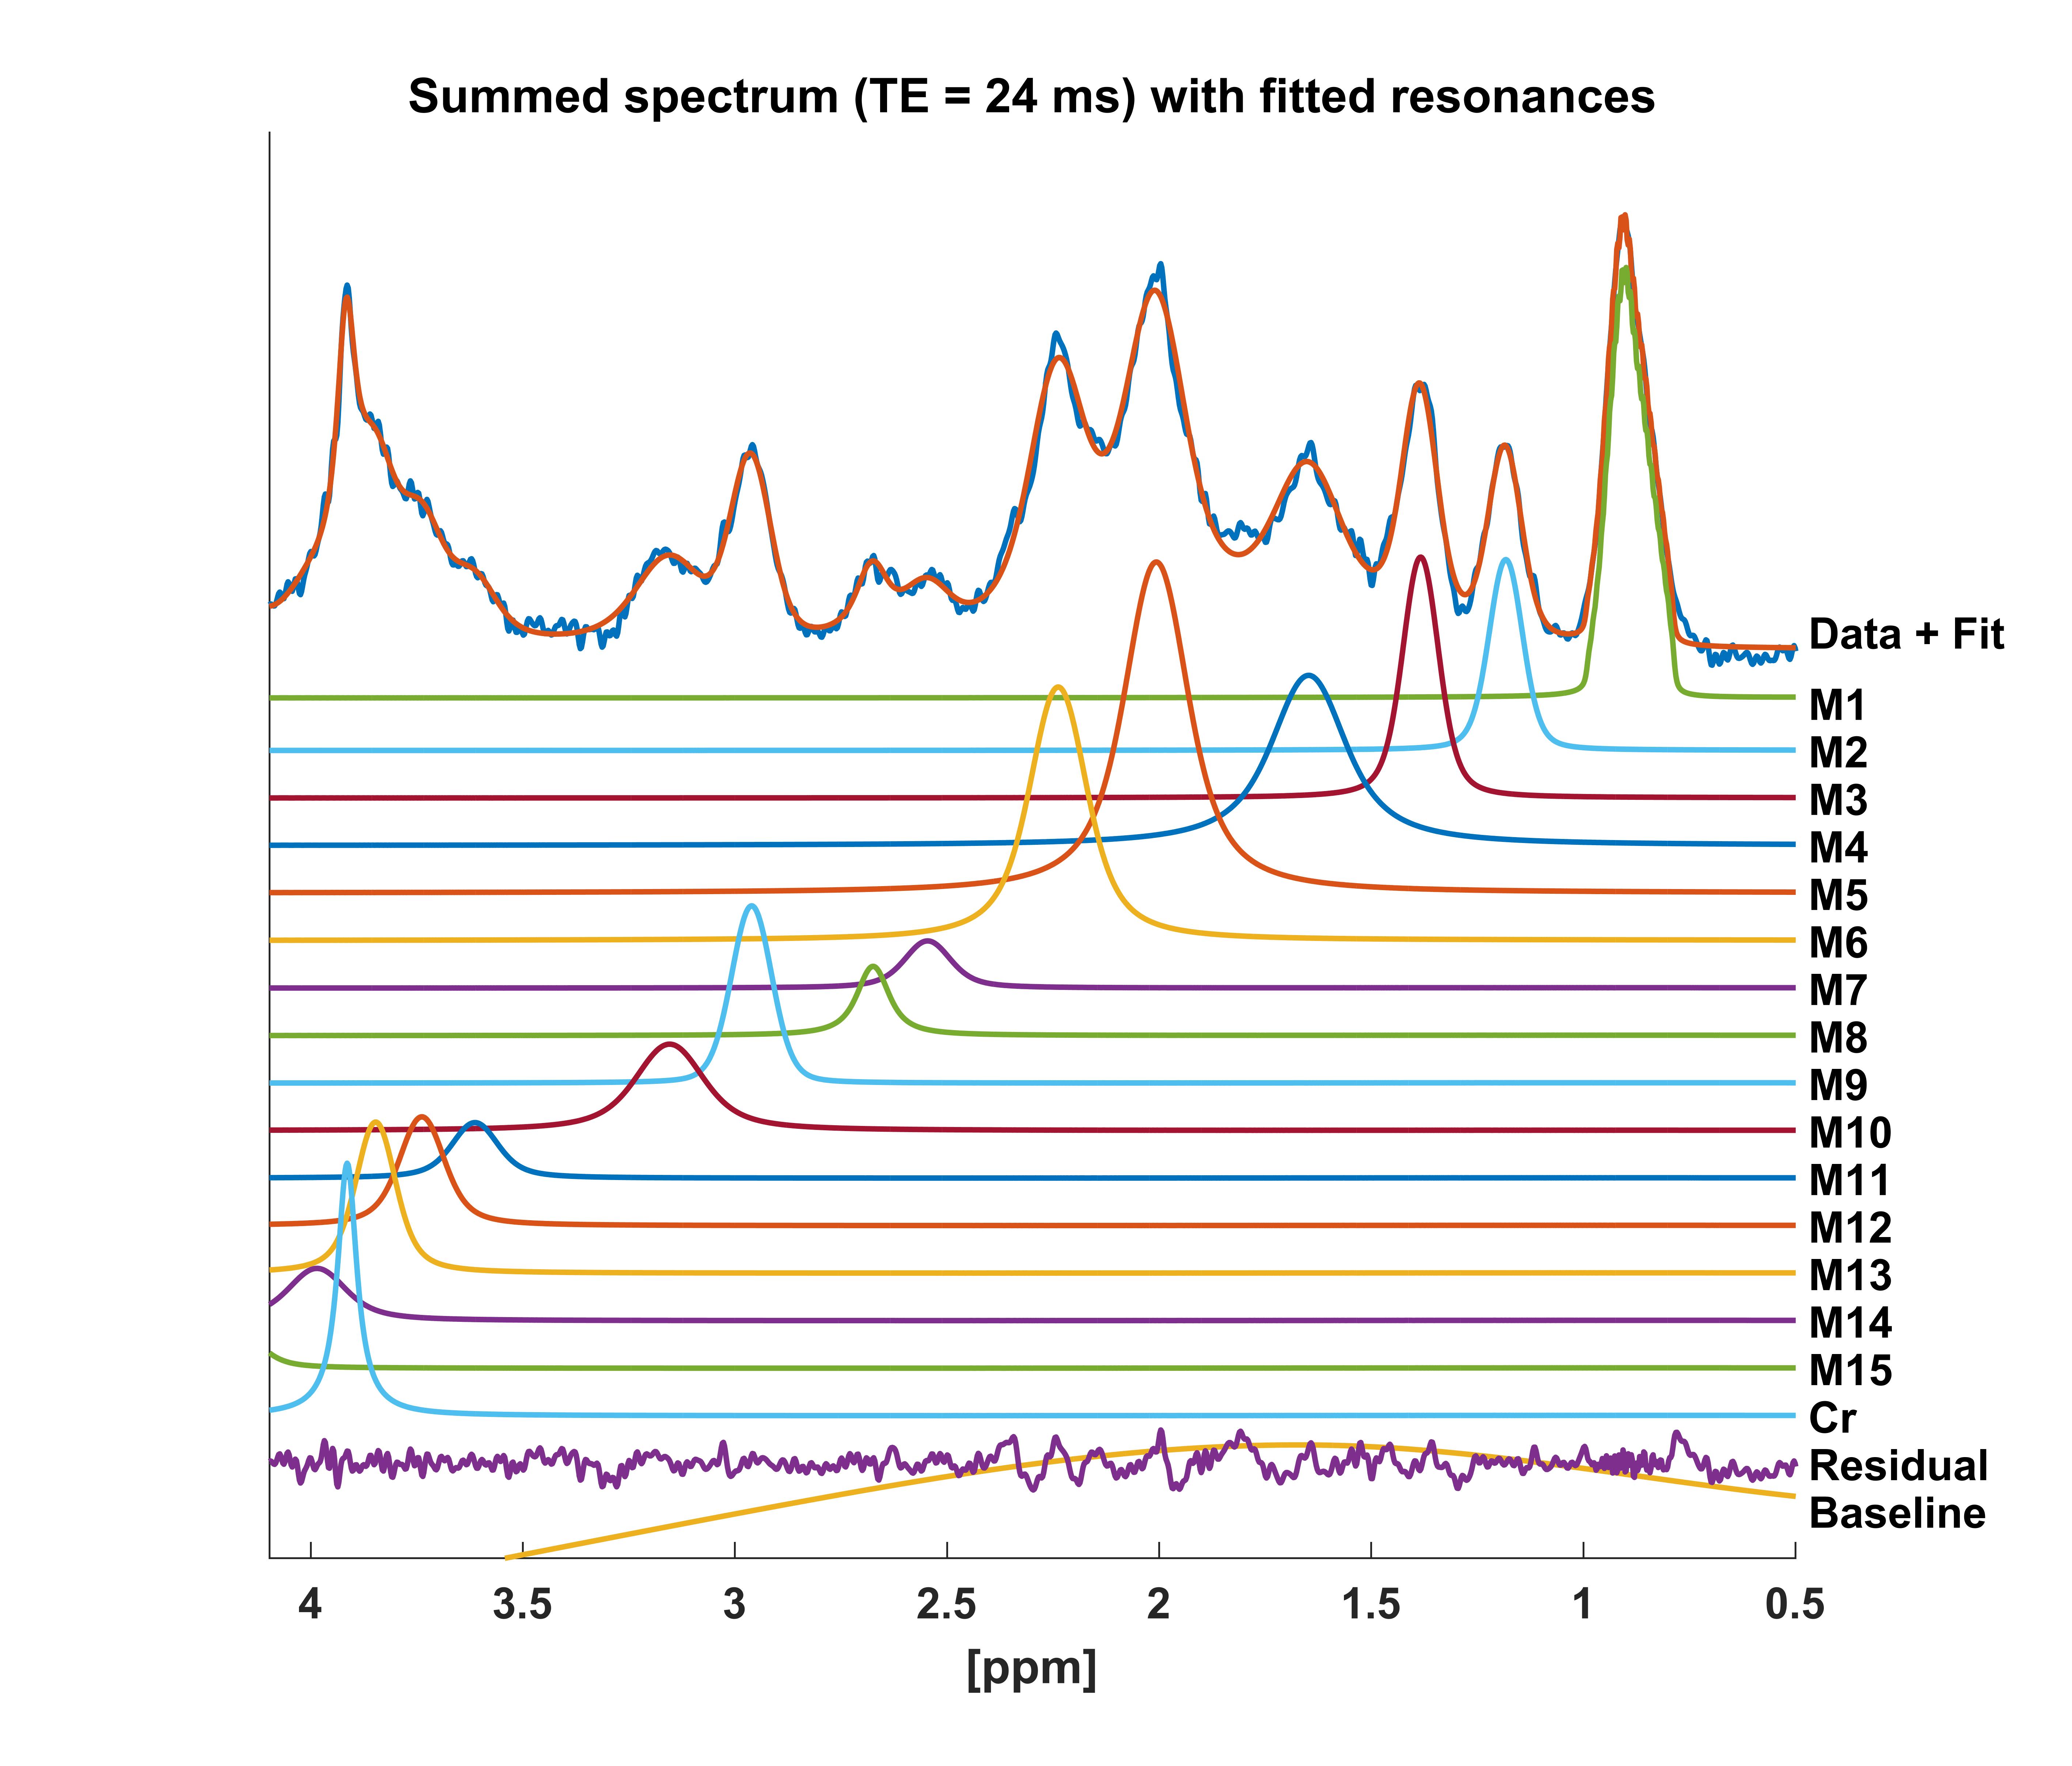
The spectral lines were simulated at the ppm shifts published by Pfeuffer et. al.5 (M1 – δ0.916, M2 - δ1.21, M3 – δ1.39, M4 – δ1.67, M5 – δ2.04, M6 – δ2.26, M9 – δ2.99, M10 – δ3.21, M11 – δ3.62, M12 – δ3.77, M13 – δ3.85, M14 – δ4.0, M15 – δ4.17), Giapitzakis et. al.6 (M7 – δ2.56, M8 – δ2.7) and a residual total Cr peak at δ3.925, adjusted with a narrow line shape (Fig. 2). The quantified concentrations were fitted to a monoexponential decay across the TE series to estimate T2 relaxation times.
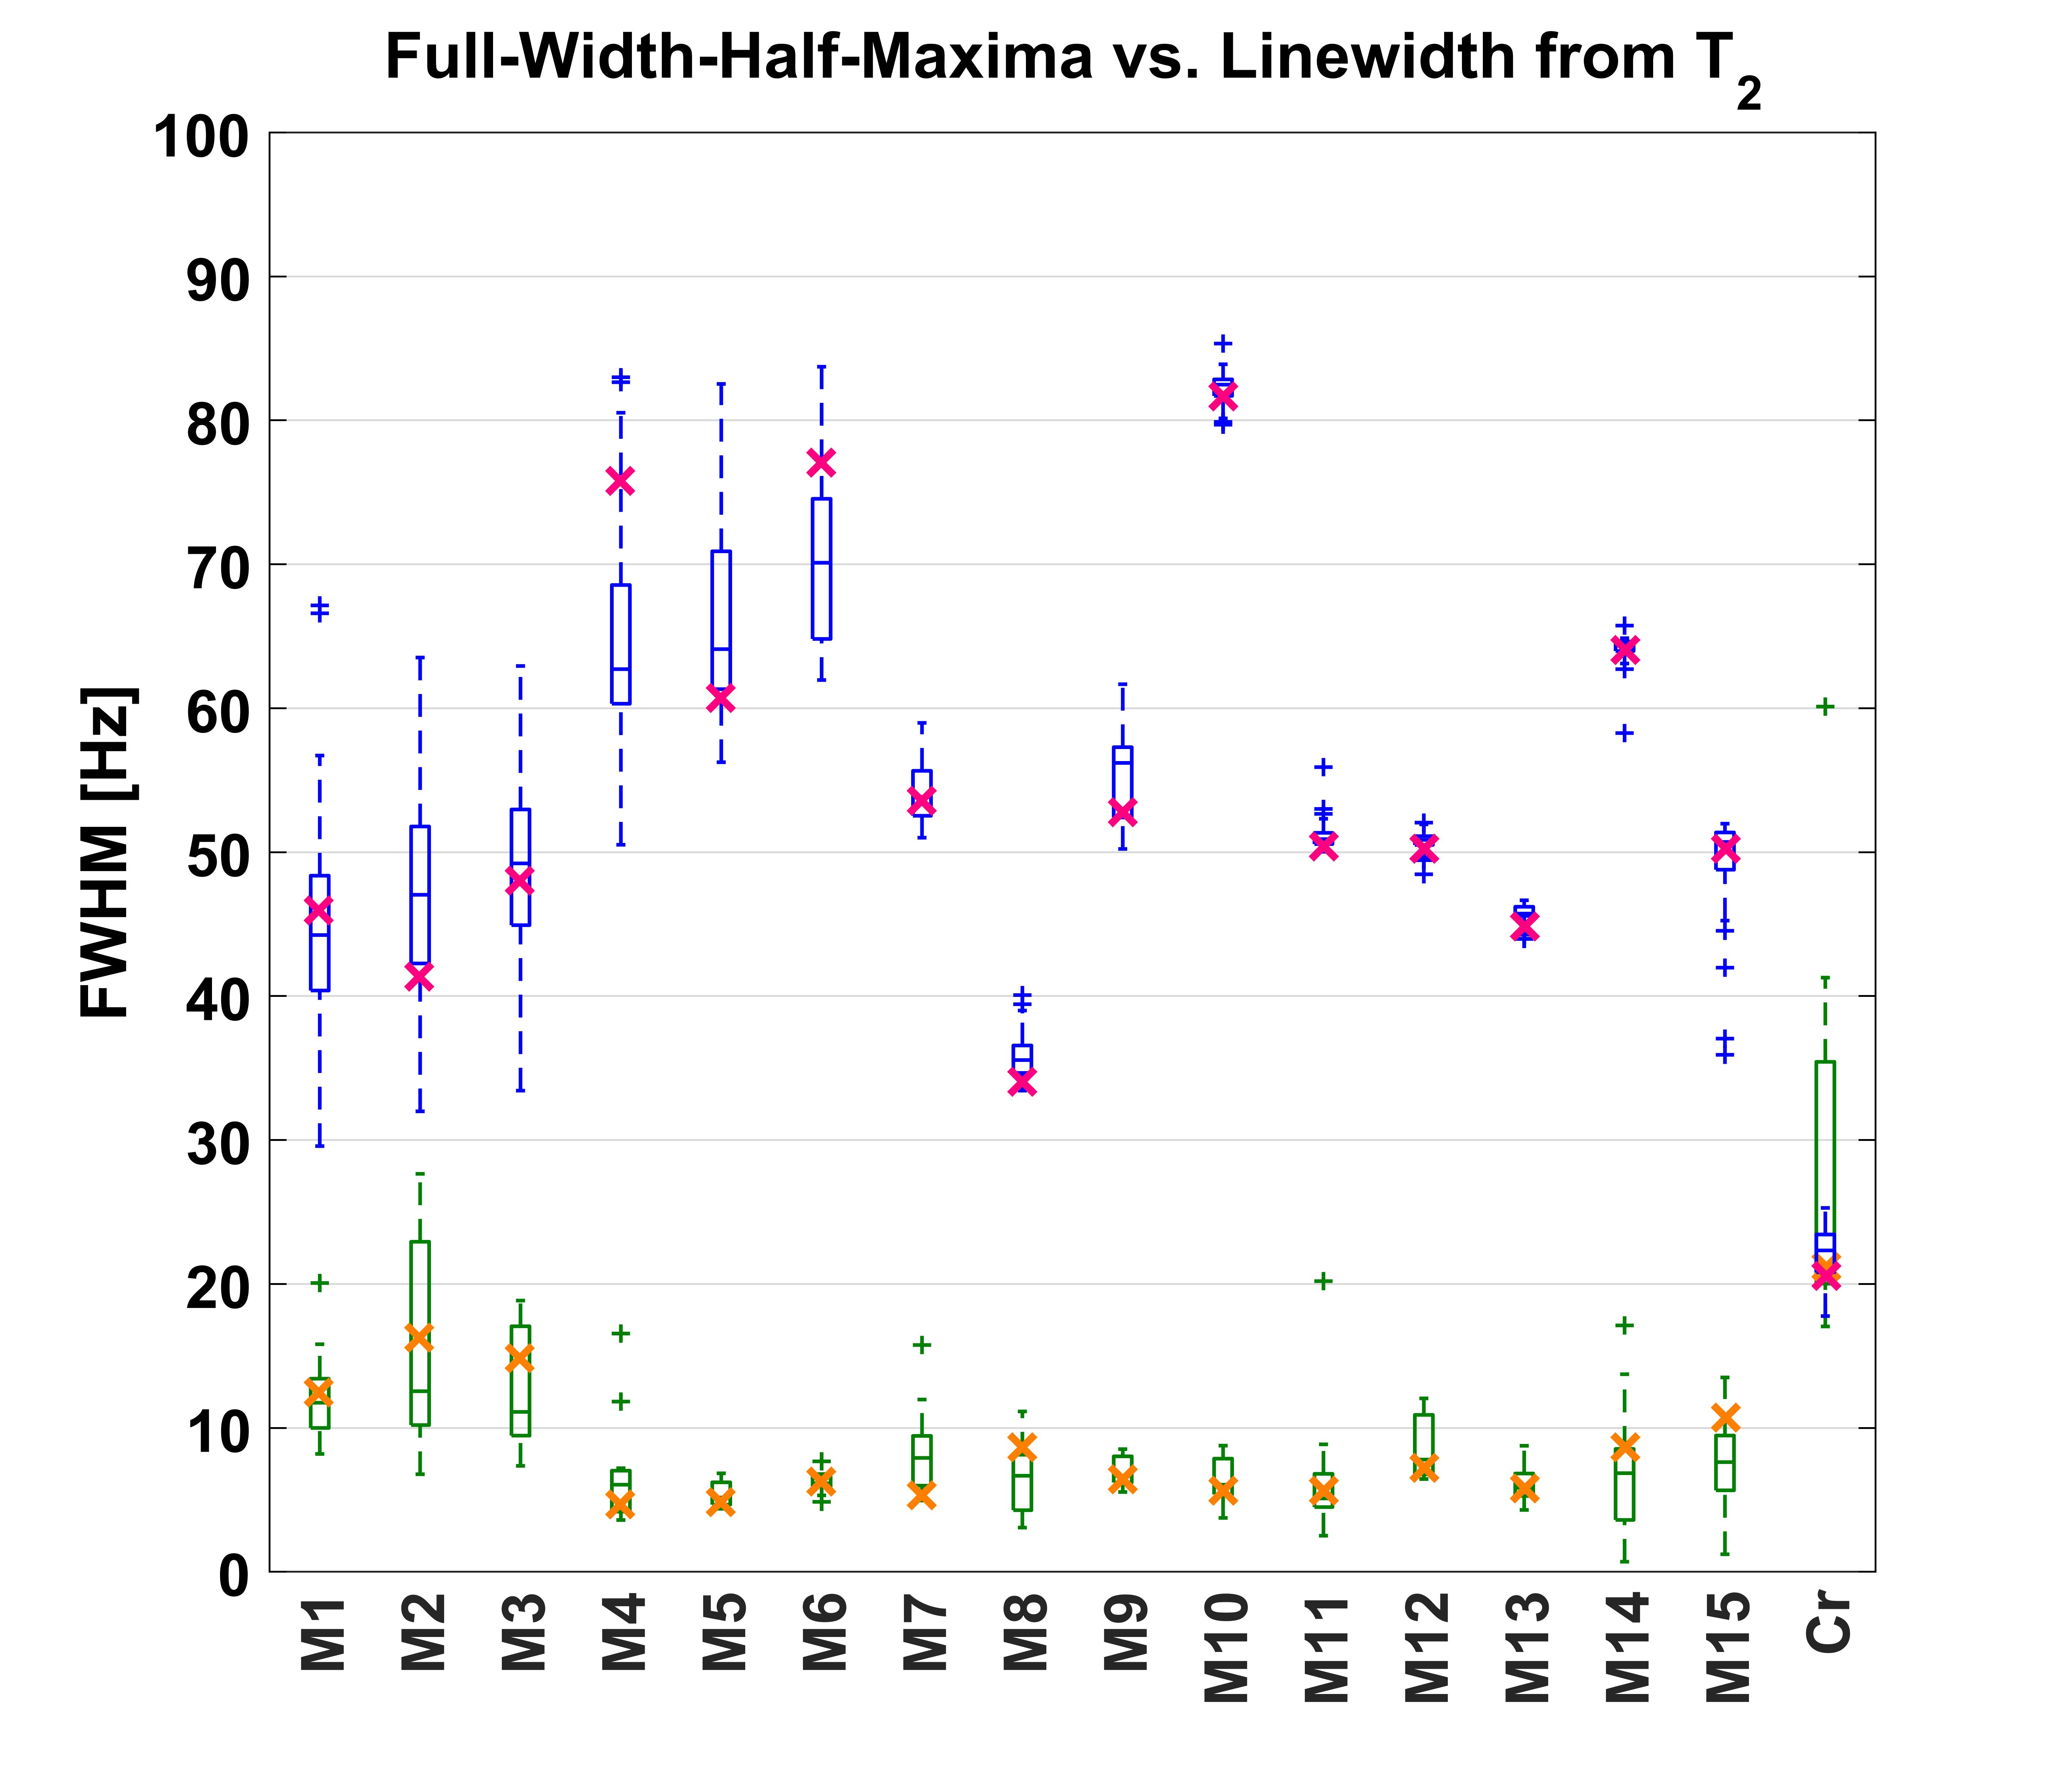
The full-width-half-maxima (FWHM) for all the fitted macromolecular Voigt lines was measured after quantification. The T2 component of these lines was calculated as $$$FWHM_{T_2}=\frac{1}{\pi T_2}$$$
Results
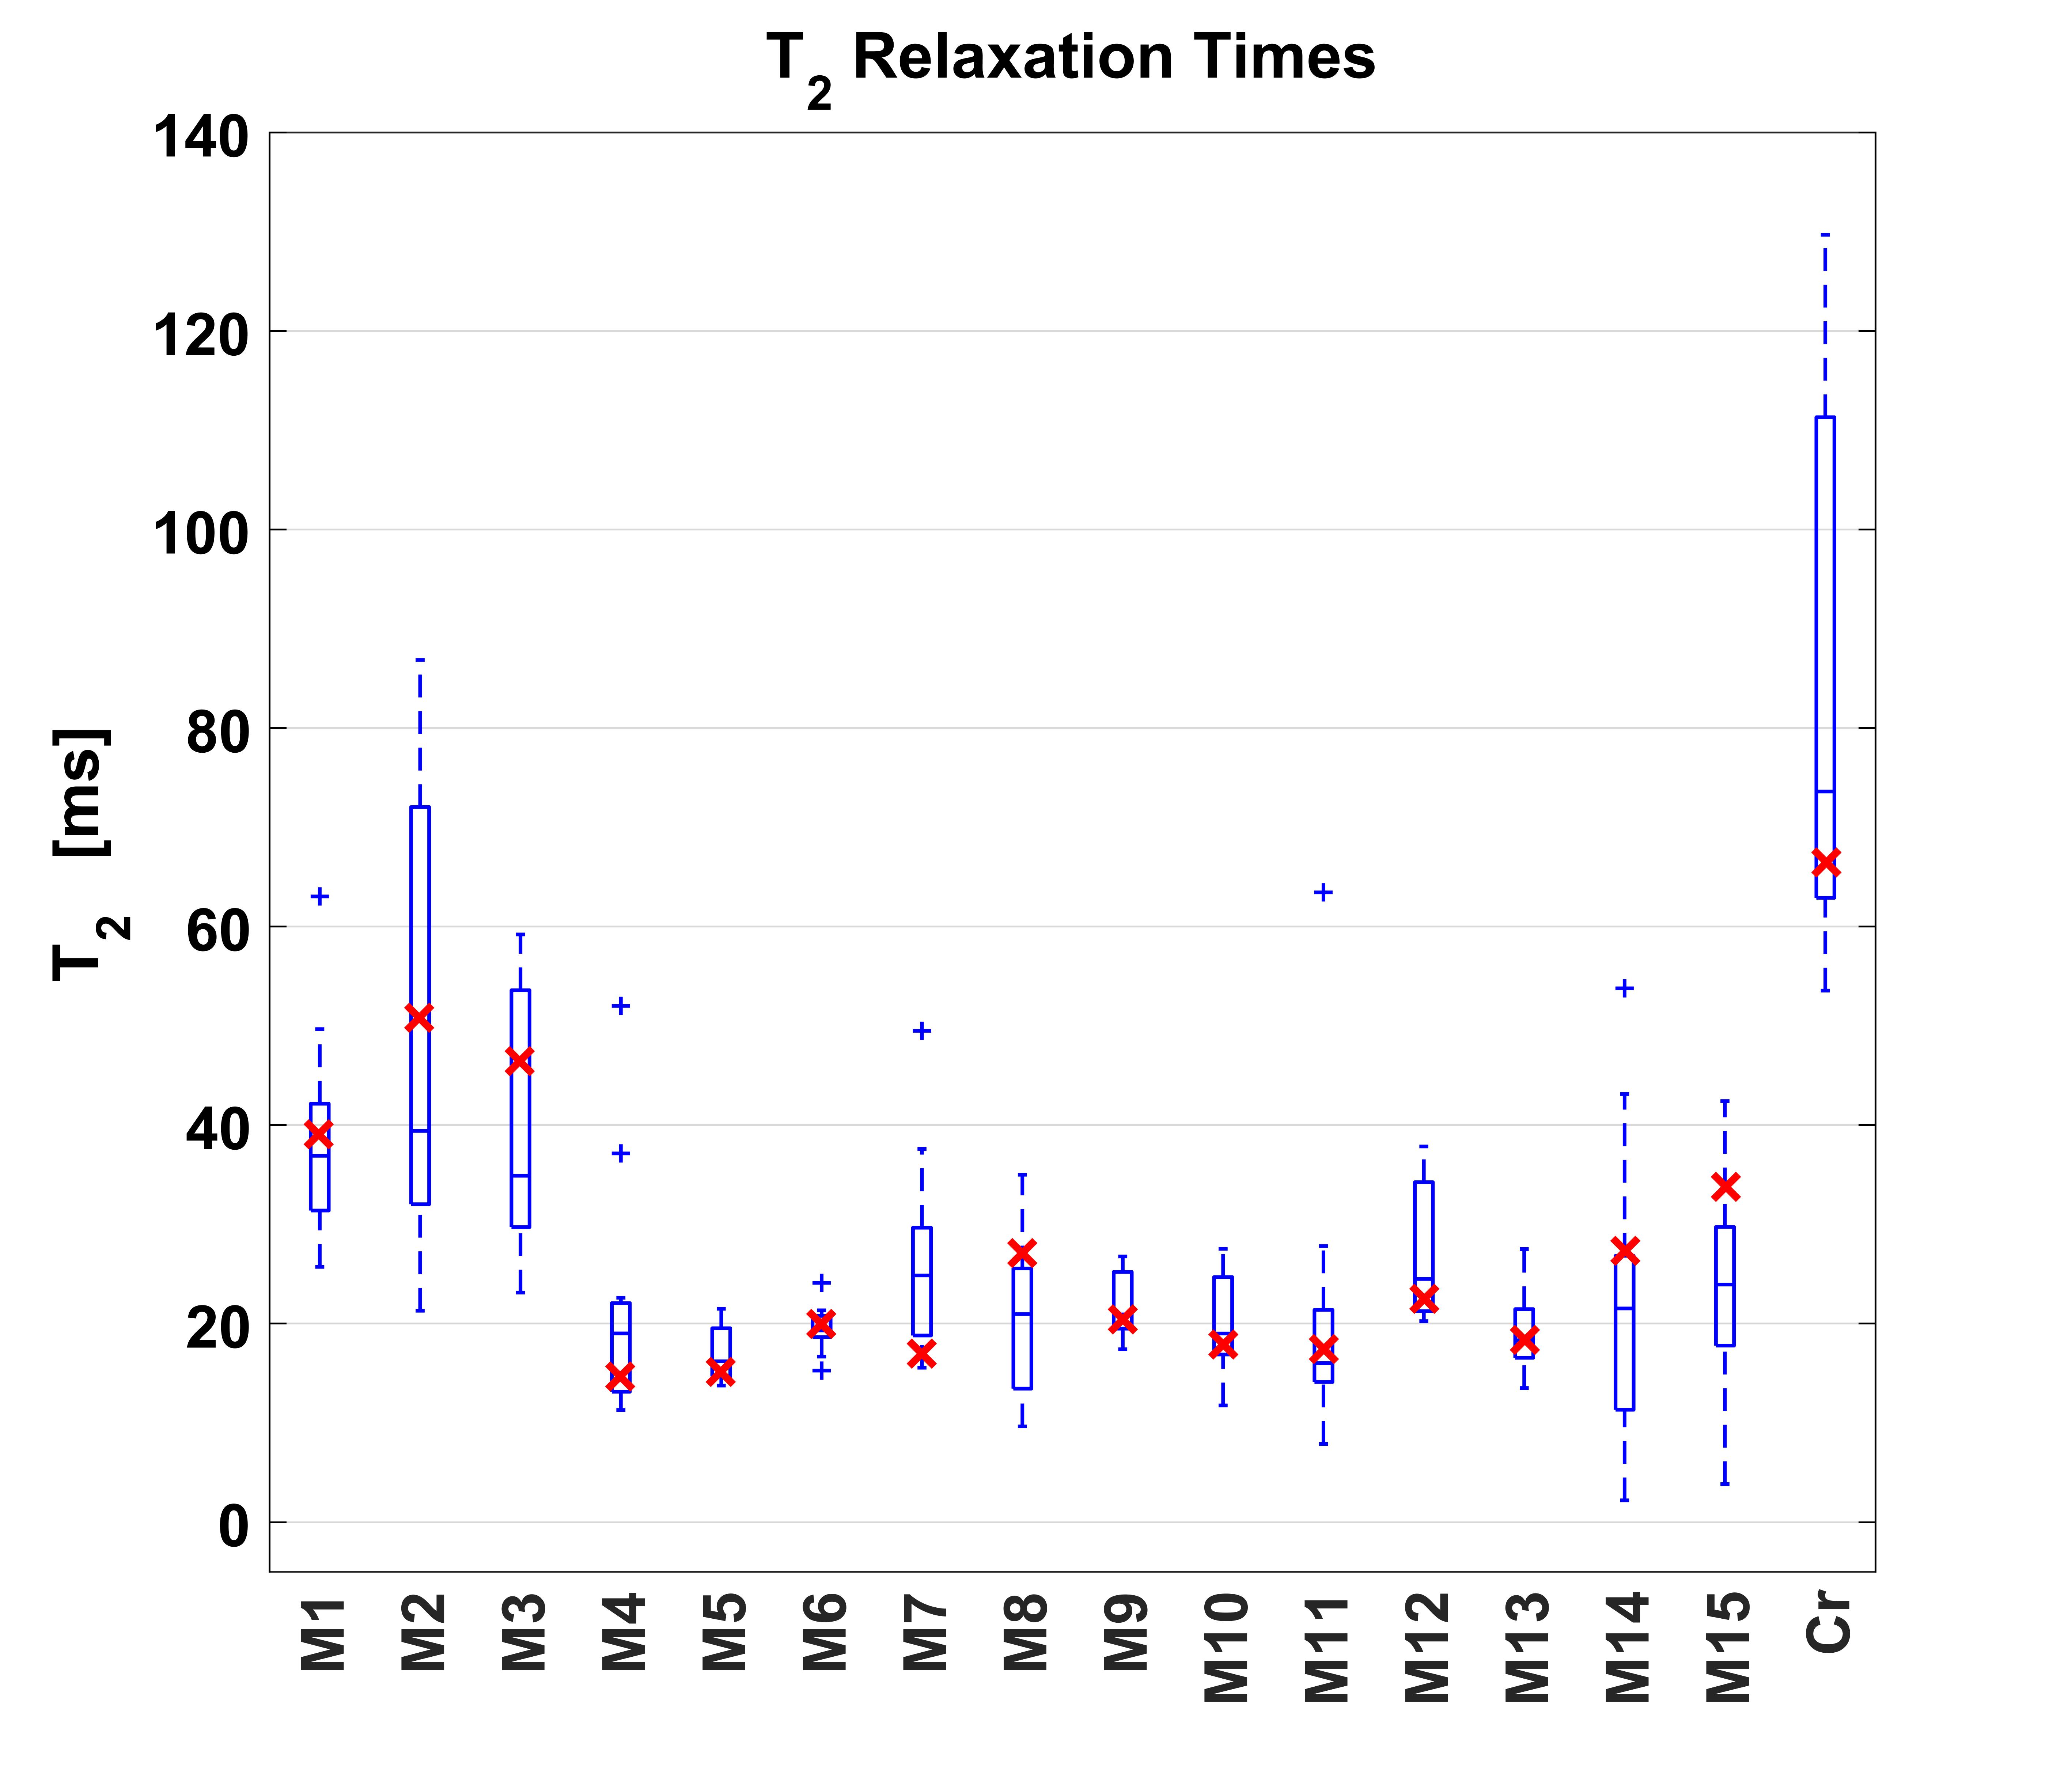
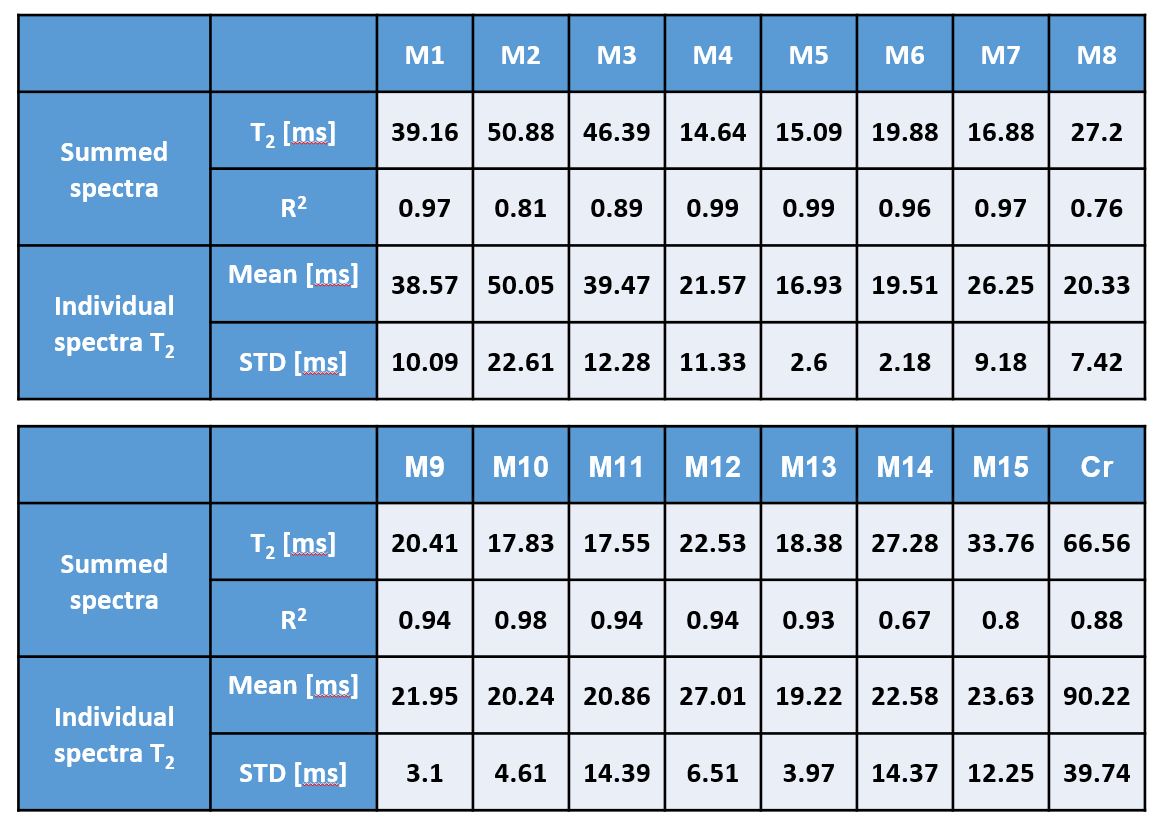
The spectra showed good consistency and quality across subjects (Fig. 1), however between 0.9 and 1.8 ppm the spectra presented some outer volume lipid impurities for some subjects. The calculated T2 relaxation times (Fig. 3,4) were overall in good agreement between the per subject fits and the summed spectra. Relaxation times for all macromolecular resonances were between 10 and 40 ms, except of M2 and M3, whose relaxation times were up to 70 ms and 60 ms, respectively.
The M8 macromolecule resonance undergoes a J-coupling introduced phase evolution with increasing echo times, reaching a full inversion between TE 52 and 60 ms. The confidence of the exponential decay fits was above 0.8 for most MMs, except M8 which was not modeled as a J-coupled spin system in this study, hence the low R2 value. Further, the estimation of the T2 decay of M14 and M15 is subjected to water residuals and noise at longer echo times, while the uncertainties of the M2 and M3 are influenced by lipid contaminations.
The linewidth of the resonances was measured to vary between 40 and 80 Hz, while the part of the FWHM originating from the T2 relaxation was calculated as 4 to 20 Hz. (Fig. 5)
Discussion & Conclusion
This study reports for the first time the T2 relaxation time of individual MMs in the human brain. The reported T2 relaxation times are comparable to T2 relaxation times measured in rat brains at 9.4 T (22.7 – 33.5 ms5,8).
The BRMB9 amino acid data base reports the following coupling constants for the β-methylene protons (δ2.7 ppm) of aspartate amino acids: ~5 and ~8 Hz between α-methylene and β-methylene protons; 17.5 Hz between β-methylene protons. These values are comparable with those of the aspartate moieties of NAA and NAAG and the aspartate metabolite10, all experiencing full inversion at echo times of 52 to 60 ms. All these confirm further the preliminary attribution of the M8 resonance by Giapitzakis et al6 to β-methylene protons of aspartyl groups.
The spectral fitting of this study modeled the M8 resonance line as either a positive or negative peak depending on the TE, which should be modeled as a J-coupled spin system for correct T2 estimation. The relaxation time of the residual creatine peak had a high intersubject variation in our measurements, but was overall in agreement with the reported 68 ms11.
The large FWHMs of the MM resonances compared to the T2 relaxation times indicate, that these peaks are composed of different protons resonating at similar chemical shifts. These peaks could originate from amino acids12. Depending on the larger protein structure that they belong to, they can have different chemical shifts centered around a mean resonance frequency9. Further work needs to be done to create a model for these MMs as amino acids.
Acknowledgements
For the funding by the Horizon 2020/ CDS-QUAMRI grant and SYNAPLAST grants.References
1. Cudalbu C, Mlynárik V, Gruetter R. Handling macromolecule signals in the quantification of the neurochemical profile. Journal of Alzheimer's Disease 2012;31:S101-S115.
2. Schaller B, Xin L, Cudalbu C, Gruetter R. Quantification of the neurochemical profile using simulated macromolecule resonances at 3 T. NMR in Biomedicine 2013;26:593-599.
3. Považan M, Strasser B, Hangel G, Heckova E, Gruber S, Trattnig S, Bogner W. Simultaneous mapping of metabolites and individual macromolecular components via ultra‐short acquisition delay 1H MRSI in the brain at 7T. Magnetic resonance in medicine 2018;79:1231-1240.
4. Louis MS, Alosco M, Rowland B, Liao H, Wang J, Koerte I, Shenton M, Stern R, Joshi A, Lin AP. Using Machine Learning techniques for identification of Chronic Traumatic Encephalopathy related Spectroscopic Biomarkers. doi.
5. Pfeuffer J, Tkáč I, Provencher SW, Gruetter R. Toward an in vivo neurochemical profile: quantification of 18 metabolites in short-echo-time 1H NMR spectra of the rat brain. Journal of magnetic resonance 1999;141:104-120.
6. Giapitzakis IA, Avdievich N, Henning A. Characterization of macromolecular baseline of human brain using metabolite cycled semi‐LASER at 9.4 T. Magnetic resonance in medicine 2018;80:462-473.
7. Provencher S. LCModel & LCMgui user’s manual. Stephen W. Provencher 2005. doi.
8. de Graaf RA, Brown PB, McIntyre S, Nixon TW, Behar KL, Rothman DL. High magnetic field water and metabolite proton T1 and T2 relaxation in rat brain in vivo. Magnetic Resonance in Medicine: An Official Journal of the International Society for Magnetic Resonance in Medicine 2006;56:386-394.
9. Ulrich EL, Akutsu H, Doreleijers JF, Harano Y, Ioannidis YE, Lin J, Livny M, Mading S, Maziuk D, Miller Z. BioMagResBank. Nucleic acids research 2007;36:D402-D408.
10. Govind V, Young K, Maudsley AA. Corrigendum: Proton NMR chemical shifts and coupling constants for brain metabolites. Govindaraju V, Young K, Maudsley AA, NMR Biomed. 2000; 13: 129–153. NMR in Biomedicine 2015;28:923-924.
11. Deelchand DK, Van de Moortele P-F, Adriany G, Iltis I, Andersen P, Strupp JP, Vaughan JT, Uğurbil K, Henry P-G. In vivo 1 H NMR spectroscopy of the human brain at 9.4 T: initial results. Journal of Magnetic Resonance 2010;206:74-80.
12. Behar KL, Ogino T. Characterization of macromolecule resonances in the 1H NMR spectrum of rat brain. Magnetic resonance in medicine 1993;30:38-44.
Figures