2243
Determination of Macromolecule Baselines by Variable Inversion-Recovery of Metabolites1National Institute of Mental Health, National Institutes of Health, Bethesda, MD, United States
Synopsis
A novel approach for determining macromolecule baselines at medium TE was proposed. Inversion recovery was combined with spectral editing to acquire six sets of MRS data using two editing frequencies and three long inversion times (TI). Macromolecule signals were essentially invariant across the three long TIs but metabolite signal amplitudes were significantly modulated by TI. By simultaneously fitting the six sets of data, metabolite and macromolecule signals were reliably separated without using empirical constraints on the amplitudes of the spline baselines. Compared to existing techniques, this approach exploits both T1 and T2 differences between metabolites and macromolecules.
INTRODUCTION
In 1H Magnetic Resonance Spectroscopy (MRS), macromolecule resonances overlap with metabolite resonances. For short TE sequences, an additional macromolecule spectrum is often acquired at the metabolite null and then subtracted from the short-TE spectrum to remove the macromolecule contributions. Some residual metabolite signals in the macromolecule spectrum are unavoidable due to the wide range of metabolite T1 values. A few residual metabolite peaks can be fitted and removed from the macromolecule spectrum, but the rest residual metabolite signals are left untouched. Most importantly, macromolecule signals are also partially saturated by the inversion pulses that are used to generate the metabolite null. This partial saturation of macromolecule signals causes significant error in baseline subtraction especially when macromolecule T1s are not very short (1). For long TE sequences, macromolecule signals in a spectrum can be readily fitted by a smooth spline baseline. For MRS data acquired at medium TEs, broad metabolite lineshape due to dispersive components of coupled spins can introduce significant uncertainty and often requires predefined constraints in macromolecule baseline fitting. In this work, we propose to extract macromolecule baselines using multiple sets of inversion recovery MRS data acquired at long TIs to allow full recovery of macromolecule baselines.METHODS
The pulse sequence used in this study (Figure 1) was modified from Ref. (2) for two-step detection of glutamate, glutamine, g-aminobutyric acid (GABA), and glutathione at 7 T. A 180° hyperbolic secant pulse was used for inversion recovery with three different TIs: no inversion, 2150 ms, and 1600 ms. Macromolecule signals are essentially fully recovered at TI = 2150 and 1600 ms, but metabolite signals can be saturated by as much as 50% at TI = 1600 ms. The MRS data acquired with these three different TIs contain essentially the same macromolecule signals but different partially recovered metabolite signals.
Three healthy volunteers were scanned using a Siemens 7 T scanner. Data were collected from a 2 × 2 × 2 cm3 voxel in the grey matter dominant region of pregenual anterior cingulate cortex (pgACC). The same scan was repeated three times for each subject. During each scan, interleaved data acquisitions were performed going through the six different settings that consisted of the two editing frequencies (1.89 ppm and 2.12 ppm) and the three TIs. The six sets of reconstructed spectra were fitted simultaneously in the range of 1.8 – 3.7 ppm by linear combination of the basis functions of 16 metabolites and spline baselines. The baselines were the same for the three different TIs but partially different for the two editing frequencies. Each spline baseline had 16 control points and their amplitudes were not constrained. The concentration and T1 values of the metabolites, as well as the two spline baselines were determined.
RESULTS
A representative data set is shown in Figure 2. Metabolite concentration and T1 values are given in Table. 1, which closely agree with previous 7 T results from the same anatomical location (2). The unconstrained macromolecule baseline retained the spectral feature expected from the known macromolecule resonances in the fitted 1.8 – 3.7 ppm range. As can be seen in Fig. 2, the macromolecule peak at ~ 3 ppm was higher when the editing pulse was applied at 1.89 ppm than at 2.12 pm. This agrees with the previous report (3) that the M7 macromolecule resonances at 3.01 ppm are coupled to the M4 macromolecule resonances at 1.72 ppm, which was affected by the editing pulse at 1.89 ppm. Overall, the fit residuals are small and the metabolite concentration and T1 values obtained from the fitting agree with literature.
DISCUSSION AND CONCLUSION
A novel approach for determining macromolecule baselines at medium TE was proposed. Inversion recovery was combined with spectral editing to acquire six sets of MRS data using two editing frequencies and three long TIs. Macromolecule signals were essentially invariant across the three TIs, but metabolite signal amplitudes were significantly modulated by TI. By simultaneously fitting the six sets of data, metabolite concentrations, T1s, and macromolecule baselines were obtained. In the fitting process, metabolite T1 values were used to compute the TI modulation of metabolite amplitudes across the data sets with three different TIs. By conforming to the same macromolecule baselines for all fits at three different TIs, macromolecule baselines were determined without any empirical amplitude constraints. Compared to existing techniques, this approach exploits not only the linewidth differences but also the T1 differences between metabolites and macromolecules. The increased information content therefore led to determination of macromolecule baselines without a priori amplitude constraints.References
Xin LJ, Schaller B, Mlynarik V, Lu HX, Gruetter R. Proton T-1 Relaxation Times of Metabolites in Human Occipital White and Gray Matter at 7 T. Magnetic Resonance in Medicine 2013;69(4):931-936.
An L, Araneta MF, Johnson C, Shen J (2018) Simultaneous measurement of glutamate, glutamine, GABA, and glutathione by spectral editing without subtraction. Magn Reson Med 80 (5):1776-1786.
Behar KL, Rothman DL, Spencer DD, Petroff OA. Analysis of macromolecule resonances in 1H NMR spectra of human brain. Magn Reson Med. 1994 Sep;32(3):294-302.
Figures
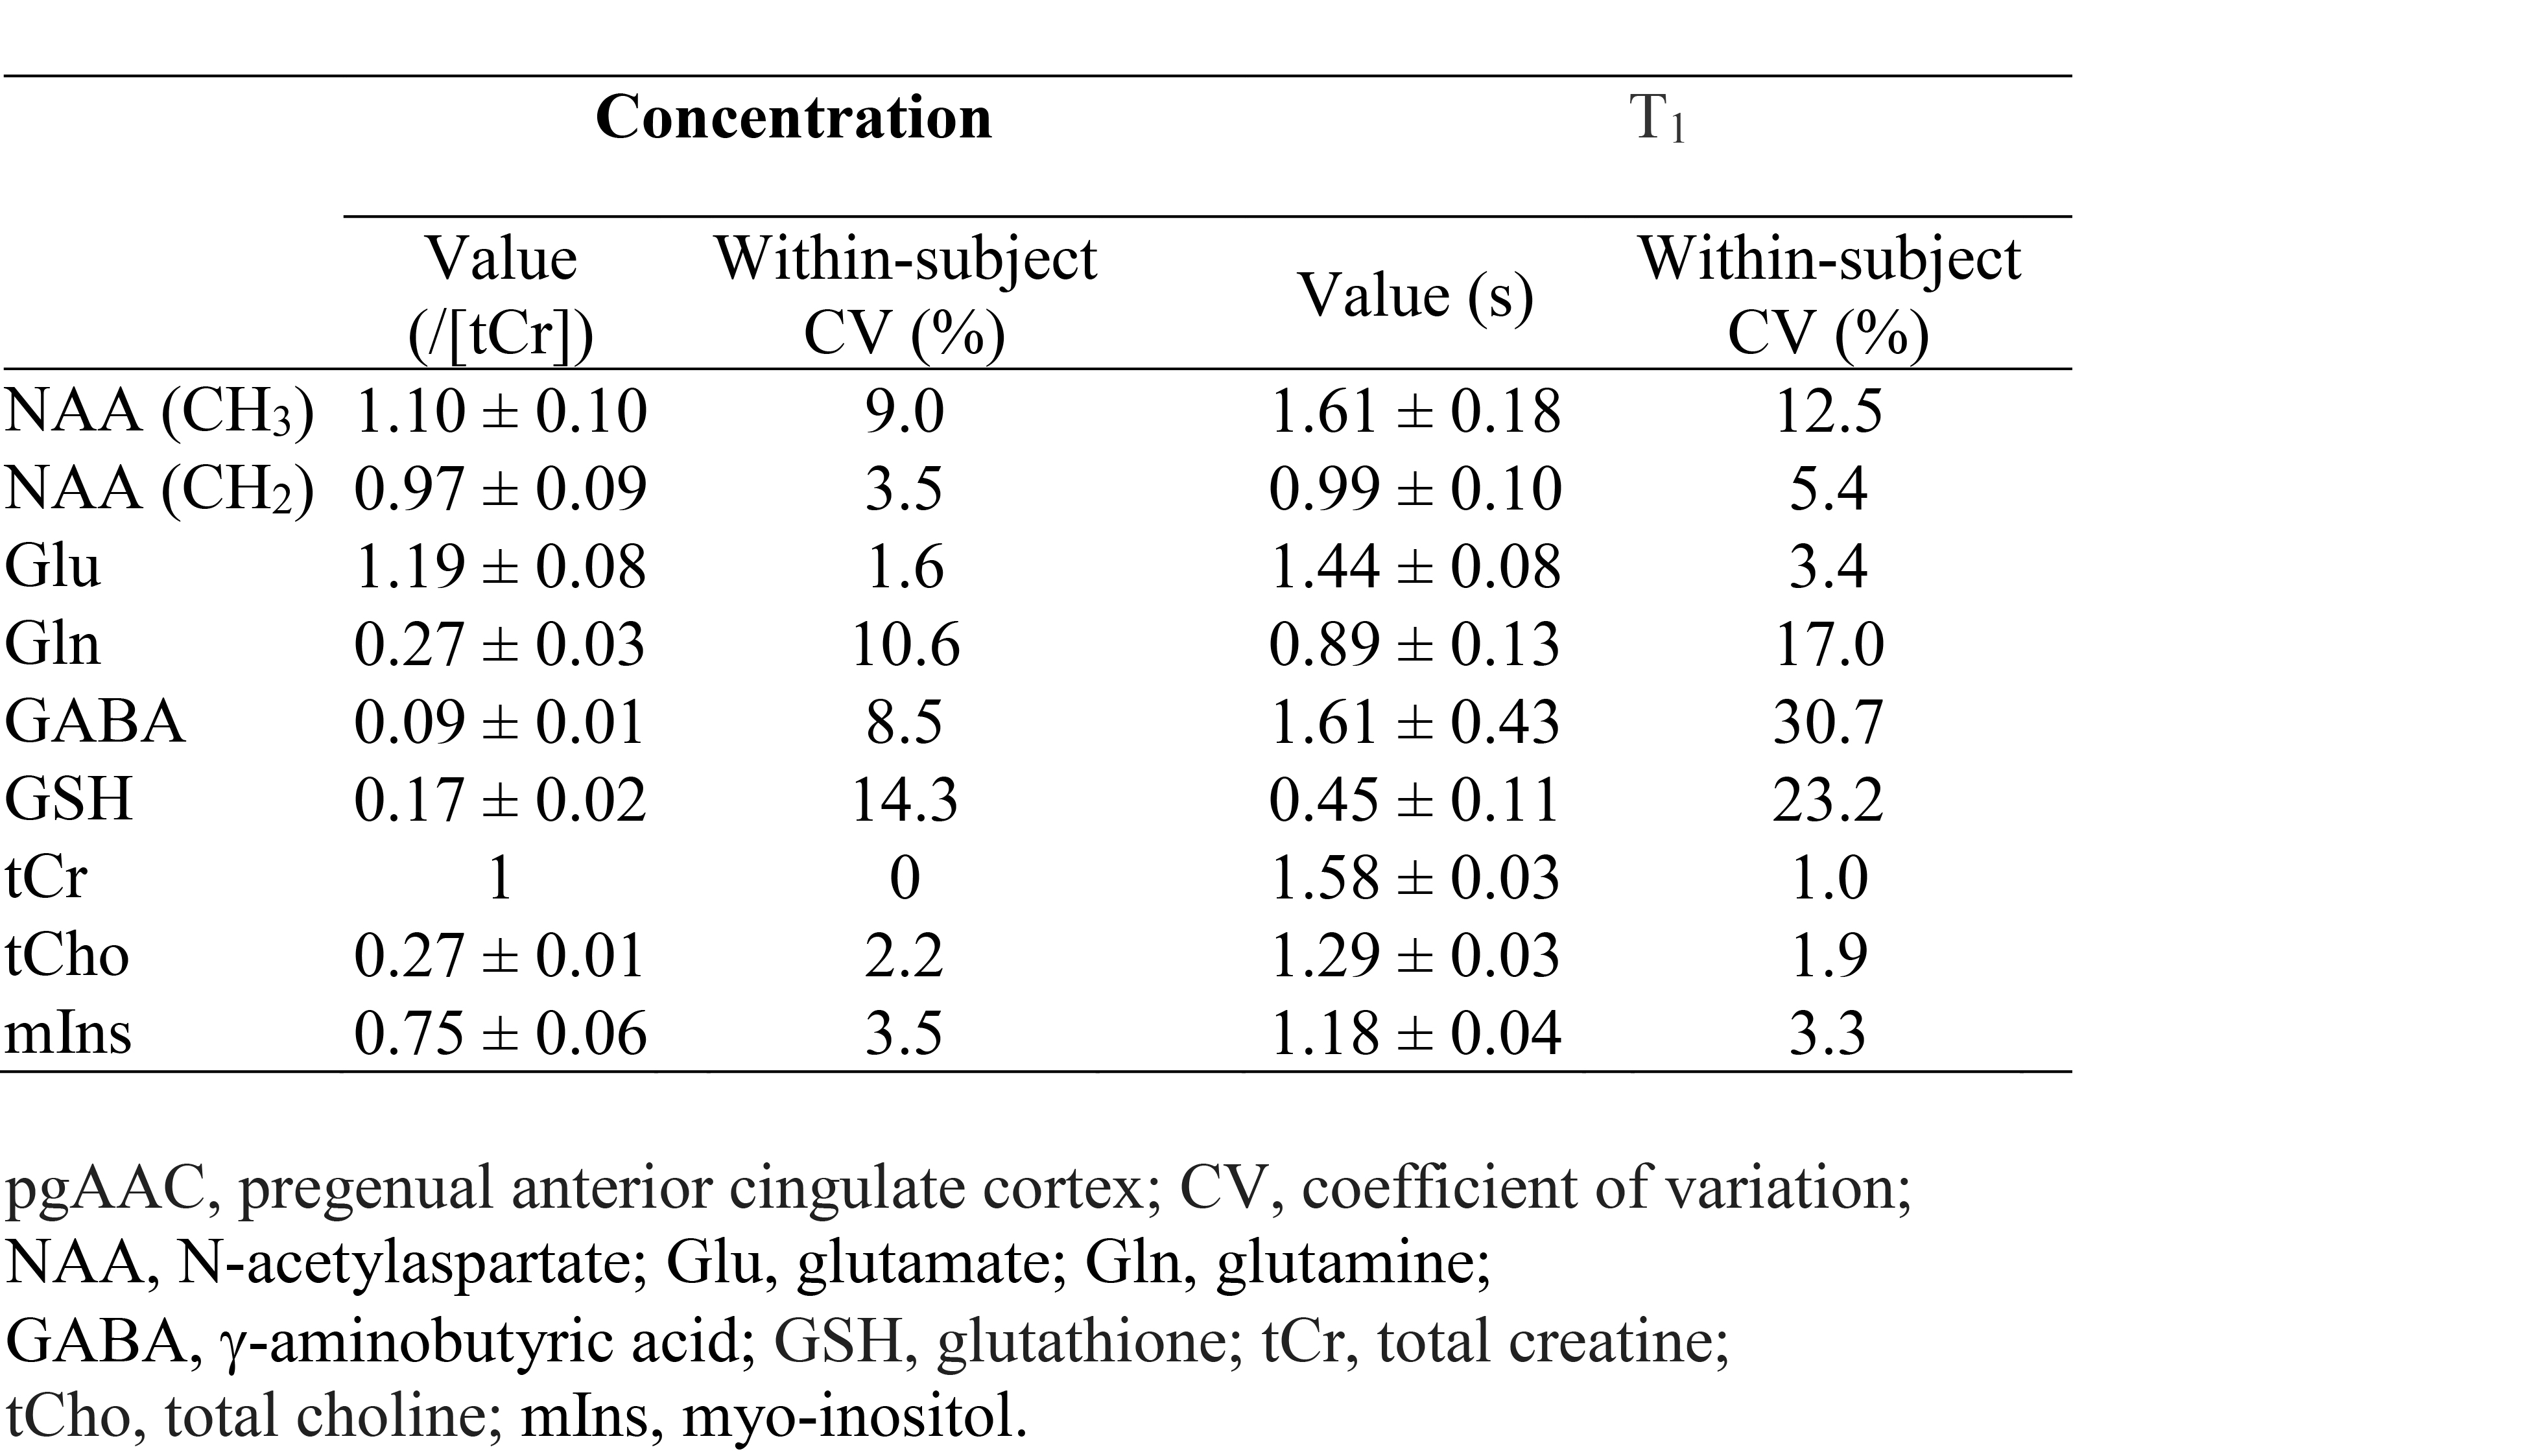
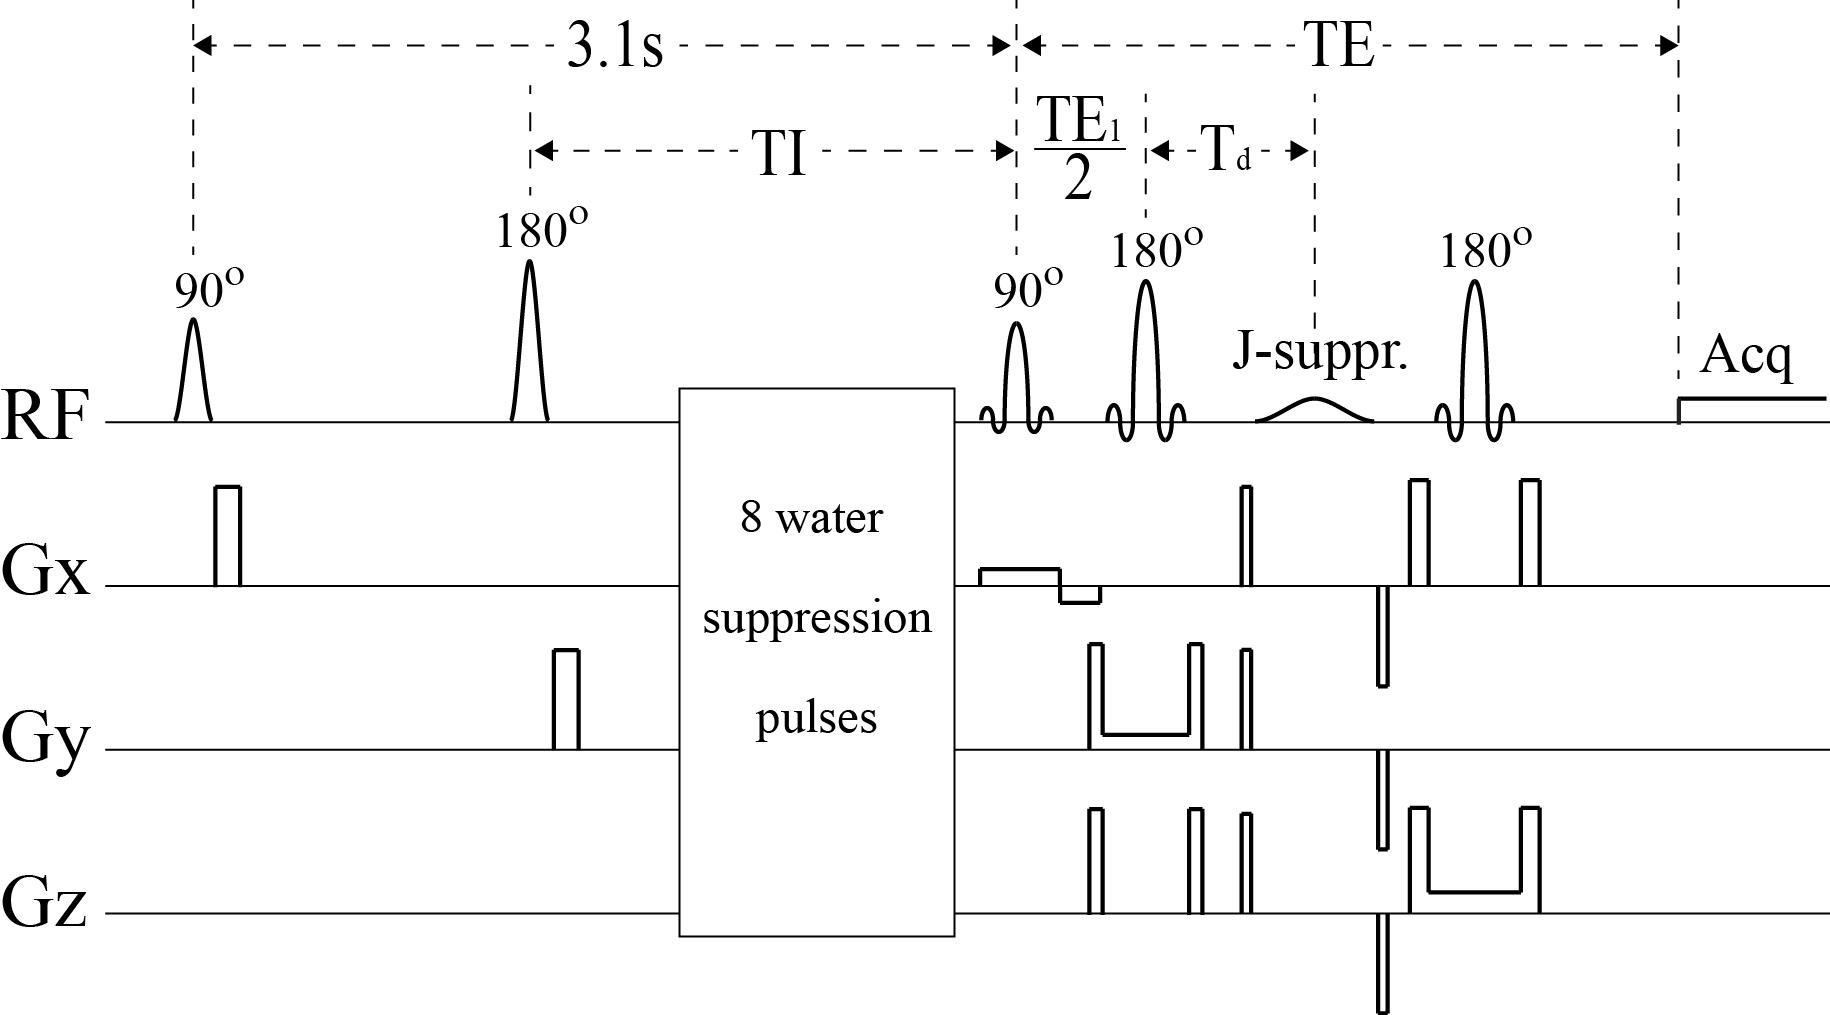
Fig. 1 Schematics of the pulse sequence. TR = 3.5 s; TE = 56 ms; TE1 = 40 ms; Td = 15.3 ms; editing RF pulse frequency = 1.89 ppm and 2.12 ppm; TI = no inversion, 2150 ms, and 1600 ms.
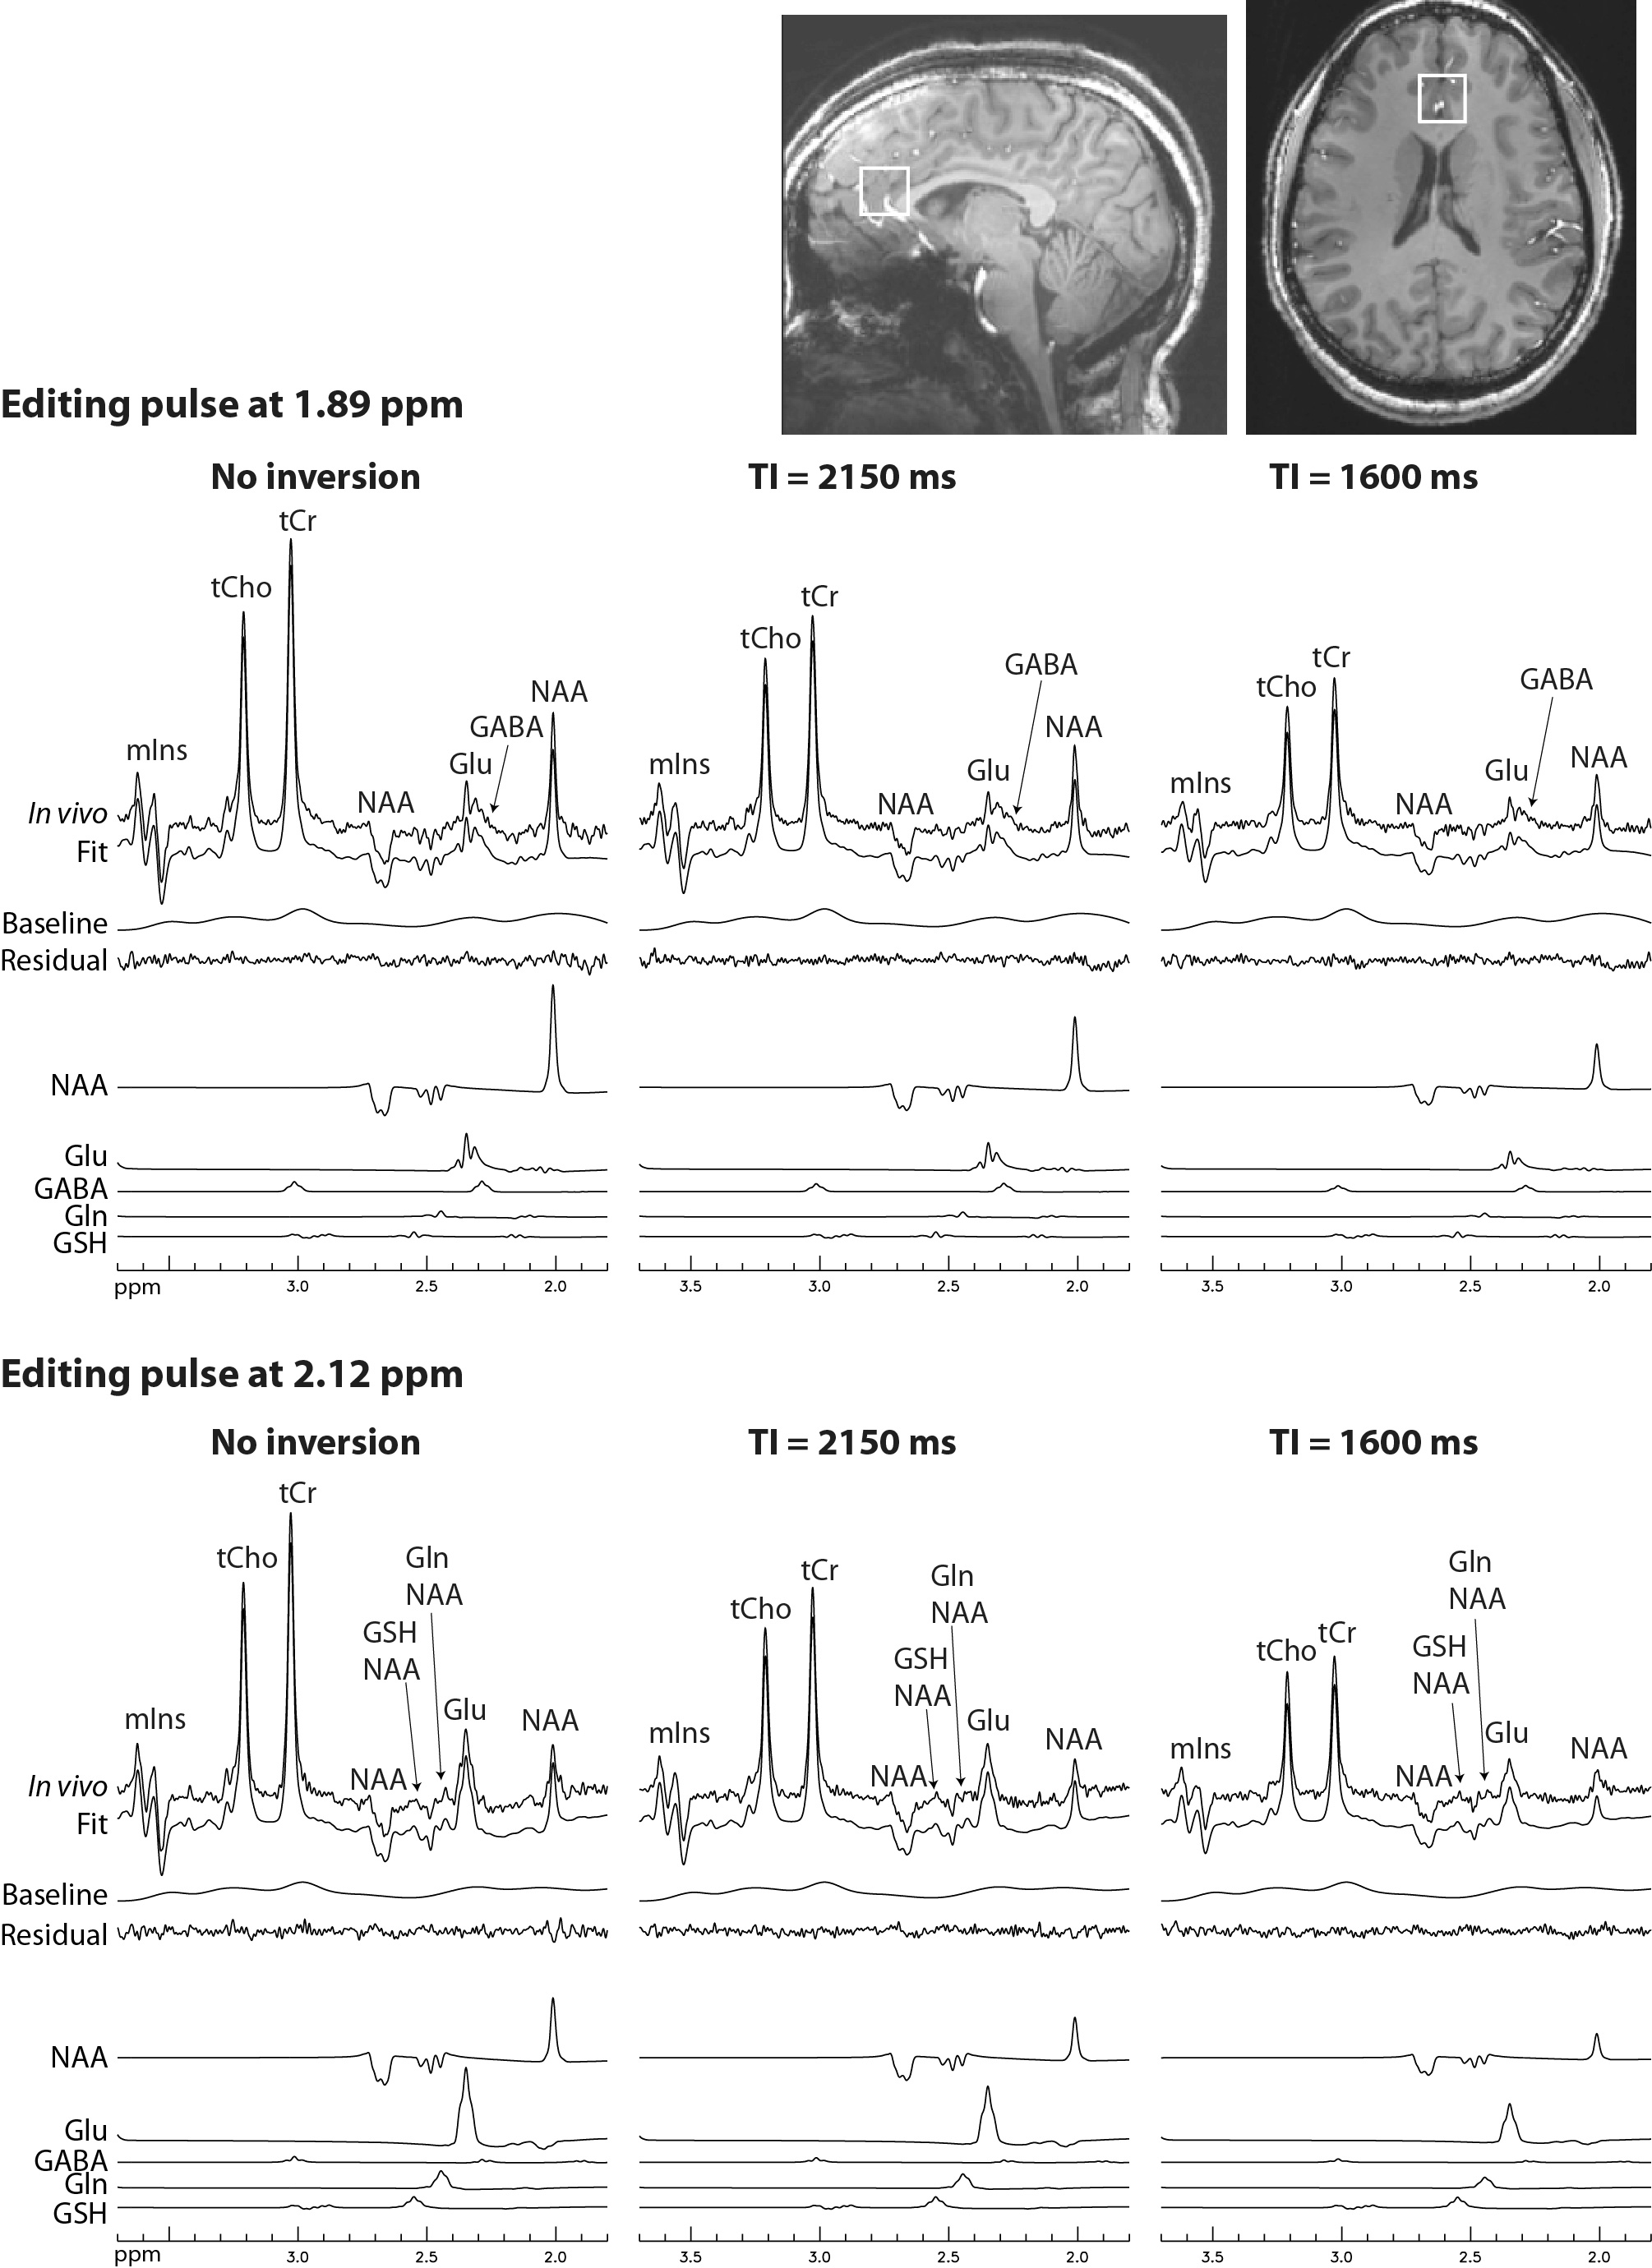
Fig. 2 Reconstructed spectra and corresponding fits from a 2 × 2 × 2 cm3 voxel in the pregenual anterior cingulate cortex (pgACC) of a healthy volunteer. TR = 3.5 s; TE = 56 ms; spectral window = 4000 Hz; number of data points = 1024; total number of averages = 132; and total scan time = 7 min and 53 s.