2242
Comparison of baseline effect on short-TE and 1D JPRESS MRS data fitting1National Institute of Mental Health, Bethesda, MD, United States
Synopsis
For in vivo MRS spectral fitting, a baseline is often used to model background signals. The existing algorithms including LCModel rely on the linewidth to distinguish metabolite peaks from the background signals. In this work, we show that the fitted short-TE baseline strongly depends on metabolite linewidth due to large baseline-metabolite covariances. This dependence negatively affects metabolite quantification using short-TE MRS, resulting in large errors in metabolite concentrations. We also demonstrate that this baseline problem can be largely eliminated using 1D JPRESS which benefits from its substantially reduced background signals.
Introduction
Background signals of in vivo MRS arise from macromolecules and/or lipids and residual water. The baseline due to background signals can be problematic for metabolite quantification because it overlaps with metabolite peaks. The background in LCModel [1] is fitted using a relatively smooth baseline in addition to the fit basis of macromolecules. In this work, we used LCModel to demonstrate that the fitted short-TE baseline strongly depends on metabolite linewidth. This dependence negatively affects metabolite quantification using short-TE MRS. We also demonstrated that this baseline problem can be largely eliminated using 1D JPRESS.Methods
1D JPRESS 1D JPRESS is an in-house developed method for quantifying 2D JPRESS data [2]. For J-coupled spins, the resonance signals attenuate rapidly in the time domain because of T2 relaxation and J-evolution. We used TE = 160 ms for the last echo of JPRESS, resulting in a spectral resolution of ~6 Hz in the J-dimension. In addition to its low spectral resolution, the J-dimension also has a very narrow spectral width because J-coupling constants of metabolite protons are generally less than 10 Hz. Given its low resolution and spectral width, the J-dimension in the frequency domain can be sufficiently characterized using a few points. The 1D JPRESS used only two cross-sections at J = 0 and J =7.5 Hz, which were concatenated into a single one-dimensional spectrum for spectral fitting. Spectral fitting of 1D JPRESS data were programmed using Java and fully automated without user interventions [3]. In Vivo Data Acquisition and Processing MRS data were acquired using both short TE (TE = 35 ms) PRESS and JPRESS from a cubic region (8 mL) in anterior cingulate cortex of eight healthy subjects (mean age = 39) at 3 Tesla. For JPRESS acquisition, starting TE = 35 ms, echo spacing = 4 ms, and echo number = 32. To examine the effect of metabolite linewidth on baseline modeling a second data set was generated by multiplying the raw FIDs in time domain by an exponential decay function with a line broadening factor of 1 Hz. Both short-TE data sets were quantified using LCModel with default settings. Quantification of 1D JPRESS data was described previously [3].Results and Discussion
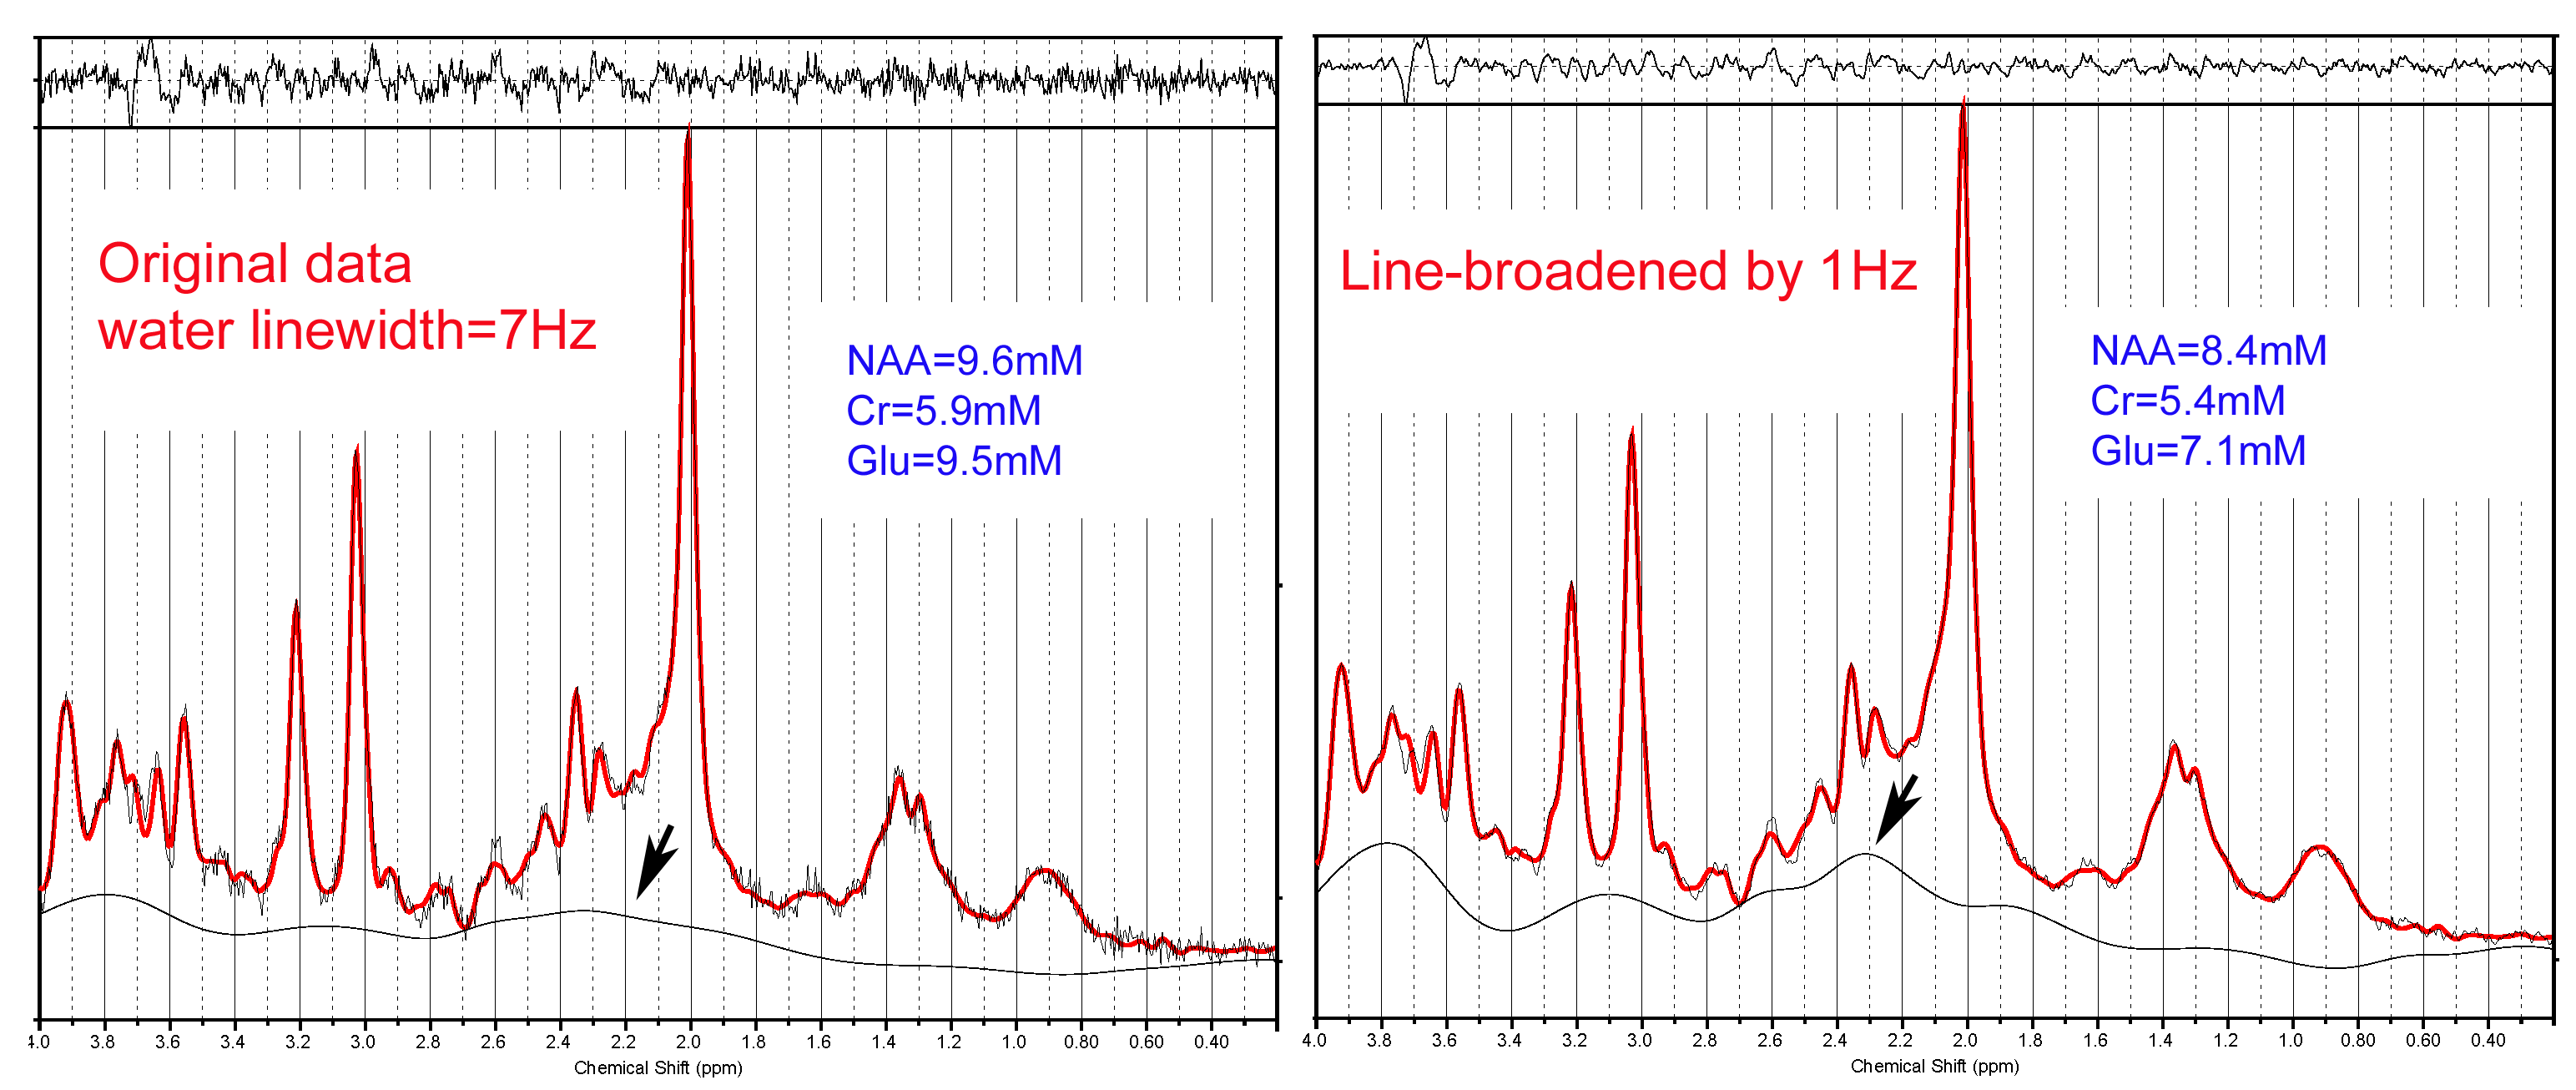
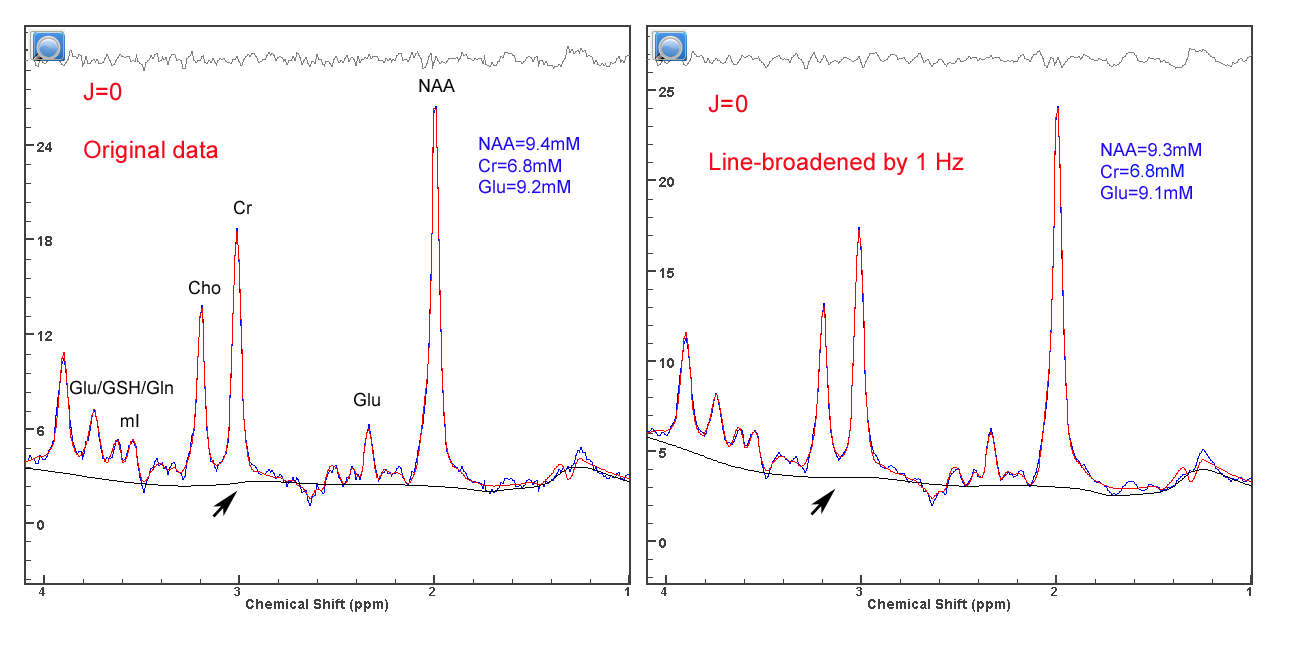
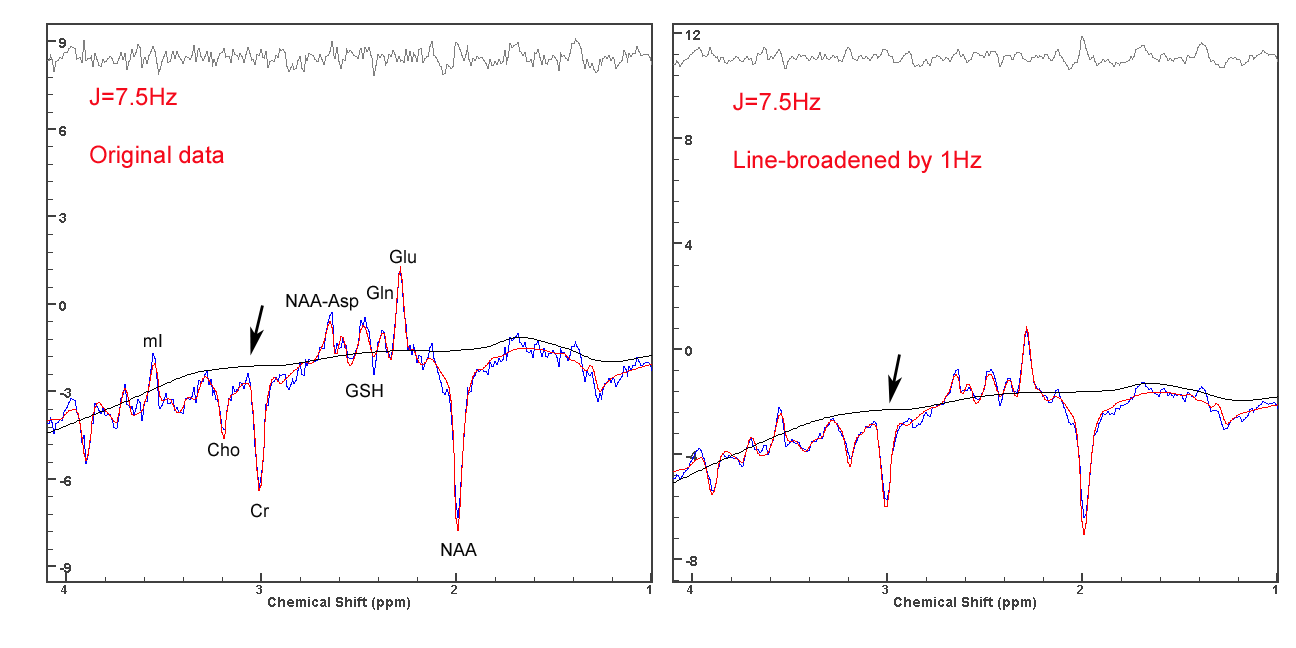
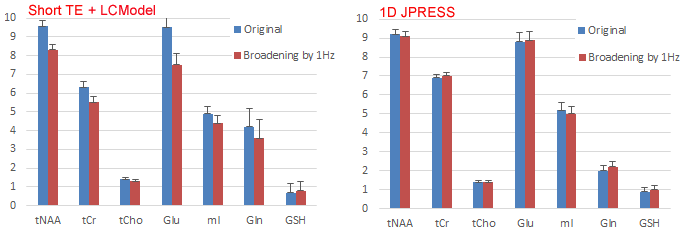
Fig. 1 compares LCModel fits of an in vivo short TE spectrum before and after 1 Hz line-broadening. Without the line-broadening, the unsuppressed water reference linewidth reported by the scanner was 7 Hz. Note that the estimated baselines (marked by arrows) are an addition to the macromolecule signals that had been incorporated into the model as basis set. After multiplying the raw FIDs by a 1 Hz exponential decay function LCModel yielded smaller metabolite levels and a stronger baseline especially for the region near 2.3 ppm. In Fig. 1, NAA and Cr levels were reduced by ~10% and Glu level was lowered by ~20% after the line-broadening. The apparent reduction in metabolite concentrations was more pronounced with greater line-broadening. Fig. 2 and Fig. 3 are the JPRESS cross-sections at J = 0 and J = 7.5 Hz from the same subject. 1 Hz line broadening had essentially no effect on quantification of the 1D JPRESS data. The results of all eight subjects are displayed in Fig.4. Spectral fitting algorithms including LCModel rely on the linewidth to distinguish metabolite peaks from the background signals. Broad spectral linewidth in the presence of strong baseline, as often seen with short TE techniques, can lead to significant quantification errors because of large baseline-metabolite covariances. In comparison, data acquired using long echo techniques such as 1D JPRESS contain much smoother baselines therefore are much less affected when the linewidths of the metabolites are not optimal. In a previous study, the estimation uncertainties caused by the baseline were quantitatively analyzed using Cramer Rao Lower Bound (CRLB) of the baseline [4], which revealed that the estimation uncertainties significantly increased with decreased baseline smoothness and broadened spectral linewidth. As shown by this study, 1D JPRESS can dramatically suppress the background signals and allow the use of a much smoother baseline than short TE. The very high degree of baseline smoothness in 1D JPRESS effectively diminishes the interactions between the baseline and metabolite peaks.Conclusion
Quantification of short TE MRS spectra is found to be highly sensitive to metabolite linewidth. Broader metabolite linewidth generally leads to an underestimation of metabolite signals by LCModel. In comparison, 1D JPRESS minimizes baseline. Its quantification is insensitive to metabolite linewidth.Acknowledgements
No acknowledgement found.References
1) Povencher SW, Estimation of metabolite concentrations from localized in vivo proton NMR spectra. Magn Reson Med 1993; 30:672-9.
2) Schulte RF, Boesiger P. ProFit: two-dimensional prior-knowledge fitting of J-resolved spectra. NMR Biomed. 2006; 19: 255–263.
3) Zhang Y, Shen J. Simultaneous quantification of glutamate and glutamine by J-modulated spectroscopy at 3 Tesla. Magn. Reson. Med. 2016; 76:725-32.
4) Zhang Y, Shen J. Smoothness of in vivo spectral baseline determined by mean-square error. Magn Reson Med. 2014; 72:913-22.
Figures